
A spruce budworm outbreak here has me worried about the long-term health of our forest, given that climate change is likely to substantially alter conditions here in Montana. The nightmare scenario is for temperatures to warm up without soil moisture keeping up, so that drought-weakened trees are easily ravaged by budworm and other pests, unchecked by the good hard cold you can usually count on here at some point in January, with dead stands ultimately burning before a graceful succession of species can take place. The big questions, then, are what’s the risk, how to see it coming, and how to adapt.
To get a look at the risk, I downloaded some GCM results from the CMIP3 archive. These are huge files, and unfortunately not very informative about local conditions because the global grids simply aren’t fine enough to resolve local features. I’ve been watching for some time for a study to cover my region, and at last there are some preliminary results from Eric Salathé at University of Washington. Regional climate modeling is still an uncertain business, but the results are probably as close as one can come to a peek at the future.
The future is generally warmer. Here’s the regional temperature trend for my grid point, using the ECHAM5 model (downscaled) for the 20th century (blue) and IPCC A2 forcings (red), reported as middle-of-the-road warming:
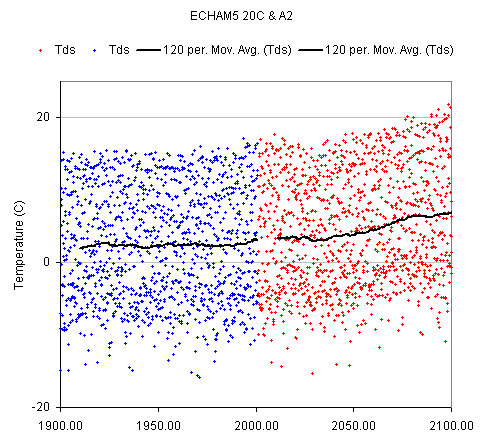
By the end of the 21st century it’s at least 3.5 degrees C warmer (6 degrees F) than today (based on the smoothed trend, which lags reality). Bear in mind that this is a single realization from a single model, and that natural variability, model differences, and uncertainty make the range of possible outcomes rather wide (though cooling is not really on the table). Also note that most of the variability you see above is seasonal, as these are monthly means. From the trend, it’s hard to tell how well the model is reflecting reality; it’s more informative to look at the 1971-2000 model monthly means against the corresponding seasonal pattern in the US Climate Normals data:
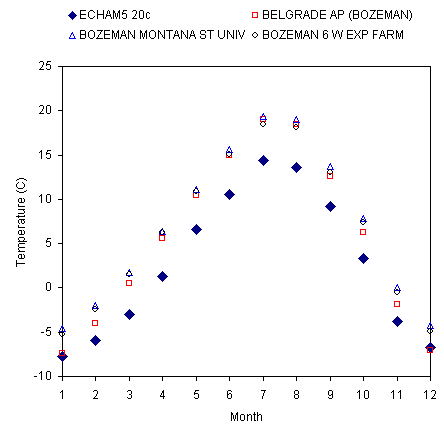
The model is a bit cool overall, particularly in summer. For precipitation, the picture is less reasonable. The modeled precipitation pattern is too low and seasonally out of phase:
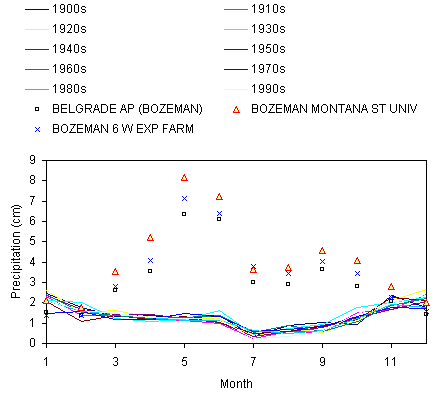
I find that a bit discouraging, but not really surprising. Precipitation is very sensitive to topography and other phenomena that are below grid scale, uncertain, or otherwise poorly represented in models. (It’s also possible that I just screwed this up.)
Given the possible trends, I wondered, where are we moving? Will Montana 2100 be like Mexico, New Mexico, Colorado, or Wyoming? I looked up latitudinal temperature gradients and the like, which was not encouraging. During the hypsithermal (early holocene) which was only slightly warmer than today, Montana’s climate was well north in Canada. Nothing I found was really helpful though. So, I decided to find out where, if anywhere, was today like Montana might be in the future.
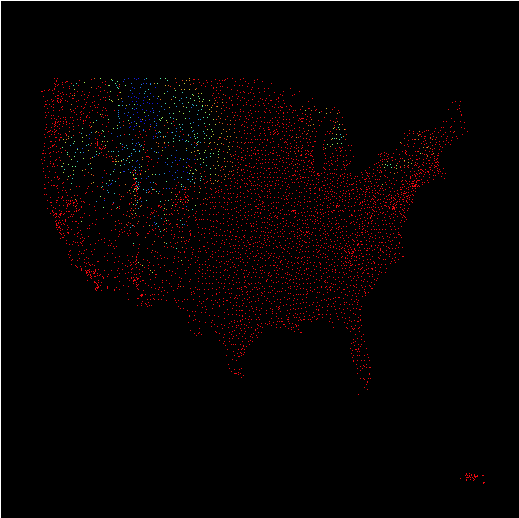
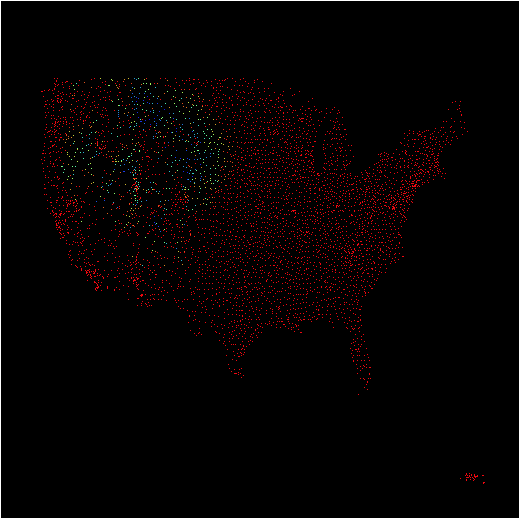
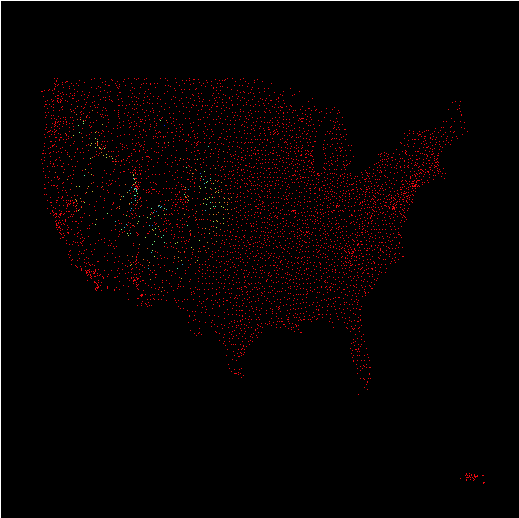
For that, I turned again to the US climate normals for 1971-2000, and built a database that permitted comparison of the climates at various stations, with the addition of changes in temperature and precipitation. I constructed similarity metrics for temperature, precipitation, winter-summer ranges, and variability. Using those, I looked for stations that look like an amalgam of 3 stations near here (Bozeman). With current conditions, the distribution of stations looks like the following (blue is similar; red is dissimilar; scaling is arbitrary):
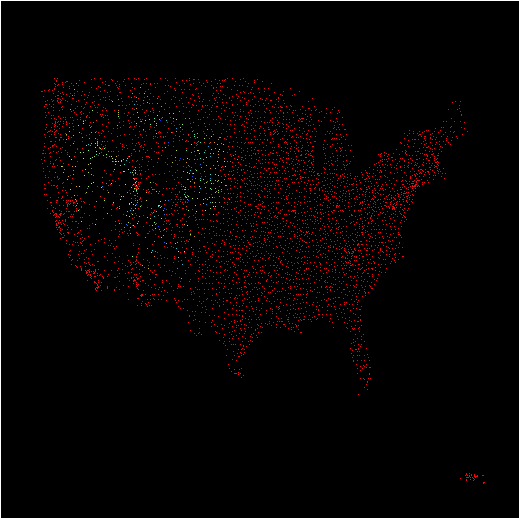
After 3 degrees Fahrenheit of warming, the center of mass has moved, but things aren’t terribly different:
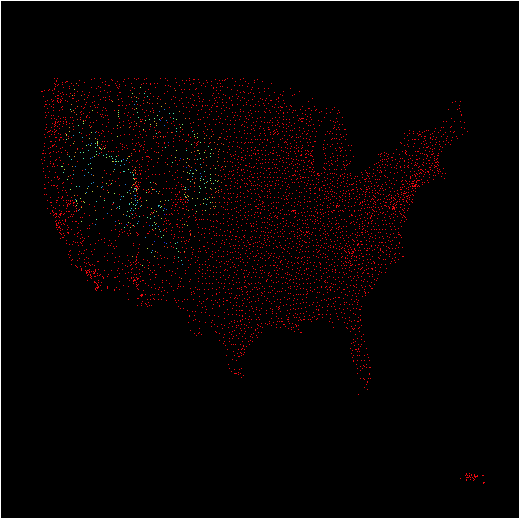
At least the most similar stations are still generally in Montana, sometimes even nearby (Big Timber and Livingston, for example), though ecologically noticeably different. At +6F, things look very different. The most similar stations are scattered around CO, UT, NE, NM and WY – only two of the top 20 are in MT (and those are more than 1000 feet lower in elevation). Also, there are noticeably fewer good analogs (blue dots):
More or less precipitation changes the picture somewhat. 30% drier analogs are more concentrated to the west (Montrose CO, Glenrock WY, Natural Bridges UT, and Otis NM are leading contenders):
If it gets 30% wetter (15% wetter being a typical estimate), the center of mass shifts east (Yellowtail Dam MT, Dalton NE, Crawford NE, and Albin WY):
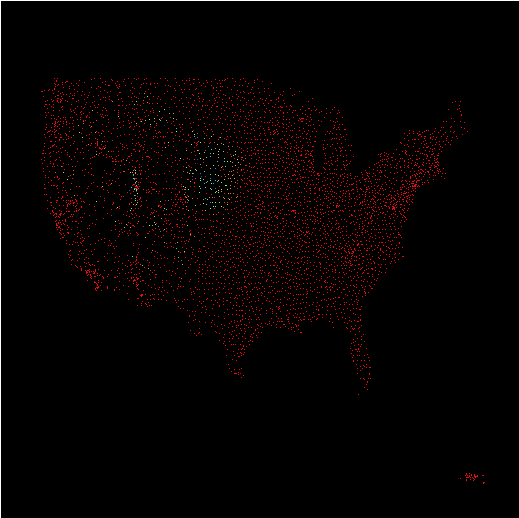
When things really warm up, to +9 degrees F (not at all implausible in the long run), 16 of the top 20 analogs are in CO and UT, with the other four in AZ, NM, NE, and MT. The one that remains in MT (Yellowtail Dam) looks like an outlier in the Climate Normals dataset.
Looking at a lot of these future climate analogs on Google Earth, their common denominator appears to be rattlesnakes. I’m sure they’re all nice places in their own way, but I’m worried about my trees. I’ll continue to hope that my back-of-the-envelope analysis is wrong, but in the meantime I’m going to hedge by managing the forest to prepare for change.
3 thoughts on “Flying South”