
From time to time I run across this EIA page on long term oil forecasts. It contains what has to be one of the goofier oil depletion trajectories out there:
EIA describes the figure as follows:
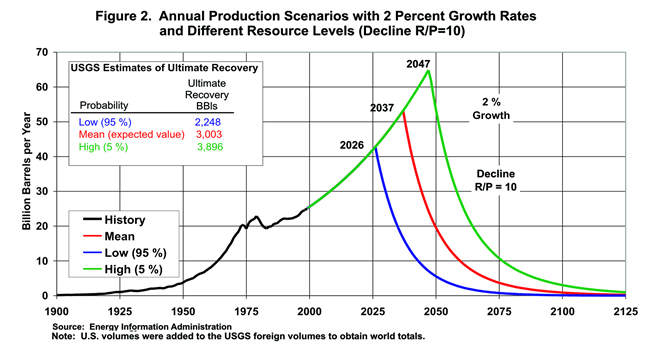
The particular scenario shown in Figure 2 depicts the 2 percent demand growth experience of recent years extended up to the production peak (similar to the 2.2 percent rate applied through 2020 in EIA’s 2002 International Energy Outlook) and then the decline path from the peak at a constant R/P ratio of 10. The three divergent curves shown reflect alternative resource base volumes. …
What this implies in the oil patch is nothing short of miraculous. The downside of the curve is an exponential decay in production of 10%/year (i.e. production/reserves = 10%, the inverse of the R/P ratio of 10). That comes from the typical lifecycle of an exploited oil field. For production to decline at that rate, there must be no further discoveries once peak production occurs. Thus the figure implies that somehow oil producers coordinate the discovery and development of every last field, right up to the date of the peak, then abruptly give up exploration and run the known fields out to the end of their productive life. That’s quite a feat, even for a cartel. What could we imagine happening, with conventional oil production falling that fast? Chaos? Energy efficiency improving 12% per year, to make up the gap between rising GDP and falling production? Oil sands and other unconventional resources picking up the slack? The last seems unlikely, with conventional production initially falling by roughly five billion barrels per year per year along the R/P=10 path.
What is the implication of a more realistic shape? First, one would expect a longer tail on production, as ongoing discoveries mingle with the depletion of existing fields. Second, one would expect a smooth peak, as different fields peak at different times. Would that be good or bad? For a given resource endowment (i.e. area under the production curve), a long tail and smooth peak implies that production must hit an inflection point much earlier than the EIA scenarios indicate. In one sense, that’s good, because it makes it easier for unconventional sources to gradually pick up the slack. But it also brings the stress of slowing production much closer to the present.
A second graphic shows more sensitivity results:
EIA notes:
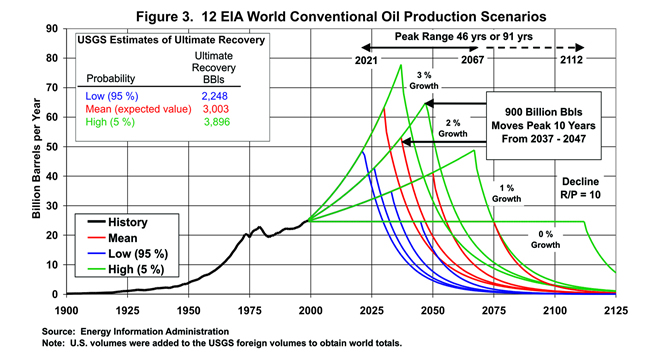
These results are remarkably insensitive to the assumption of alternative resource base estimates. For example, adding 900 billion barrels — more oil than had been produced at the time the estimates were made — to the mean USGS resource estimate in the 2 percent growth case only delays the estimated production peak by 10 years. Similarly, subtraction of 850 billion barrels in the same scenario accelerates the estimated production peak by only 11 years.
It is worth noting that a 1 percent decrease in the pre-peak growth rate has roughly the same effect that adding 900 billion barrels to the estimated resource base does.
Of course, this is just the old French riddle of the lily pond, or the grains of rice on a chessboard. Large differences in the resource base are quickly consumed by exponential growth. It’s fairly easy to develop a closed-form version of the EIA trajectory, in which Tp = [ ln(U-C0+P0/g)-ln(P0/g+P0/r) ]/g, where Tp = time to peak, U = ultimate resource, C0 = cumulative production prior to time of estimate, P0 = production rate at time of estimate, g = pre-peak growth rate, r = post-peak decline rate. Time to peak grows logarithmically (i.e. slowly) with U, and varies inversely with g. It’s a little harder to see, Tp also declines with r, i.e. a long tail to production implies an earlier peak for a given U.
1 thought on “Synchronized Drilling?”