
For the Pangaea model, colleagues have been compiling a useful table of international emissions commitments. That will let us test whether, if fulfilled, those commitments move the needle on global atmospheric GHG concentrations and temperatures (currently they don’t).
I’ve been looking for the equivalent for US states, and found it at Pew Climate. It’s hard to get a mental picture of the emissions trajectory implied by the various commitments in the table, so I combined them with emissions data from EPA (fossil fuel CO2 only) to reconcile all the variations in base years and growth patterns.
The history of emissions from 1990 to 2005, plus future commitments, looks like this:
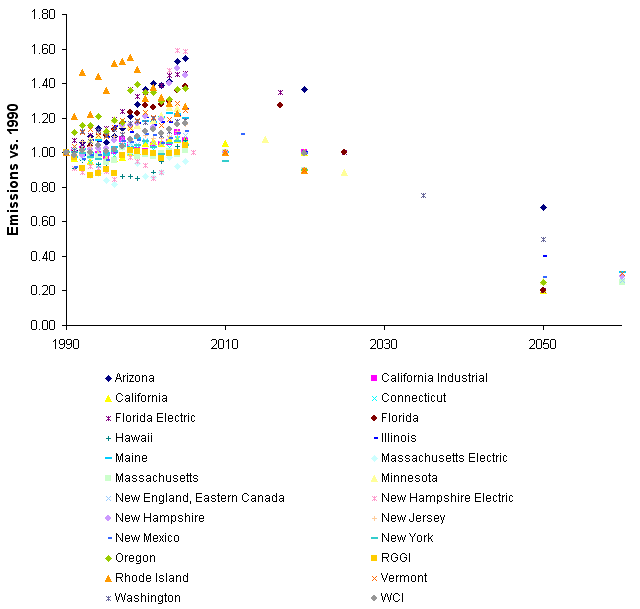
Note that some states have committed to “long term” reductions, without a specific date, which are shown above just beyond 2050. There’s a remarkable amount of variation in 1990-2005 trends, ranging from Arizona (up 55%) to Massachusetts (nearly flat).