I don’t want to wallow too long in metaphors, so here’s something with a few equations.
A recent arXiv paper by Peter Cauwels and Didier Sornette examines market projections for Facebook and Groupon, and concludes that they’re wildly overvalued.
We present a novel methodology to determine the fundamental value of firms in the social-networking sector based on two ingredients: (i) revenues and profits are inherently linked to its user basis through a direct channel that has no equivalent in other sectors; (ii) the growth of the number of users can be calibrated with standard logistic growth models and allows for reliable extrapolations of the size of the business at long time horizons. We illustrate the methodology with a detailed analysis of facebook, one of the biggest of the social-media giants. There is a clear signature of a change of regime that occurred in 2010 on the growth of the number of users, from a pure exponential behavior (a paradigm for unlimited growth) to a logistic function with asymptotic plateau (a paradigm for growth in competition). […] According to our methodology, this would imply that facebook would need to increase its profit per user before the IPO by a factor of 3 to 6 in the base case scenario, 2.5 to 5 in the high growth scenario and 1.5 to 3 in the extreme growth scenario in order to meet the current, widespread, high expectations. […]
I’d argue that the basic approach, fitting a logistic to the customer base growth trajectory and multiplying by expected revenue per customer, is actually pretty ancient by modeling standards. (Most system dynamicists will be familiar with corporate growth models based on the mathematically-equivalent Bass diffusion model, for example.) So the surprise for me here is not the method, but that forecasters aren’t using it.
Looking around at some forecasts, it’s hard to say what forecasters are actually doing. There’s lots of handwaving and blather about multipliers, and little revelation of actual assumptions (unlike the paper). It appears to me that a lot of forecasters are counting on big growth in revenue per user, and not really thinking deeply about the user population at all.
To satisfy my curiosity, I grabbed the data out of Cauwels & Sornette, updated it with the latest user count and revenue projection, and repeated the logistic model analysis. A few observations:
I used a generalized logistic, which has one more parameter, capturing possible nonlinearity in the decline of the growth rate of users with increasing saturation of the market. Here’s the core model:

In principle, the additional degree of freedom should make a wider range of future projections compatible with the data. In practice, it didn’t matter a lot, and my plausible range of user scenarios is substantially narrower than C&S’. In particular, their ‘extreme growth’ scenario saturating at 1.8 billion users seems totally implausible. My best fit yields a user carrying capacity of 950 million. That’s a bit higher than C&S’ 840 million, presumably in part because I have one more (higher) data point than they did.

I fit the model to user data slightly differently, by guesstimating the magnitude of errors in reported user counts, and using that to calculate an explicit least-squares payoff. (Really, both what I’ve done and the method C&S use are potentially biased estimates, so I should have set up a Kalman filter, but I doubt it matters much). The rough likelihoods yield a plausible range of carrying capacities from about 850 million to 1150 million users. Logistic forecasts are notoriously inaccurate, not because they don’t fit the data, but because nonlinearities and structural uncertainty make the early, high-growth phase a poor predictor of the saturation level. Therefore, if I were really putting money on this, I’d want to confirm my results by attempting to make some independent estimates of carrying capacity, e.g. from number of possible computer users in the world.
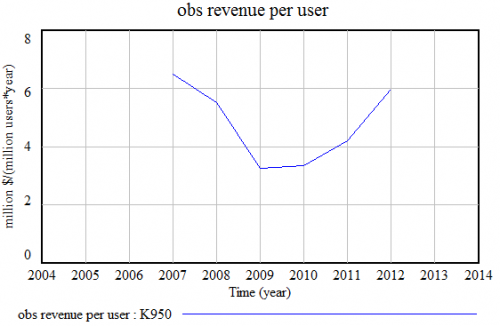
I also slightly refined the estimation of revenue per user. C&S compare the slopes of the revenue and user semi-log lines, but that assumes pure exponential growth, which doesn’t fit well for the newest user data points. More importantly, user measurements are point estimates at the time of reporting, whereas revenues are annual accumulations, and therefore build in some lag. After accounting for that, I get a different picture of revenue per user, ending at $5.88/user/year rather than C&S’ $3.50.

That’s a fairly big difference, but does it justify today’s $70 billion valuation? I don’t think so.
Even if interest rates remain at zero forever, revenue per user would have to more than double (to $13/user/year) to justify that valuation. If interest rates revert (with a 5-year time constant) to a more-realistic 4%/year, revenue per user would have to increase by more than a factor of five.
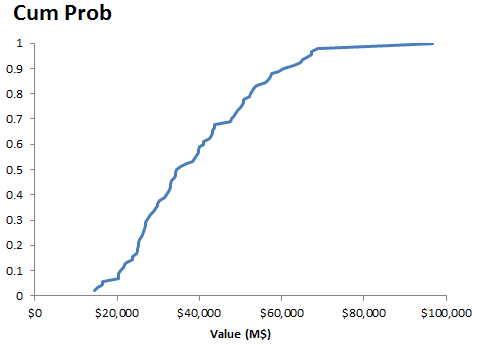
I used Monte Carlo simulation to further refine the valuation. I chose user projections according to statistical likelihood over the historic period. This proved a bit tricky, because the joint distribution of the parameters turns out to be important. Vensim’s sensitivity tool only lets you specify the marginal distributions. So, as a shortcut, I generated a very large sample (30,000 runs) from broad distributions. Most of those runs represent parameter combinations that are duds (i.e. low likelihood or large SSE). But about 100 of them were good, so I chose those for the sample projections. There are more efficient ways to get this job done, but this was good enough given the small model, and should be fairly unbiased.
I added uncertainty in future revenue per user (a truncated normal distribution, with a mean doubling to $12/user/year, a limited downside of $3.50/user/year, and a high variance, hence high upside). I assumed that interest rates return to a long-run rate lower than the prevailing pre-recession rate, with a mean of 3%/yr and sd of 2%/yr, truncated at 0. These are deliberately conservative. I used C&S’ equity risk premium of 5%/yr, which is conservative, especially in a volatile, illiquid pre-IPO market.
The result is a median value of about $35 billion, with a 90% confidence interval of $16 to 67 billion. This is roughly consistent with C&S’ base case of $15 billion, after you account for my higher revenue/user assumption.

There is, of course, a big structural bias in the logistic model: users never go down. In the real world, user bases are subject to erosion from competitive pressure, loss of interest, and other forces. Facebook is presumably not immune to those dynamics. That’s yet another reason that my exercise likely overstates the value.
There’s probably also a structural bias from the fact that the model essentially ignores the “physics” of broadening the scope of sharing rather than the user base. In a sense, I’m optimistic about this, reflected in the doubling of revenue per user, but there’s really a lot more that one could say about expansion opportunities into complementary media and whatnot. Still, I think it’s one thing to posit some high-value, synergistic acquisitions in various niches, and quite another to imagine two or more doublings of average revenue per user across nearly a billion people.
I have to agree with Cauwels & Sornette. The only really strong justification I can see for current Facebook share prices is the greater fool. So, exactly how do you short an illiquid, pre-IPO stock?

Hey Tom!
Inspired by this article, I thought about utilizing system dynamics on a strategy course project dealing with the reasons behind Facebook taking over MySpace: http://blog.comscore.com/facebook-myspace-us-trend.jpg . I would like to build a simple model on Vensim but so far I feel my skills/knowledge is very limited. That’s why I’d like to ask you:
1) How would you build the key loops in the model? For example to match the model to the diagram about, is it ok to use ‘visitors/month’ unit in the main stock of FB and MS visitors?
2) Do you think your model here could be used as a baseline?
3) I really cannot figure out how to model the fact that visitors (users) have been flown from MS to FB? How to model this inter-connectivity?
4) Can this kind of model really lead to any ‘policy/strategy recommendations’? Should there be factors from the sites contents taken into account which affect the outcome, and on which changes could be suggested?
Thanks a lot in advance! Would really appreciate (even a short) answer (:
1) It’s no problem in general to have stocks with units of stuff/time. Typical examples would be machinery capacity that can make widgets/hour, or the perception of a flow in $/time. However, it might be a bit tricky here. Perhaps better to have an explicit stock of registered users, then multiply by visits per month per user to get total visits per month. That way you can explicitly distinguish changes to the user population from changes due to usage habits.
2) I think I would start with this model, then add an explicit second stock of myspace users. This could get a bit tricky. Presumably Facebook and MySpace draw on the same set of users, but they’re not exclusive, i.e. some users have accounts on both. But for simplicity, it might be easiest to pretend that they are exclusive, and get something working, then modify it gradually to capture stealing of customers from one network to another, multiple use, etc.
3) I think the thing you need for that is simply a flow of users from the ms stock to the fb stock (and possibly back). The question is, what determines the relative attractiveness of fb and ms to new and existing users? My guess is that there’s some kind of law, e.g. attractiveness of network = (# of users)^exponent, such that networks that are initially large tend to attract more users. The interesting question, though, is why myspace did not dominate, even though it was initially much larger.
4) I think there could be lots of interesting insights.
A good model to look at is:
https://metasd.com/behavioral-analysis-of-learning-curve-strategy/