
While the Case-Shiller index is down and the conventional wisdom suggests that housing prices will continue to fall, the RPX composite is up for the first time since 2007. The year-on-year ratio hit bottom in Feb 09. The RPX has a lot less lag than the CSI, but also a seasonal signal, so this could merely mean that seasonally adjusted prices are just falling more slowly, but it would be nice if it reflected green shoots. I’m not holding my breath though.
Author: Tom
The elusive MAC curve
Marginal Abatement Cost (MAC) curves are a handy way of describing the potential for and cost of reducing energy consumption or GHG emissions. McKinsey has recently made them famous, but they’ve been around, and been debated, for a long time.
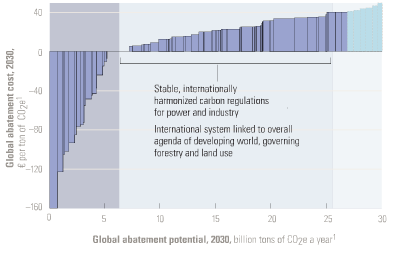
One version of the McKinsey MAC curve
Five criticisms are common:
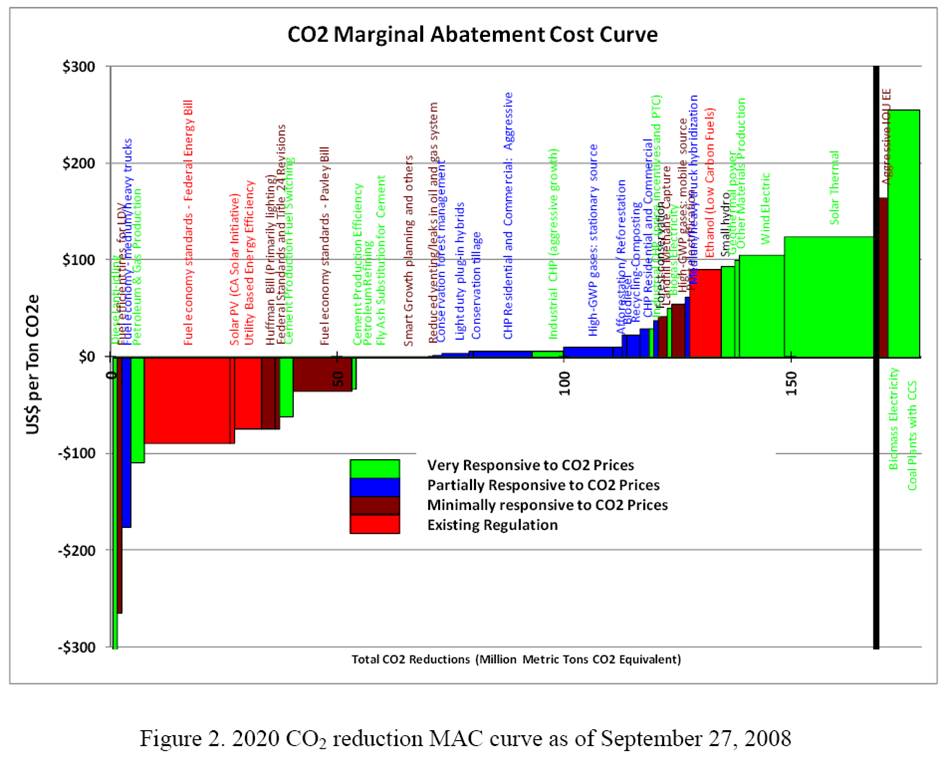
1. Negative cost abatement options don’t really exist, or will be undertaken anyway without policy support. This criticism generally arises from the question begged by the Sweeney et al. MAC curve below: if the leftmost bar (diesel anti-idling) has a large negative cost (i.e. profit opportunity) and is price sensitive, why hasn’t anyone done it? Where are those $20 bills on the sidewalk? There is some wisdom to this, but you have to drink pretty deeply of the neoclassical economic kool aid to believe that there really are no misperceptions, institutional barriers, or non-climate externalities that could create negative cost opportunities.
The neoclassical perspective is evident in AR4, which reports results primarily of top-down, equilibrium models. As a result, mitigation costs are (with one exception) positive:
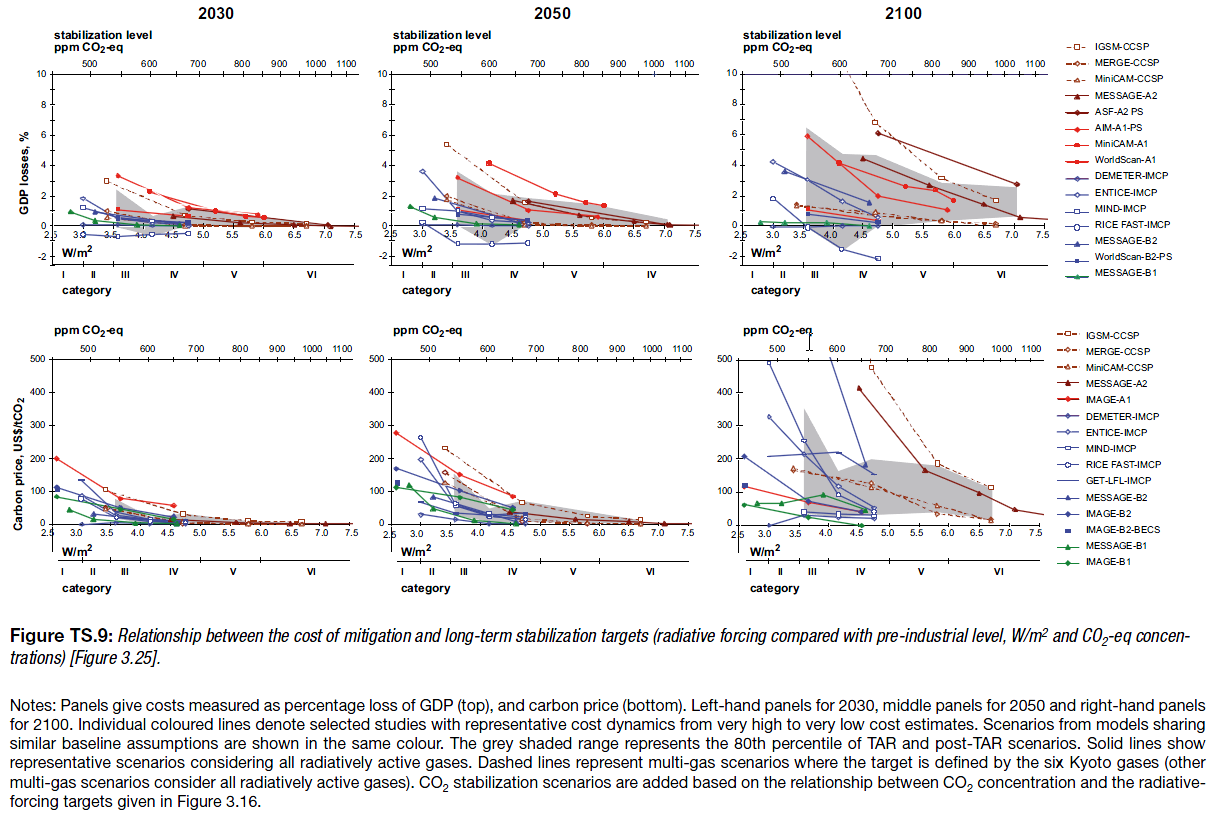
AR4 WG3 TS fig. TS-9
Note that these are top-down implicit MAC curves, derived by exercising aggregate models, rather than bottom-up curves constructed from detailed menus of technical options.
2. The curves employ static assumptions, that might not come true. For example, I’ve heard that the McKinsey curves assume $60/bbl oil. This criticism is true, but could be generalized to more or less any formal result that’s presented as a figure rather than an interactive model. I regard it as a caveat rather than a flaw.
3. The curves themselves are static, while reality evolves. I think the key issue here is that technology evolves endogenously, so that to some extent the shape of the curve in the future will depend on where we choose to operate on the curve today. There are also 2nd-order, market-mediated effects (related to #2 as well): a) exploiting the curve reduces energy demand, and thus prices, which changes the shape of the curve, and b) changes in GHG prices or other policies used to drive exploitation of the curve influence prices of capital and other factors, again changing the shape of the curve.
4. The notion of “supply” is misleading or incomplete. Options depicted on a MAC curve typically involve installing some kind of capital to reduce energy or GHG use. But that installation depends on capital turnover, and therefore is available only incrementally. The rate of exploitation is more difficult to pin down than the maximum potential under idealized conditions.
5. A lot of mitigation falls through the cracks. There are two prongs to this criticism: bottom-up, and top-down. Bottom-up models, because they employ a menu of known technologies, inevitably overlook some existing or potential options that might materialize in reality (with the incentive of GHG prices, for example). That error is, to some extent, offset by over-optimism about other technologies that won’t materialize. More importantly, a menu of supply and end use technology choices is an incomplete specification of the economy; there’s also a lot of potential for changes in lifestyle and substitution of activity among economic sectors. Today’s bottom-up MAC curve is essentially a snapshot of how to do what we do now, with fewer GHGs. If we’re serious about deep emissions cuts, the economy may not resemble what we’re doing now very much in 40 years. Top down models capture the substitution potential among sectors, but still take lifestyle as a given and (mostly) start from a first-best equilibrium world, devoid of mitigation options arising from the frailty of human, institutional, and market failures.
To get the greenhouse gas MAC curve right, you need a model that captures bottom-up and top-down aspects of the economy, with realistic dynamics and agent behavior, endogenous technology, and non-climate externalities all included. As I see it, mainstream integrated assessment models are headed down some of those paths (endogenous technology), but remain wedded to the equilibrium/optimization perspective. Others (including us at Ventana) are exploring other avenues, but it’s a hard road to hoe.
In the meantime, we’re stuck with a multitude of perspectives on mitigation costs. Here are a few from the WCI, compiled by Wei and Rose from partner jurisdictions’ Climate Action Team reports and other similar documents:
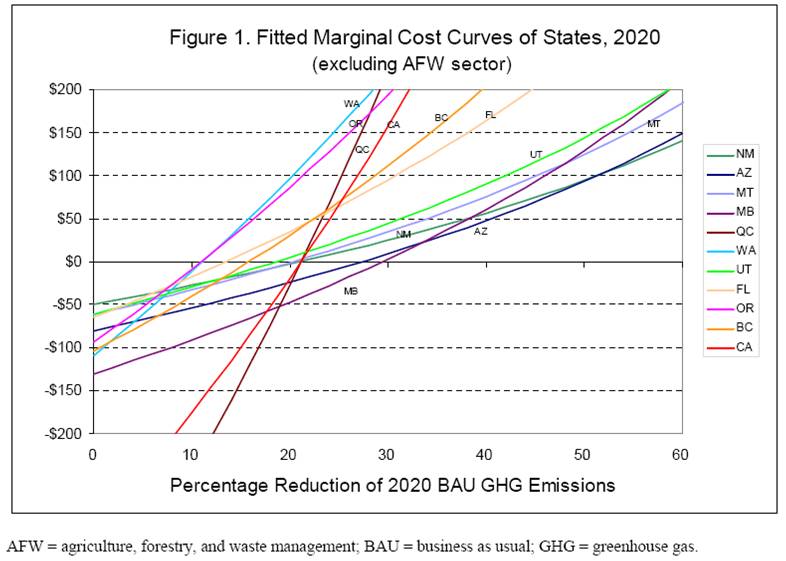
Wei & Rose, Preliminary Cap & Trade Simulation of Florida Joining WCI
The methods used to develop the various partner options differ, so these curves reflect diverse beliefs rather than a consistent comparison. What’s striking to me is that the biggest opportunities (are perceived to) exist in California, which already has (roughly) the lowest GHG intensity and most stringent energy policies among the partners. Economics 101 would suggest that California might already have exploited the low-hanging fruit, and that greater opportunity would exist, say, here in Montana, where energy policy means low taxes and GHG intensity is extremely high.
For now, we have to live with the uncertainty. However, it seems obvious that an adaptive strategy for discovering the true potential for mitigation is easy. No matter who you beleive, the cost of the initial increment of emissions reductions is either small (<<1% of GDP) or negative, so just put a price on GHGs and see what happens.
ABC to air Clout & Climate Change documentary
This just in from CNAS:
ABC News will air Earth 2100, the prime time documentary for which they filmed the war game, on June 2, 2009, at 9:00 p.m. (EST). You can view a promotional short report on the documentary from ABC News online, and hopefully you will all be able to view it on television or via Internet.
In conjunction with the airing of the documentary, CNAS has made the participant briefing book and materials from the game available online. We encourage other institutions to use and cite these materials to learn about the game and to stage their own scenario exercises. I also hope that they will be useful to you for your own future reference.
Finally, we are posting a short working paper of major findings from the game. While the game did not result in the kind of breakthrough agreements we all would have liked to see, this exercise achieved CNAS’s goals of exploring and highlighting the potential difficulties and opportunities of international cooperation on climate change. I know that everyone took away different observations from the game, however, and I hope that you will share your memories and your own key findings of the event with us, and allow us to post them online as a new section of the report.
Visit the Climate Change War Game webpage to view the CNAS report on major findings and background on developing the 2015 world, the participant briefing book, and materials generated from the game.
The only thing worse than cap & trade …
… is Marty Feldstein’s lame arguments against it.
- He cites CBO household costs of policy that reflect outlays, rather than real deadweight or welfare losses after revenue recycling.
- He wants the US to wait for global agreement before moving. News flash: there won’t be a global agreement without some US movement.
- He argues that unilateral action is ineffective: true, but irrelevant if you aim to solve the problem. However, if that’s our moral philosophy, I think I should be exempted from all laws – on a global scale, no one will notice my murdering and pillaging, and it’ll be fun for me.
There is one nugget of wisdom in Feldstein’s piece: it’s a travesty to overcompensate carbon-intensive firms, and foolish to use allowance allocation to utilities to defeat the retail price signal. I haven’t read the details of the bill yet, so I don’t know how extensive those provisions really are, but it’s definitely something to watch.
Well, OK, lots of things are worse than cap & trade. More importantly, one thing (an upstream carbon tax) could be a lot better than Waxman Markey. But it’s sad when a Harvard economist sounds like an astroturf skeptic.
Hat tip to Economist’s View.
Good modeling practices
Some thoughts I’ve been collecting, primarily oriented toward system dynamics modeling in Vensim, but relevant to any modeling endeavor:
- Know why you’re building the model.
- If you’re targeting a presentation or paper, write the skeleton first, so you know how the model will fill in the answers as you go.
- Organize your data first.
- No data? No problem. But surely you have some reference mode in mind, and some constraints on behavior, at least in extreme conditions.
- In Vensim, dump it all into a spreadsheet, database, or text file and import it into a data model, using the Model>Import data… feature, GET XLS DATA functions, or ODBC.
- Don’t put data in lookups (table functions) unless you must for some technical reason; they’re a hassle to edit and update, and lousy at distinguishing real data points from interpolation.
- Keep a lab notebook. An open word processor while you work is useful. Write down hypotheses before you run, so that you won’t rationalize surprises. Continue reading “Good modeling practices”
More CAFE, sir?
C-LEARN is live
Climate Interactive has the story.
Try it yourself, or see it in action in an interactive webinar on June 3rd.
Another Look at Limits to Growth
I was just trying to decide whether I believed what I said recently, that the current economic crisis is difficult to attribute to environmental unsustainability. While I was pondering, I ran across this article by Graham Turner on the LtG wiki entry, which formally compares the original Limits runs to history over the last 30+ years. A sample:
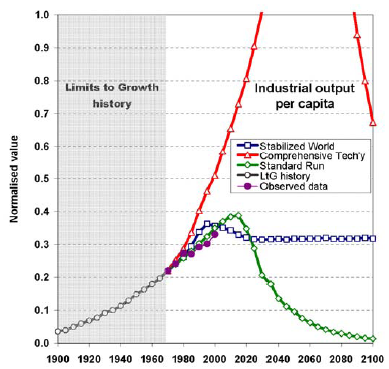
The report basically finds what I’ve argued before: that history does not discredit Limits.
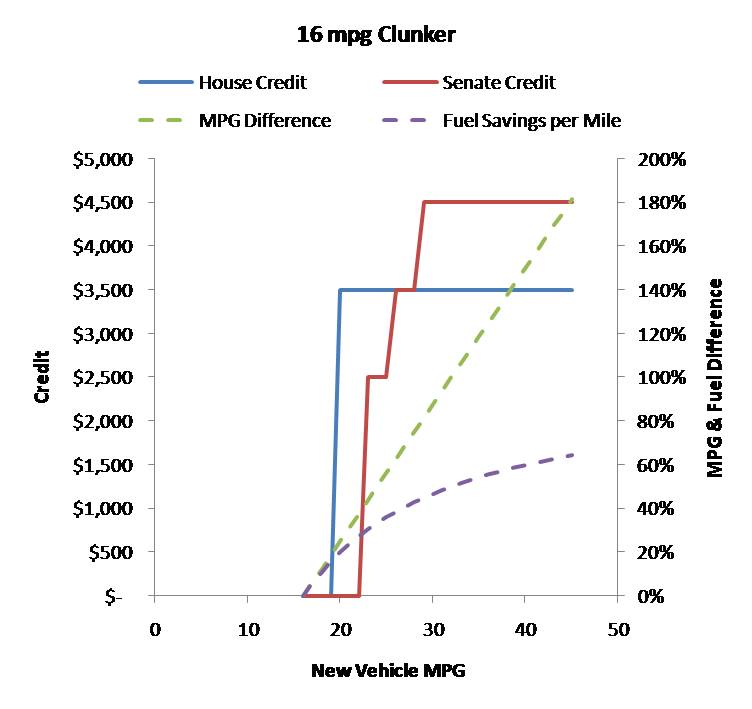
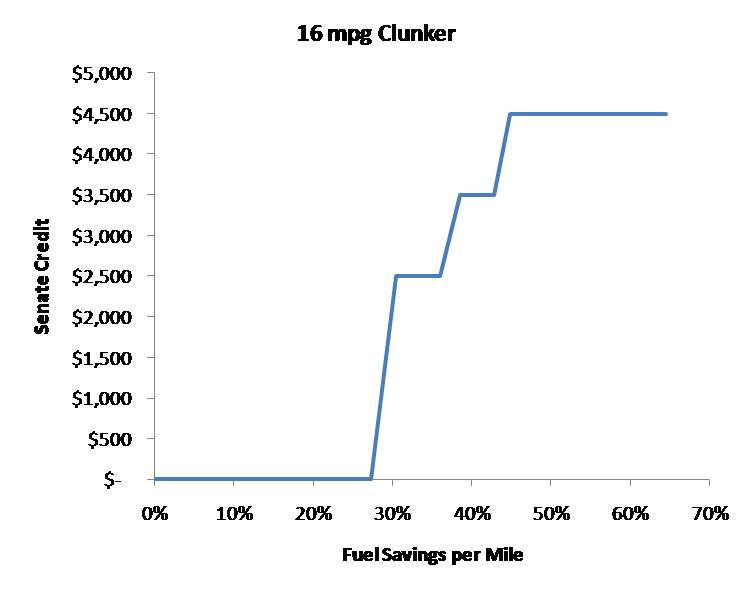
Cash for Clunkers Illusion
The proposed cash-for-clunkers program strikes me as yet another marginally effective policy that coulda been a contenda. In the aggregate, getting rid of clunkers doesn’t do much good, because fleet fuel economy has not improved in the last decade (at least current proposals don’t target age). Only transaction costs prevent wholesale shuffling of vehicles to yield advantageous trades that don’t improve total fleet efficiency. Clunkers that are cheap enough to scrap for a tax credit likely have low utilization; if they’re replaced by a new vehicle with high utilization, that doesn’t help. It might be a good stimulus for automakers, but you can’t get to a low-carbon future by subsidizing new carbon-consuming capital. The credits proposed in House and Senate versions appear to suffer from MPG illusion:
How many climate and energy policies that don’t work do we really need?
Drinking too much CAFE?
The NHTSA and EPA have announced upgraded vehicle efficiency and emissions standards. The CAFE standard will go up to 35.5 mpg by 2016, and a 250 gCO2/mile emissions limit will be phased in by the same time. My bottom line: I strongly favor efficient, low-emissions vehicles, but I think command and control legislation is a lousy way to get them. The approach works, but there’s a lot of collateral damage and inefficiency, and opponents of climate and energy policy are given lots to complain about. I’m happy about the new standard, but I look forward to the day when it’s not needed, because other signals are working properly.
First, as background, here’s the new CAFE standard in perspective:
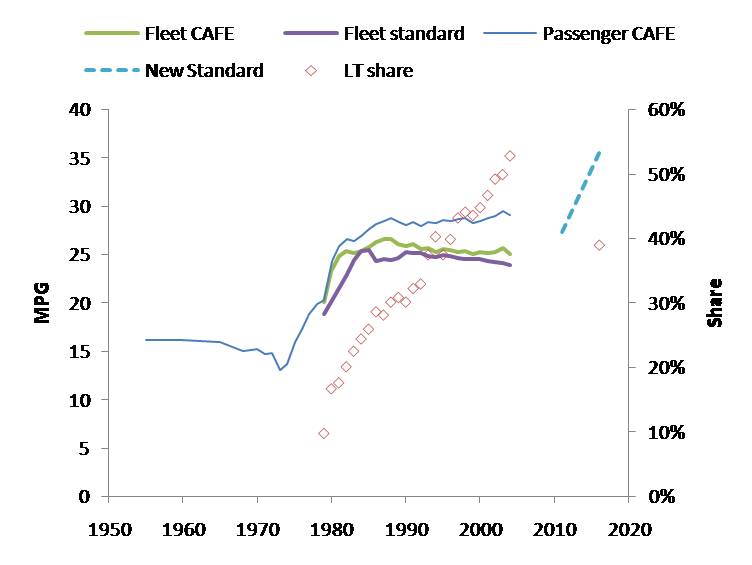
Source: NHTSA Update: I’ve corrected the data, which inadvertently showed light trucks rather than the total fleet. Notice two things: first, the total fleet corporate average fuel economy (CAFE) and standard has been declining, due to the penetration of light trucks (including SUVs). Second, if the 2016 standard of 35.5 mpg is to be met, given car and truck standards of 39 and 30 mpg, the share of light trucks will have to fall below 40%, though extrapolation of the historic trend would carry it nearer to 70%. It’s not clear how the allocation of footprint, credit trading and other features of CAFE will cause this to occur.
Like other portfolio standards, CAFE creates an internal tax and subsidy system within regulated entities. To meet its portfolio requirement, a manufacturer has to (internally) subsidize high-mpg vehicles and tax low-mpg vehicles. This hidden tax structure is problematic in several ways. There’s no guarantee that it yields an implicit price of carbon or energy that’s consistent across manufacturers, or consistent with fuel taxes and the price of emissions under a cap & trade system. Subsidizing the high-mpg vehicles is a bad idea: they’re more efficient, but they aren’t zero-emissions, and they still contribute to congestion and other side effects of driving – why would we want more of that? It’s even possible, if high-mpg drivers are price elastic (think kids) and low-mpg drivers are less so (think luxury SUV buyers, that the standard increases the total fleet and thus offsets some of its intended fuel savings.
The basic incentive problem with portfolio standards is compounded by the division of CAFE into domestic and imported, car and light truck stovepipes. Separate, non-fungible standards for cars and trucks create a bizarre allocation of property rights – in effect, light truck buyers are endowed with more property rights to consume or emit, irrespective of the fact that GHGs and other externalities do the same harm regardless of who’s responsible. Recently, a new footprint methodology effectively generalized the car/truck distinction to an allocation based on vehicle footprint. This makes about as much sense as subsidizing bullets for felons. It sounds like the stovepipe issue will be relaxed a bit with the new regulations, because credits will become tradable, but just wait until GM truck buyers figure out that they’re paying a tax that goes to subsidize Honda Fits. Still, there’s no clear reason why the ratio of car:truck standards should be 39:30, or why the car standard should go up 30% while the truck standard goes up 15%.
Applying the standard to vehicles at the point of purchase, rather than as they are used (through fuel taxes or VMT tolls) fails to recognize that most of the negative side effects of a vehicle arise from its use, not from its existence. With fuel, emissions, and congestion charges, people could be free to make their own tradeoffs among efficiency, vehicle utilization, and capabilities like cargo capacity. Standards basically ignore diversity in usage patterns, and shoehorn everyone into the same mold. Remember that, while a driver-only Chevy Suburban is ridiculous, a full one moves people almost as efficiently as a full Prius, and 3x more efficiently than a driver-only Prius.
Once efficient vehicles are on the road, the rebound effect crops up. CAFE lowers the cost of driving, so in the absence of a fuel or emissions price signal, people will drive, consume, and emit more. Over the past three decades, miles traveled per vehicle and the total fleet size have dramatically increased. As a result, fuel consumption per vehicle has been essentially constant, in spite of efficiency improvements, and total fuel consumption is up. The increase in driving is likely due mostly to cheap fuel, sprawl, and increasing population and wealth, but efficiency mandates have probably contributed as well.
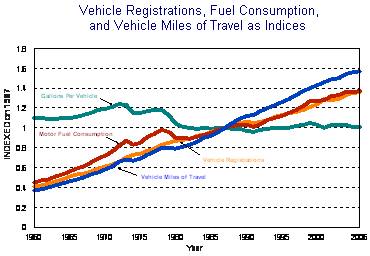
Source: DOT FHWA
In addition to incentive problems, there are lots of implementation issues in CAFE. Over the years, there’s been a lot of tinkering with the standard (like the footprint methodology) designed to restore flexibility you’d have automatically with a market-based mechanism or to achieve other policy goals. As a result, the rules have become rather opaque. CAFE measurements use EPA’s old fuel economy measurement methods, which were abandoned for window stickers a few years ago because they didn’t match reality. There are various loopholes, including one that permits vehicles to claim 4x mpg if they can consume alternate fuels, even if those fuels are not widely distributed (E85).
The critics of CAFE mostly don’t focus on the incentive and transparency problems above. Instead, they hammer on two ideas: that CAFE costs jobs, and forces us all to die in tiny boxes. Those make good sound bites, but neither argument is particularly strong. Seeking Alpha has a nice look at the economics. The safety issue is harder to wrap your arms around. Basically, the critics argue that, in a collision, weight is good. From the perspective of a single driver, that’s largely true, because the distribution of changes in momentum in a collision is strongly proportional to the relative mass of the objects involved. However, that’s an arms race, with no aggregate benefit: when everyone else drives a 4952 lb Dodge Ram 1500, you need a 6342 lb Ram 3500 to stay ahead. With safety as the only consideration, soon we’d all be driving locomotives and M1 tanks. The real social benefit of weight is that it’s correlated with size, which (all else equal) lowers the acceleration passengers face in a collision, but the size-weight correlation is intermediated by technology, which governs the strength of a passenger compartment and the aggressiveness of a vehicle chassis against other vehicles.
In that respect, CAFE’s car-light truck distinction and footprint methodology probably has been damaging, because it has encouraged the spread of heavy SUVs on ladder frames, as can be seen in the first figure. Those vehicles impose disproportionate risk on others:
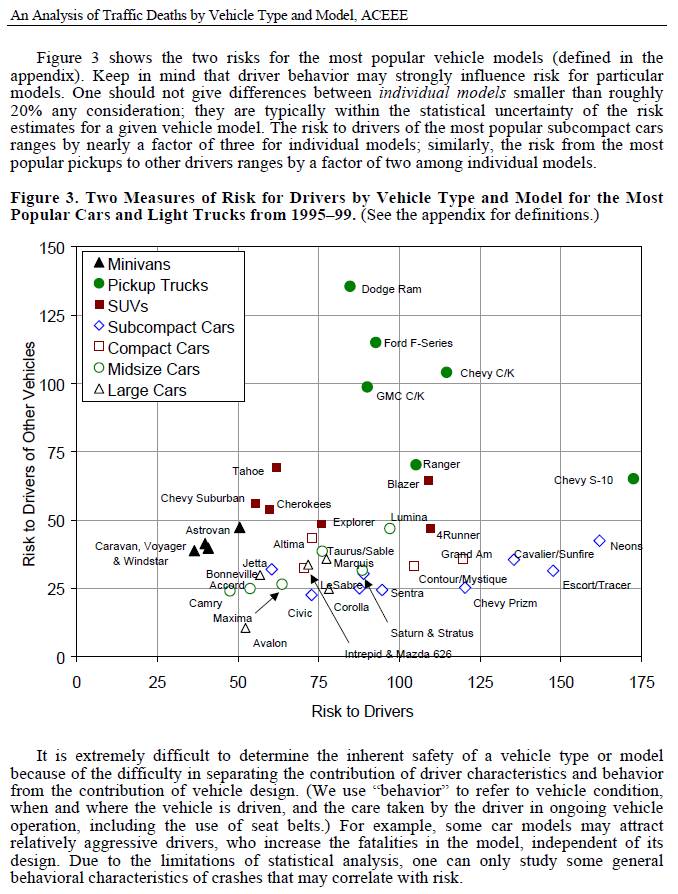
Source: Marc Ross UMich, Tom Wenzel LBNL, An Analysis of Traffic Deaths by Vehicle Type and Model, ACEE Report #T012, March 2002.
There are many ways to achieve safety without simply adding mass: good design, better materials, restraints, lower speeds, and less beer on Saturday night all help. If we had a vehicle energy and emissions policy that permitted broader tradeoffs, I’m sure we could arrive at a more efficient system with better aggregate safety than we have now.
In spite of its many problems, I’ll take CAFE – it’s better than nothing, and there’s certainly no technical obstacle to meeting the new standards (be prepared for lots of whining though). Alternatives will take a while to construct, so by wingwalker’s rule we should hang onto what we have for the moment. But rather than pushing the standards approach to its inevitable breakdown point, I think we should be pursuing other options: get a price on carbon, and any other externalities we care about (congestion tolls and pay-at-the-pump insurance are good examples). Then work on zoning, infrastructure, and other barriers to efficiency, mode shifting, and VMT reduction. With the fundamental price signals aligned with the goals, it should be easier to push things in the right direction.