Why the World Loves Open Loop Models

Propaganda, for one thing.

A while back I made a video about spreadsheets, that makes some points about open-loop models vs. real, closed-loop dynamic models:

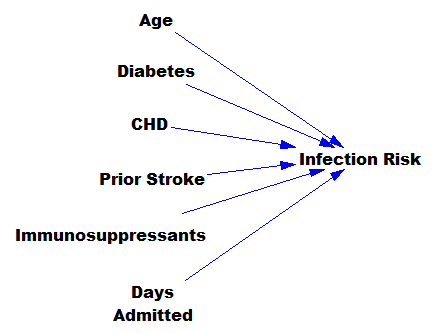
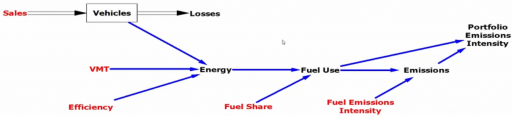
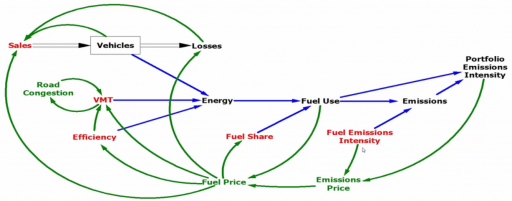
The short version is that people tend to build this:

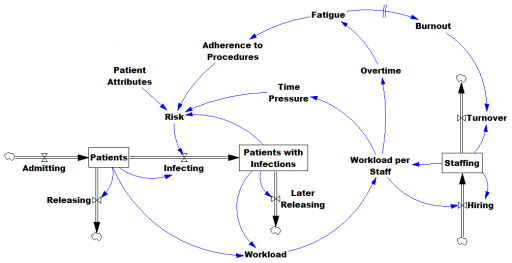
when reality works like this:

I think there are some understandable reasons to prefer the first, simpler view:

  • Just understanding the dynamics of accumulation (here, the vehicle stock) may be mind-blowing enough without adding feedback complexity.
  • It’s a start, and certainly better than no model or extrapolation!

Some of the reasons these models get built are a little less appetizing:

  • In the short run, some loops really aren’t closed (though the short run is rarely as short as you think, and myopia gets you in trouble).
  • They’re quicker and cheaper to build (if you don’t mind less insight).
  • Dynamic modeling skills, both for construction and consumption, are not very widespread.
  • Open-loop models are easier to calibrate (but a calibration neglecting accumulation and feedback is likely bogus and misleading).
  • Open-loop models are easier to manipulate to produce a desired outcome.

I think the last point is key. At Ventana, we’ve discussed – only partly in jest – creating a “propaganda mode” for Vensim and Ventity. This would automate the discovery of a parameterization of a model that both fits history and makes a preferred policy optimal.

Perhaps the ultimate example of this is the RMSM model. 20 years ago, this was the World Bank’s preferred tool for country modeling. When Gerald Barney and Weishuang Qu replicated the model in Vensim, they discovered that is was full of disconnected trees of causality. That would permit creation of a scenario in which GDP growth marched along merrily without any water, for example. Politically, this was actually a feature, not a bug, because some users simply didn’t want to know that their pet project would displace a lot of people or destroy resources.

I think the solution here is to equip people to ask the right questions that close loops. Once there’s an appetite for dynamic, operational thinking, we can supply good modelers to provide the tools.

Prediction, in context

I’m increasingly running into machine learning approaches to prediction in health care. A common application is identification of risks for (expensive) infections or readmission. The basic idea is to treat patients like a function approximation problem.

The hospital compiles a big dataset on patient demographics, health status, exposure to procedures, and infection outcomes. A vendor slurps this up and turns some algorithm loose on the data, seeking the risk factors associated with the infection. It might look like this:

… except that there might be 200 predictors, not six – more than you can handle by eyeballing scatter plots or control charts. Once you have a risk model, you know which patients to target for mitigation, and maybe also which associated factors to pursue further.

However, this is only half the battle. Systems thinkers will recognize this model as a dead buffalo: a laundry list with unidirectional causality. The real situation is rich in feedback, including a lot of things that probably don’t get measured, and therefore don’t end up in the data for consideration by the algorithm. For example:

Infections aren’t just a random event for the patient; they happen for reasons that are larger than the patient. Even worse, there are positive feedbacks that can make prevention of infections, and errors more generally, hard to manage. For example, as the number of patients with infections rises, workload goes up, which creates time pressure and fatigue. That induces shortcuts and errors that create risk for patients, leading to more infections. Infections spread to other patients. Fatigued staff burn out and turn over faster, which dilutes the staff experience that might otherwise mitigate risk. (Experience, like many other dynamics, is not shown above.)

An algorithm that predicts risk in this context is certainly useful, because anything that reduces risk helps to diminish the gain of the vicious cycles. But it’s no longer so clear what to do with the patient assessments. Time spent on staff education and action for risk mitigation has to come from somewhere, and therefore might have unintended consequences that aren’t assessed by the algorithm. The algorithm is actually blind in two ways: it can’t respond to any input (like staff fatigue or skill) that isn’t in the data, and it probably  isn’t statistically smart enough to deal with the separation of cause and effect in time and space that arises in a feedback system.

Deep learning systems like Alpha Go Zero might learn to deal with dynamics. But so far, high performance requires very large numbers of exemplars for reinforcement learning, and that’s never going to happen in a community hospital dataset. Then again, we humans aren’t too good at managing dynamic complexity either. But until the machines take over, we can build dynamic models to sort these problems out. By taking an endogenous point of view, we can put machine learning in context, refine our understanding of leverage points, and redesign systems for greater performance.

Dead buffalo diagrams

I think it was George Richardson who coined the term “dead buffalo” to refer to a diagram that surrounds a central concept with a hail of inbound causal arrows explaining it. This arrangement can be pretty useful as a list of things to think about, but it’s not much help toward solving a systemic problem from an endogenous point of view.

I recently found the granddaddy of them all:

dead_buffalo