Exhibit A – the Social Cost of Carbon

I recently discovered a cool set of tools from MIT’s Simile project. My favorites are Timeline and Exhibit, which provide a fairly easy way to create web sites where visitors can interact with data. As a test, I built an Exhibit containing Richard Tol’s survey of assessments of the social cost of carbon (SCC):

Social Cost of Carbon Exhibit

Continue reading “Exhibit A – the Social Cost of Carbon”

Plus ça change, plus c’est la même chose

Last Wednesday, President Bush called for the US to halt the growth of greenhouse gas emissions by 2025:

‘It is now time for the U.S. to look beyond 2012 and take the next step,’ Mr. Bush said, a reference to his previously stated national goal, announced in 2002, of an 18 percent reduction in the growth of emissions of heat-trapping gases relative to economic growth by 2012. Mr. Bush said the nation was on track to meeting that target. – NYT

Those who remember the 2002 commitment may recall that, at the time, emissions intensity had historically fallen by 1.3% per year on its own, so that the administration policy actually committed only to an additional 0.4% decline (assuming continuity with history). With GDP growth at about 3% per year, that would leave absolute emissions growing at about 1.7% per year. In fact, intensity has fallen about 2.5% per year since 2002, with much of that in 2006. Since it’s way too soon for investments in climate-related R&D to be having any effect, it’s likely that the savings are due to $100 oil. That is not an emissions reduction method that is likely to pass a cost-benefit test.

CO2 intensity data

EIA data

In the context of the long term,-2.5% over 4 years is still hard to separate from noise. Continue reading “Plus ça change, plus c’est la même chose”

Trade Emissions & Cosmic Rays

Two interesting abstracts I ran across today:

Testing the proposed causal link between cosmic rays and cloud cover

A decrease in the globally averaged low level cloud cover, deduced from the ISCCP infrared data, as the cosmic ray intensity decreased during the solar cycle 22 was observed by two groups. The groups went on to hypothesize that the decrease in ionization due to cosmic rays causes the decrease in cloud cover, thereby explaining a large part of the currently observed global warming. We have examined this hypothesis to look for evidence to corroborate it. None has been found and so our conclusions are to doubt it. From the absence of corroborative evidence, we estimate that less than 23%, at the 95% confidence level, of the 11 year cycle change in the globally averaged cloud cover observed in solar cycle 22 is due to the change in the rate of ionization from the solar modulation of cosmic rays.

Trading Kyoto

Almost one-quarter of carbon dioxide released to the atmosphere is emitted in the production of internationally traded goods and services. Trade therefore represents an unrivalled, and unused, tool for reducing greenhouse gas emissions.

Dangerous Assumptions

Roger Pielke Jr., Tom Wigley, and Christopher Green have a nice commentary in this week’s Nature. It argues that current scenarios are dangerously reliant on business-as-usual technical improvement to reduce greenhouse gas intensity:

Here we show that two-thirds or more of all the energy efficiency improvements and decarbonization of energy supply required to stabilize greenhouse gases is already built into the IPCC reference scenarios. This is because the scenarios assume a certain amount of spontaneous technological change and related decarbonization. Thus, the IPCC implicitly assumes that the bulk of the challenge of reducing future emissions will occur in the absence of climate policies. We believe that these assumptions are optimistic at best and unachievable at worst, potentially seriously underestimating the scale of the technological challenge associated with stabilizing greenhouse-gas concentrations.

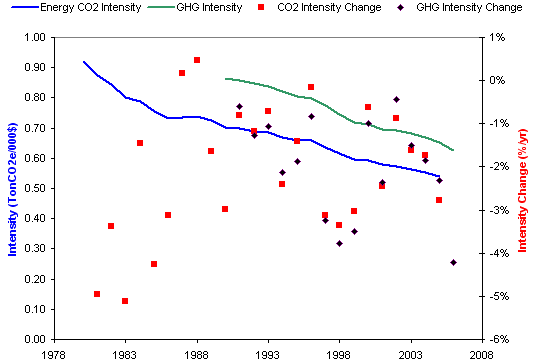
They note that assumed rates of decarbonization exceed reality:

The IPCC scenarios include a wide range of possibilities for the future evolution of energy and carbon intensities. Many of the scenarios are arguably unrealistic and some are likely to be unachievable. For instance, the IPCC assumptions for decarbonization in the short term (2000’“2010) are already inconsistent with the recent evolution of the global economy (Fig. 2). All scenarios predict decreases in energy intensity, and in most cases carbon intensity, during 2000 to 2010. But in recent years, both global energy intensity and carbon intensity have risen, reversing the trend of previous decades.

In an accompanying news article, several commenters object to the notion of a trend reversal:

Energy efficiency has in the past improved without climate policy, and the same is very likely to happen in the future. Including unprompted technological change in the baseline is thus logical. It is not very helpful to discredit emission scenarios on the sole basis of their being at odds with the most recent economic trends in China. Chinese statistics are not always reliable. Moreover, the period in question is too short to signify a global trend-break. (Detlef van Vuuren)

Having seen several trend breaks evaporate, including the dot.com productivity miracle and the Chinese emissions reductions coincident with the Asian crisis, I’m inclined to agree that gloom may be premature. On the other hand, Pielke, Wigley and Green are conservative in that they don’t consider the possible pressure for recarbonization created by a transition from conventional oil and gas to coal and tar sands. A look at the long term is helpful:

18 country emissions intensity

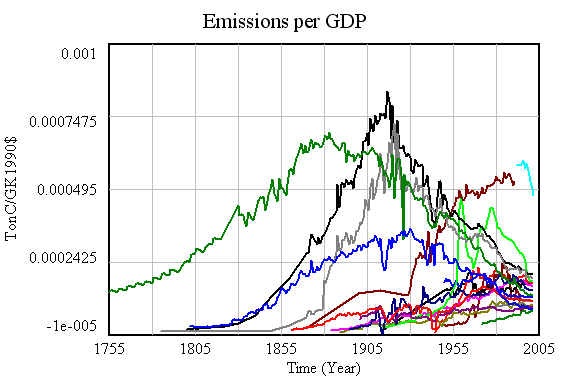
Emissions intensity of GDP for 18 major emitters. Notice the convergence in intensity, with high-intensity nations falling, and low-intensity nations (generally less-developed) rising.

Emissions intensity trend for 18 major emitters

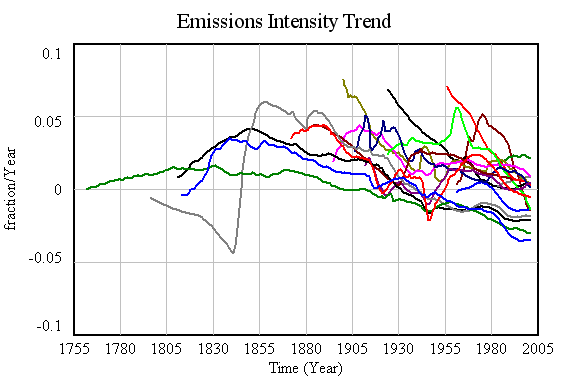
Corresponding decadal trends in emissions intensity. Over the long haul, there’s some indication that emissions are falling faster in developed nations – a reason for hope. But there’s also a lot of diversity, and many nations have positive trends in intensity. More importantly, even with major wars and depressions, no major emitter has achieved the kind of intensity trend (about -7%/yr) needed to achieve 80% emissions reductions by 2050 while sustaining 3%/yr GDP growth. That suggests that achieving aggressive goals may require more than technology, including – gasp – lifestyle changes.

6 country emissions intensity

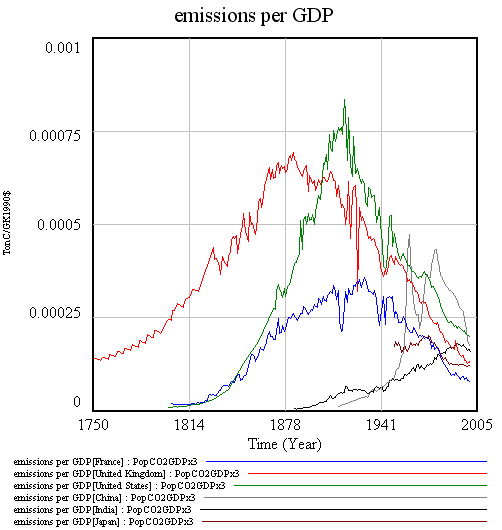
A closer look at intensity for 6 major emitters. Notice intensity rising in China and India until recently, and that Chinese data is indeed suspect.

Pielke, Wigley, and Green wrap up:

There is no question about whether technological innovation is necessary ’” it is. The question is, to what degree should policy focus directly on motivating such innovation? The IPCC plays a risky game in assuming that spontaneous advances in technological innovation will carry most of the burden of achieving future emissions reductions, rather than focusing on creating the conditions for such innovations to occur.

There’s a second risky game afoot, which is assuming that “creating the conditions for such innovations to occur” means investing in R&D, exclusive of other measures. To achieve material reductions in emissions, “occur” must mean “be adopted” not just “be invented.” Absent market signals and institutional changes, it is unlikely that technologies like carbon sequestration will ever be adopted. Others, like vehicle and lighting efficiency, could easily see their gains eroded by increased consumption of energy services, which become cheaper as technology improves productivity.

Space Tourism & Climate

The Saturn V used for the Apollo missions burned 203,000 gallons of RP-1 (basically kerosene) in its first stage. At 820 kg/m^3, that’s 630 metric tons of fuel. Liquid hydrocarbons tend to be close to CxH2x, or about 85% carbon by mass, so that’s 536 metric tons of carbon, which yields 1965 tons CO2 when burned, or 655 TonCO2/astronaut. Obviously that’s not personal consumption, but it is a lot of carbon in the atmosphere.

The emerging space tourism industry, on the other hand, is primarily personal consumption. I’d love to take the trip, but I’d be a little put off if the consequences of seeing the big blue marble from above were to make a major contribution to climate change. So, what are the consequences?

Big Blue Marble from TerraMODIS, NASA

TerraMODIS, NASA Continue reading “Space Tourism & Climate”

Unintended Consequences

Olive Heffernan has an interesting tidbit on Climate Feedback about unintended consequences of climate policy.

It’s worth noting that most of these side-effects are not consequences of climate policy per se. They are consequences of pursuing climate policy piecemeal, from the bottom up, and seeking technological fixes in the absence of market signals. If climate policy were pursued as part of a general agenda of internalizing environmental and social externalities through market signals, some of these perverse behaviors would not occur.

The side effects of the corn ethanol boom should not be laid at the door of climate policy. Apart from hopes for cellulosic, ethanol has little to offer with respect to greenhouse gas emissions, and perhaps much to answer for. Its real motivations are oil independence and largesse to the ag sector.

Surveys and Quizzes as Propaganda

Long ago I took an IATA survey to relieve the boredom of a long layover. Ever since, I’ve been on their mailing list, and received “invitations” to take additional surveys. Sometimes I do, out of curiosity – it’s fun to try to infer what they’re really after. The latest is a “Global Survey on Aviation and Environment” so I couldn’t resist. After a few introductory questions, we get to the meat:

History/Fact
1. Air transport contributes 8% to the global economy and supports employment for 32 million people. But, aviation is responsible for only 2% of global CO2 emissions.

Wow … an energy intensive sector that somehow manages to be less carbon intensive than the economy in general? Sounds too good to be true. Unfortunately, it is. The illusion of massive scale of the air transport sector is achieved by including indirect activity, i.e. taking credit for what other sectors produce when it might involve air transport. Federal cost-benefit accounting practices generally banish the use of such multiplier effects, with good reason. According to an ATAG report hosted by IATA, the indirect effects make up the bulk of activity claimed above. ATAG peels the onion for us:

Air transport direct and indirect GDP contributions

So, direct air transport is closer to 1% of GDP. Comparing direct GDP of 1% to direct emissions of 2% no longer looks favorable, though – especially when you consider that air transport has other warming effects (contrails, non-CO2 GHG emissions) that might double or triple its climate impact. The IPCC Aviation and the Global Atmosphere report, for example, places aviation at about 2% of fossil fuel use, and about 4% of total radiative forcing. If IATA wants to count indirect GDP and employment, fine with me, but then they need to count indirect emissions on the same basis. Continue reading “Surveys and Quizzes as Propaganda”