Regional Climate Initiatives – Model Roll Call – Part II

Minnesota

The Minnesota Next Generation Energy Act establishes a goal of reducing GHG emissions by 15% by 2015, 30% by 2025, and 80% by 2050, relative to 2005 levels.

From ScienceDaily comes news of a new research report from University of Minnesota’s Center fro Transportation Studies. The study looks at options for reducing transport emissions. Interestingly, transport represents 24% of MN emissions, vs. more than 40% in CA. The study decomposes emissions according to a variant of the IPAT identity,

Emissions = (Fuel/VehicleMile) x (Carbon/Fuel) x (VehicleMilesTraveled)

Vehicle and fuel effects are then modeled with LEAP, an energy modeling platform with a fast-growing following. The VMT portion is tackled with a spreadsheet calculator from CCAP’s Guidebook. I haven’t had much time to examine the latter, but it considers a rich set of options and looks like at least a useful repository of data. However, it’s a static framework, and land use-transportation interactions are highly dynamic. I’d expect it to be a useful way to construct alternative transport system visions, but not much help determining how to get there from here.

Minnesota’s Climate Change Advisory Group TWG on land use and transportation has a draft inventory and forecast of emissions. The Energy Supply and Residential/Commercial/Industrial TWGs developed spreadsheet analyses of a number of options. Analysis and Assumptions memos describe the results, but the spreadsheets are not online.

British Columbia

OK, it’s not a US region, but maybe we could trade it for North Dakota. BC has a revenue-neutral carbon tax, supplemented by a number of other initiatives. The tax starts at $10/TonCO2 and rises $5/year to $30 by 2012. The tax is offset by low-income tax credits and 2 to 5% reductions in lower income tax brackets; business tax reductions match personal tax reductions in roughly a 1:2 ratio.

BC’s Climate Action Plan includes a quantitative analysis of proposed policies, based on the CIMS model. CIMS is a detailed energy model coupled to a macroeconomic module that generates energy service demands. CIMS sounds a lot like DOE’s NEMS, which means that it could be useful for determining near-term effects of policies with some detail. However, it’s probably way too big to modify quickly to try out-of-the-box ideas, estimate parameters by calibration against history, or perform Monte Carlo simulations to appreciate the uncertainty around an answer.

The BC tax demonstrates a huge advantage of a carbon tax over cap & trade: it can be implemented quickly. The tax was introduced in the Feb. 19 budget, and switched on July 1st. By contrast, the WCI and California cap & trade systems have been underway much longer, and still are no where near going live. The EU ETS was authorized in 2003, turned on in 2005, and still isn’t dialed in (plus it has narrower sector coverage). Why so fast? It’s simple – there’s no trading infrastructure to design, no price uncertainty to worry about, and no wrangling over allowance allocations (though the flip side of the last point is that there’s also no transient compensation for carbon-intensive industries).

Bizarrely, BC wants to mess everything up by layering cap & trade on top of the carbon tax, coordinated with the WCI (in which BC is a partner).

Tangible Models

MIT researchers have developed a cool digital drawing board that simulates the physics of simple systems:

You can play with something like this with Crayon Physics or Magic Pen. Digital physics works because the laws involved are fairly simple, though the math behind one of these simulations might appear daunting. More importantly, they are well understood and universally agreed upon (except perhaps among perpetual motion advocates).

I’d like to have the equivalent of the digital drawing board for the public policy and business strategy space: a fluid, intuitive tool that translates assumptions into realistic consequences. The challenge is that there is no general agreement on the rules by which organizations and societies work. Frequently there is not even a clear problem statement and common definition of important variables.

However, in most domains, it is possible to identify and simulate the “physics” of a social system in a useful way. The task is particularly straightforward in cases where the social system is managing an underlying physical system that obeys predictable laws (e.g., if there’s no soup on the shelf, you can’t sell any soup). Jim Hines and MIT Media Lab researchers translated that opportunity into a digital whiteboard for supply chains, using a TUI (tangible user interface). Here’s a demonstration:

There are actually two innovations here. First, the structure of a supply chain has been reduced to a set of abstractions (inventories, connections via shipment and order flows, etc.) that make it possible to assemble one tinker-toy style using simple objects on the board. These abstractions eliminate some of the grunt work of specifying the structure of a system, enabling what Jim calls “modeling at conversation speed”. Second, assumptions, like the target stock or inventory coverage at a node in the supply chain, are tied to controls (wheels) that allow the user to vary them and see the consequences in real time (as with Vensim’s Synthesim). Getting the simulation off a single computer screen and into a tangible work environment opens up great opportunities for collaborative exploration and design of systems. Cool.

Next step: create tangible, shareable, fast tools for uncertain dynamic tasks like managing the social security trust fund or climate policy.

US Regional Climate Initiatives – Model Roll Call

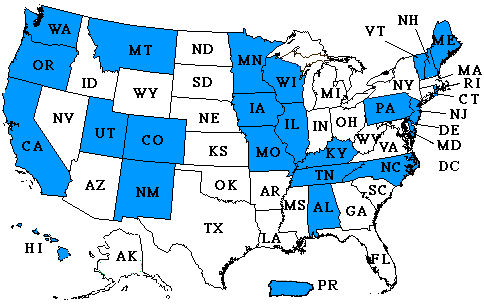
The Pew Climate Center has a roster of international, US federal, and US state & regional climate initiatives. Wikipedia has a list of climate initiatives. The EPA maintains a database of state and regional initiatives, which they’ve summarized on cool maps. The Center for Climate Strategies also has a map of links. All of these give some idea as to what regions are doing, but not always why. I’m more interested in the why, so this post takes a look at the models used in the analyses that back up various proposals.

EPA State Climate Initiatives Map

In a perfect world, the why would start with analysis targeted at identifying options and tradeoffs for society. That analysis would inevitably involve models, due to the complexity of the problem. Then it would fall to politics to determine the what, by choosing among conflicting stakeholder values and benefits, subject to constraints identified by analysis. In practice, the process seems to run backwards: some idea about what to do bubbles up in the political sphere, which then mandates that various agencies implement something, subject to constraints from enabling legislation and other legacies that do not necessarily facilitate the best outcome. As a result, analysis and modeling jumps right to a detailed design phase, without pausing to consider the big picture from the top down. This tendency is somewhat reinforced by the fact that most models available to support analysis are fairly detailed and tactical; that makes them too narrow or too cumbersome to redirect at the broadest questions facing society. There isn’t necessarily anything wrong with the models; they just aren’t suited to the task at hand.

My fear is that the analysis of GHG initiatives will ultimately prove overconstrained and underpowered, and that as a result implementation will ultimately crumble when called upon to make real changes (like California’s ambitious executive order targeting 2050 emissions 80% below 1990 levels). California’s electric power market restructuring debacle jumps to mind. I think underpowered analysis is partly a function of history. Other programs, like emissions markets for SOx, energy efficiency programs, and local regulation of criteria air pollutants have all worked OK in the past. However, these activities have all been marginal, in the sense that they affect only a small fraction of energy costs and a tinier fraction of GDP. Thus they had limited potential to create noticeable unwanted side effects that might lead to damaging economic ripple effects or the undoing of the policy. Given that, it was feasible to proceed by cautious experimentation. Greenhouse gas regulation, if it is to meet ambitious goals, will not be marginal; it will be pervasive and obvious. Analysis budgets of a few million dollars (much less in most regions) seem out of proportion with the multibillion $/year scale of the problem.

One result of the omission of a true top-down design process is that there has been no serious comparison of proposed emissions trading schemes with carbon taxes, though there are many strong substantive arguments in favor of the latter. In California, for example, the CPUC Interim Opinion on Greenhouse Gas Regulatory Strategies states, “We did not seriously consider the carbon tax option in the course of this proceeding, due to the fact that, if such a policy were implemented, it would most likely be imposed on the economy as a whole by ARB.” It’s hard for CARB to consider a tax, because legislation does not authorize it. It’s hard for legislators to enable a tax, because a supermajority is required and it’s generally considered poor form to say the word “tax” out loud. Thus, for better or for worse, a major option is foreclosed at the outset.

With that little rant aside, here’s a survey of some of the modeling activity I’m familiar with:

Continue reading “US Regional Climate Initiatives – Model Roll Call”

SRES – We've got a bigger problem now

Recently Pielke, Wigley and Green discussed the implications of autonomous energy efficiency improvements (AEEI) in IPCC scenarios, provoking many replies. Some found the hubbub around the issue surprising, because the assumptions concerned were well known, at least to modelers. I was among the surprised, but sometimes the obvious needs to be restated loud and clear. I believe that there are several bigger elephants in the room that deserve such treatment. AEEI is important, as are other hotly debated SRES choices like PPP vs. MEX, but at the end of the day, these are just parameter choices. In complex systems parameter uncertainty generally plays second fiddle to structural uncertainty. Integrated assessment models (IAMs) as a group frequently employ similar methods, e.g., dynamic general equilibrium, and leave crucial structural assumptions untested. I find it strange that the hottest debates surround biogeophysical models, which are actually much better grounded in physical principles, when socio-economic modeling is so uncertain.

Continue reading “SRES – We've got a bigger problem now”

Dangerous Assumptions

Roger Pielke Jr., Tom Wigley, and Christopher Green have a nice commentary in this week’s Nature. It argues that current scenarios are dangerously reliant on business-as-usual technical improvement to reduce greenhouse gas intensity:

Here we show that two-thirds or more of all the energy efficiency improvements and decarbonization of energy supply required to stabilize greenhouse gases is already built into the IPCC reference scenarios. This is because the scenarios assume a certain amount of spontaneous technological change and related decarbonization. Thus, the IPCC implicitly assumes that the bulk of the challenge of reducing future emissions will occur in the absence of climate policies. We believe that these assumptions are optimistic at best and unachievable at worst, potentially seriously underestimating the scale of the technological challenge associated with stabilizing greenhouse-gas concentrations.

They note that assumed rates of decarbonization exceed reality:

The IPCC scenarios include a wide range of possibilities for the future evolution of energy and carbon intensities. Many of the scenarios are arguably unrealistic and some are likely to be unachievable. For instance, the IPCC assumptions for decarbonization in the short term (2000’“2010) are already inconsistent with the recent evolution of the global economy (Fig. 2). All scenarios predict decreases in energy intensity, and in most cases carbon intensity, during 2000 to 2010. But in recent years, both global energy intensity and carbon intensity have risen, reversing the trend of previous decades.

In an accompanying news article, several commenters object to the notion of a trend reversal:

Energy efficiency has in the past improved without climate policy, and the same is very likely to happen in the future. Including unprompted technological change in the baseline is thus logical. It is not very helpful to discredit emission scenarios on the sole basis of their being at odds with the most recent economic trends in China. Chinese statistics are not always reliable. Moreover, the period in question is too short to signify a global trend-break. (Detlef van Vuuren)

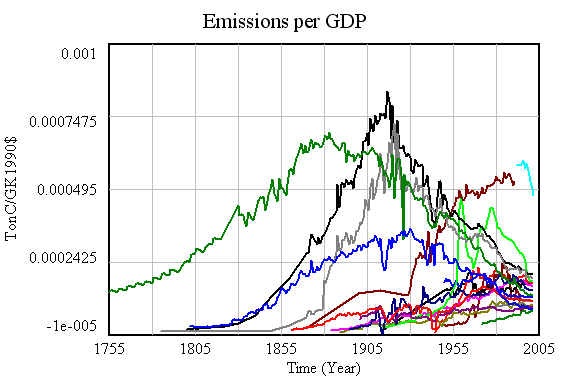
Having seen several trend breaks evaporate, including the dot.com productivity miracle and the Chinese emissions reductions coincident with the Asian crisis, I’m inclined to agree that gloom may be premature. On the other hand, Pielke, Wigley and Green are conservative in that they don’t consider the possible pressure for recarbonization created by a transition from conventional oil and gas to coal and tar sands. A look at the long term is helpful:

18 country emissions intensity

Emissions intensity of GDP for 18 major emitters. Notice the convergence in intensity, with high-intensity nations falling, and low-intensity nations (generally less-developed) rising.

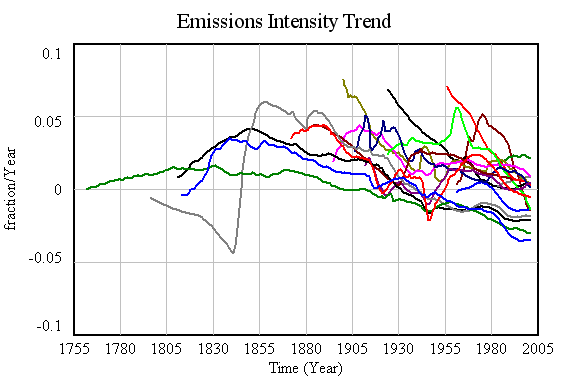
Emissions intensity trend for 18 major emitters

Corresponding decadal trends in emissions intensity. Over the long haul, there’s some indication that emissions are falling faster in developed nations – a reason for hope. But there’s also a lot of diversity, and many nations have positive trends in intensity. More importantly, even with major wars and depressions, no major emitter has achieved the kind of intensity trend (about -7%/yr) needed to achieve 80% emissions reductions by 2050 while sustaining 3%/yr GDP growth. That suggests that achieving aggressive goals may require more than technology, including – gasp – lifestyle changes.

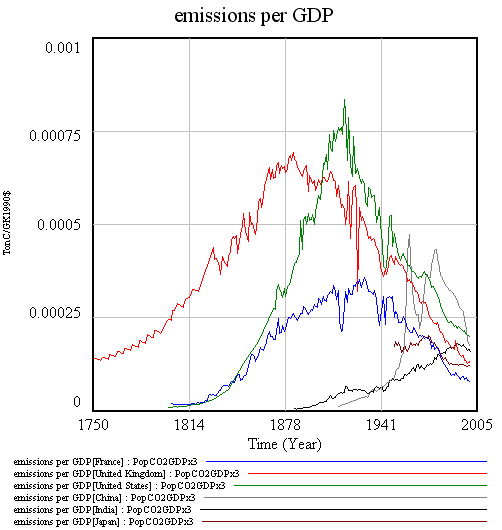
6 country emissions intensity

A closer look at intensity for 6 major emitters. Notice intensity rising in China and India until recently, and that Chinese data is indeed suspect.

Pielke, Wigley, and Green wrap up:

There is no question about whether technological innovation is necessary ’” it is. The question is, to what degree should policy focus directly on motivating such innovation? The IPCC plays a risky game in assuming that spontaneous advances in technological innovation will carry most of the burden of achieving future emissions reductions, rather than focusing on creating the conditions for such innovations to occur.

There’s a second risky game afoot, which is assuming that “creating the conditions for such innovations to occur” means investing in R&D, exclusive of other measures. To achieve material reductions in emissions, “occur” must mean “be adopted” not just “be invented.” Absent market signals and institutional changes, it is unlikely that technologies like carbon sequestration will ever be adopted. Others, like vehicle and lighting efficiency, could easily see their gains eroded by increased consumption of energy services, which become cheaper as technology improves productivity.

More on Climate Predictions

No pun intended.

Scott Armstrong has again asserted on the JDM list that global warming forecasts are merely unscientific opinions (ignoring my prior objections to the claim). My response follows (a bit enhanced here, e.g., providing links).


Today would be an auspicious day to declare the death of climate science, but I’m afraid the announcement would be premature.

JDM researchers might be interested in the forecasts of global warming as they are based on unaided subjective forecasts (unaided by forecasting principles) entered into complex computer models.

This seems to say that climate scientists first form an opinion about the temperature in 2100, or perhaps about climate sensitivity to 2x CO2, then tweak their models to reproduce the desired result. This is a misperception about models and modeling. First, in a complex physical model, there is no direct way for opinions that represent outcomes (like climate sensitivity) to be “entered in.” Outcomes emerge from the specification and calibration process. In a complex, nonlinear, stochastic model it is rather difficult to get a desired behavior, particularly when the model must conform to data. Climate models are not just replicating the time series of global temperature; they first must replicate geographic and seasonal patterns of temperature and precipitation, vertical structure of the atmosphere, etc. With a model that takes hours or weeks to execute, it’s simply not practical to bend the results to reflect preconceived notions. Second, not all models are big and complex. Low order energy balance models can be fully estimated from data, and still yield nonzero climate sensitivity.

I presume that the backing for the statement above is to be found in Green and Armstrong (2007), on which I have already commented here and on the JDM list. Continue reading “More on Climate Predictions”

On Limits to Growth

It’s a good idea to read things you criticize; checking your sources doesn’t hurt either. One of the most frequent targets of uninformed criticism, passed down from teacher to student with nary a reference to the actual text, must be The Limits to Growth. In writing my recent review of Green & Armstrong (2007), I ran across this tidbit:

Complex models (those involving nonlinearities and interactions) harm accuracy because their errors multiply. Ascher (1978), refers to the Club of Rome’s 1972 forecasts where, unaware of the research on forecasting, the developers proudly proclaimed, “in our model about 100,000 relationships are stored in the computer.” (page 999)

Setting aside the erroneous attributions about complexity, I found the statement that the MIT world models contained 100,000 relationships surprising, as both can be diagrammed on a single large page. I looked up electronic copies of World Dynamics and World3, which have 123 and 373 equations respectively. A third or more of those are inconsequential coefficients or switches for policy experiments. So how did Ascher, or Ascher’s source, get to 100,000? Perhaps by multiplying by the number of time steps over the 200 year simulation period – hardly a relevant measure of complexity.

Meadows et al. tried to steer the reader away from focusing on point forecasts. The introduction to the simulation results reads,

Each of these variables is plotted on a different vertical scale. We have deliberately omitted the vertical scales and we have made the horizontal time scale somewhat vague because we want to emphasize the general behavior modes of these computer outputs, not the numerical values, which are only approximately known. (page 123)

Many critics have blithely ignored such admonitions, and other comments to the effect of, “this is a choice, not a forecast” or “more study is needed.” Often, critics don’t even refer to the World3 runs, which are inconvenient in that none reaches overshoot in the 20th century, making it hard to establish that “LTG predicted the end of the world in year XXXX, and it didn’t happen.” Instead, critics choose the year XXXX from a table of resource lifetime indices in the chapter on nonrenewable resources (page 56), which were not forecasts at all. Continue reading “On Limits to Growth”