I can’t resist a dataset. So, now that I have the NYC teacher value added modeling results, I have to keep picking at it.
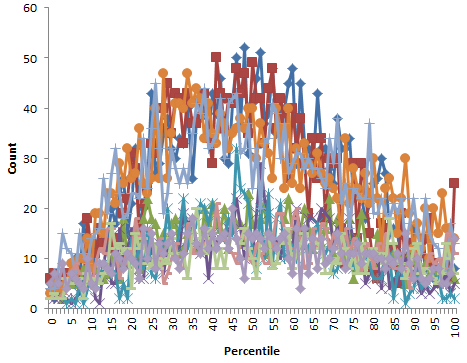
The 2007-2008 results are in a slightly different format from the later years, but contain roughly the same number of teacher ratings (17,000) and have lots of matching names, so at first glance the data are ok after some formatting. However, it turns out that, unlike 2008-2010, they contain percentile ranks that are nonuniformly distributed (which should be impossible). They also include values of both 0 and 100 (normally, percentiles are reported 1 to 100 or 0 to 99, but not including both endpoints, so that there are 100 rather than 101 bins). <sound of balled up spreadsheet printout ricocheting around inside metal wastebasket>

Nonuniform distribution of percentile ranks for 2007-2008 school year, for 10 subject-grade combinations.
That leaves only two data points: 2008-2009 and 2009-2010. That’s not much to go on for assessing the reliability of teacher ratings, for which you’d like to have lots of repeated observations of the same teachers. Actually, in a sense there are a bit more than two points, because the data includes a multi-year rating, that includes information from intervals prior to the 2008-2009 school year for some teachers.
I’d expect the multi-year rating to behave like a Bayesian update as more data arrives. In other words, the multi-year score at (t) is roughly the multi-year score at (t-1) convolved with the single-year score for (t). If things are approximately normal, this would work like:
- Prior: multi-year score for year (t-1), distributed N( mu, sigma/sqrt(n) ) – with mu = teacher’s true expected value added, and sigma = measurement and performance variability, incorporating n years of data
- Data likelihood: single-year score for year (t), ~ N( mu, sigma )
- Posterior: multi-year score for year (t), ~ N( mu, sigma/sqrt(n+1) )
So, you’d expect that the multi-year score would behave like a SMOOTH, with the estimated value adjusted incrementally toward each new single-year value observed, and the confidence bounds narrowing with sqrt(n) as observations accumulate. You’d also expect that individual years would have similar contributions to the multi-year score, except to the extent that they differ in number of data points (students & classes) and data quality, which is probably not changing much.
However, I can’t verify any of these properties:

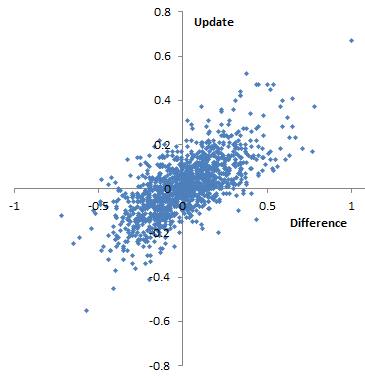
Difference of 09-10 score from 08-09 multi-year score vs. update to multi-year score from 08-09 to 09-10. I’d expect this to be roughly diagonal, and not too noisy. However, it appears that there are a significant number of teachers for whom the multi-year score goes down, despite the fact that their annual 09-10 score exceeds their prior 08-09 multi-year score (and vice versa). This also occurs in percentiles. This is 4th grade English, but other subject-grade combinations appear similar.
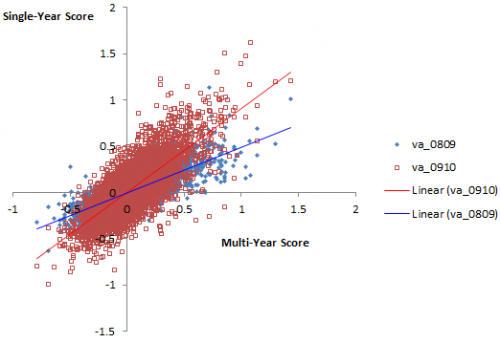
 Plotting single-year scores for 08-09 and 09-10 against the 09-10 multi-year score, it appears that the multi-year score is much better correlated with 09-10, which would seem to indicate that 09-10 has greater leverage on the outcome. Again, his is 4th grade English, but generalizes.

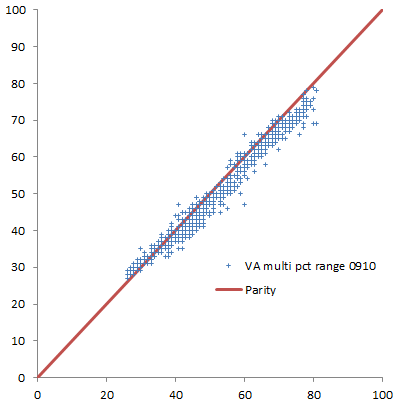
Percentile range (confidence bounds) for multi-year rank in 08-09 vs. 09-10 school year, for teachers in the 40th-59th percentile in 08-09. Ranges mostly shrink, but not by much.
I hesitate to read too much into this, because it’s possible that (a) the FOI datasheets are flawed, (b) I’m misinterpreting the data, which is rather sketchily documented, or (c) in haste, I’ve just made a total hash of this analysis. But if none of those things are true, then it would seem that the properties of this measurement system are not very desirable. It’s just very weird for a teacher’s multi-year score to go up when his single-year score goes down; a possible explanation could be numerical instability of the measurement process. It’s also strange for confidence bounds to widen, or narrow hardly at all, in spite of a large injection of data; that suggests that there’s very little incremental information in each school year. Perhaps one could construct some argument about non-normality of the data that would explain things, but that might violate the assumptions of the estimates. Or, perhaps it’s some artifact of the way scores are normalized. Even if this is a true and proper behavior of the estimate, it gives the measurement system a face validity problem. For the sake of NYC teachers, I hope that it’s (c).

1 thought on “More NYC teacher VAM mysteries”