I like this: The Unofficial List of Pundits/Experts Who Were Wrong on the Housing Bubble
Tag: financial crisis
Dynamics of financial guarantee programs
Ever since the housing market fell apart, I’ve been meaning to write about some excellent work on federal financial guarantee programs, by colleagues Jim Hines (of TUI fame) and Jim Thompson.
Designing Programs that Work.
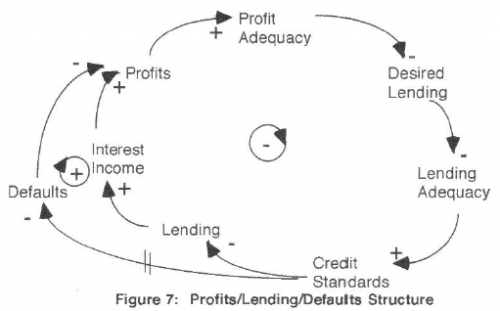
This document is part of a series reporting on a study of tederal financial guarantee programs. The study is concerned with how to design future guarantee programs so that they will be more robust, less prone to problems. Our focus has been on internal (that is. endogenous) weaknesses that might inadvertently be designed into new programs. Such weaknesses may be described in terms of causal loops. Consequently, the study is concerned with (a) identifying the causal loops that can give rise to problematic behavior patterns over time, and (b) considering how those loops might be better controlled.
Their research dates back to 1993, when I was a naive first-year PhD student, but it’s not a bit dated. Rather, it’s prescient. It considers a series of design issues that arise with the creation of government-backed entities (GBEs). From today’s perspective, many of the features identified were the seeds of the current crisis. Jim^2 identify a number of structural innovations that control the undesirable behaviors of the system. It’s evident that many of these were not implemented, and from what I can see won’t be this time around either.
There’s a sophisticated model beneath all of this work, but the presentation is a nice example of a nontechnical narrative. The story, in text and pictures, is compelling because the modeling provided internal consistency and insights that would not have been available through debate or navel rumination alone.
I don’t have time to comment too deeply, so I’ll just provide some juicy excerpts, and you can read the report for details:
The profit-lending-default spiral
The situation described here is one in which an intended corrective process is weakened or reversed by an unintended self-reinforcing process. The corrective process is one in which inadequate profits are corrected by rising income on an increasing portfolio. The unintended self-reinforcing process is one in which inadequate profits are met with reduced credit standards which cause higher defaults and a further deterioration in profits. Because the fee and interest income lrom a loan begins to be received immediately, it may appear at first that the corrective process dominates, even if the self-reinforcing is actually dominant. Managers or regulators initially may be encouraged by the results of credit loosening and portfolio building, only to be surprised later by a rising tide of bad news.
As is typical, some well-intentioned policies that could mitigate the problem behavior have unpleasant side-effects. For example, adding risk-based premiums for guarantees worsens the short-term pressure on profits when standards erode, creating a positive loop that could further drive erosion.
The Growth Bubble
I caught up with my email just after my last post, which questioned the role of the real economy in the current financial crisis. I found this in my inbox, by Thomas Friedman, currently the most-emailed article in the NYT:
Let’s today step out of the normal boundaries of analysis of our economic crisis and ask a radical question: What if the crisis of 2008 represents something much more fundamental than a deep recession? What if it’s telling us that the whole growth model we created over the last 50 years is simply unsustainable economically and ecologically and that 2008 was when we hit the wall ’” when Mother Nature and the market both said: ‘No more.’
Certainly there are some parallels between the housing bubble and environment/growth issues. You have your eternal growth enthusiasts with plausible-sounding theories, cheered on by people in industry who stand to profit.
There’s plenty of speculation about the problem ahead of time:

Google news timeline – housing bubble
People in authority doubt that there’s a problem, and envision a soft landing. In any case, nobody does anything about it.
Sound familiar so far?
However, I think it’s a bit of a leap to attribute our current mess to unsustainability in the real economy. For one thing, in hindsight, it’s clear that we weren’t overshooting natural carrying capacity in 1929, so it’s clearly possible to have a depression without an underlying resource problem. For another, we had ridiculously high commodity prices, but not many other direct impacts of environmental catastrophe (other than all the ones that have been slowly worsening for decades). My guess is that environmental overshoot has a lot longer time constant than housing or tech stock markets, both on the way up and the way down, so overshoot will evolve in more gradual and diverse ways at first. I think at best you can say that detecting the role of unsustainable resource management is like the tropical storm attribution problem. There are good theoretical reasons to think that higher sea surface temperatures contribute to tropical storm intensity, but there’s little hope of pinning Katrina on global warming specifically.
Personally, I think it’s possible that EIA is right, and peak oil is a little further down the road. With a little luck, asset prices might stabilize, and we could get another run of growth, at least from the perspective of those who benefit most from globalization. If so, will we learn from this bubble, and take corrective action before the next? I hope so.
I think the most important lesson could be the ending of the housing bubble, as we know it so far. It’s not a soft landing; positive feedbacks have taken over, as with a spark in a dry forest. That seems like a really good reason to step back and think, not just how to save big banks, but how to turn our current situation into a storm of creative destruction that mitigates the bigger one coming.
What about the real economy?
I sort of follow a bunch of economics blogs. Naturally they’re all very much preoccupied with the financial crisis. There’s a lot of debate about Keynesian multipliers, whether the stimulus will work, liquidity traps, bursting bubbles, and the like. If you step back, it appears to be a conversation about how to use fiscal and monetary policy to halt a vicious cycle of declining expectations fueled by financial instruments no one really understands – essentially an attempt to keep the perceived economy from dragging down the real economy (as it is clearly now doing). The implicit assumption often seems to be that, if we could only untangle the current mess, the economy would return to its steady state growth path.
What I find interesting is that there’s little mention of what might have been wrong in the real economy to begin with, and its role in the current crisis. Clearly the last decade was a time of disequilibrium, not just in the price of risk, but in the real capital investments and consumption patterns that flowed from it. My working hypothesis is that we were living in a lala land of overconsumption, funded by deficits, sovereign wealth funds, resource drawdown, and failure to invest in our own future. In that case, the question for the real economy is, how much does consumption have to fall to bring things back into balance? My WAG is 15% – which implies a heck of a lot of reallocation of activity in the real economy. What does that look like? Could we see it through the fog of knock-on effects that we’re now experiencing? Is there something we could be doing, on top of fiscal and monetary policy, to ease the transition?
SD on Long Waves, Boom & Bust
Two relevant conversations from the SD email list archive:
Where are we in the long wave?
Bill Harris asks, in 2003,
… should a reasonable person think we are now in the down side of a long wave? That the tough economic times we’ve seen for the past few years will need years to work through, as levels adjust? That simple, short-term economic fixes wont work as they may have in the past? That the concerns we’ve heard about deflation should be seen in a longer context of an entire cycle, not as an isolated event to be overcome? Is there a commonly accepted date for the start of this decline?
Was Bill 5 years ahead of schedule?
Preventing the next boom and bust
Kim Warren asks, in 2001,
This is a puzzle – we take a large fraction of the very brightest and best educated people in the world, put them through 2 years of further intensive education in how business, finance and economics are supposed to work, set them to work in big consulting firms, VCs, and investment banks, pay them highly and supervise them with very experienced and equally bright managers. Yet still we manage to invent quite implausible business ideas, project unsustainable earnings and market performance, and divert huge sums of money and talented people from useful activity into a collective fantasy. Some important questions remain unanswered, like who they are, what they did, how they got away with it, and why the rest of us meekly went along with them? So the challenge to SDers in business is … where is the next bubble coming from, what will it look like, and how can we stop it?
Clearly this is one nut we haven’t cracked.
Can Montana Escape Recession Ravages?
The answer is evidently now “no”, but until recently the UofM’s Bureau of Business and Economic Research director Patrick Barkey thought so:
“As early as last summer we still thought Montana would escape this recession,” he said. “We knew the national economic climate was uncertain, but Montana had been doing pretty well in the previous two recessions. We now know this is a global recession, and it is a more severe recession, and it’s a recession that’s not going to leave Montana unscathed.”
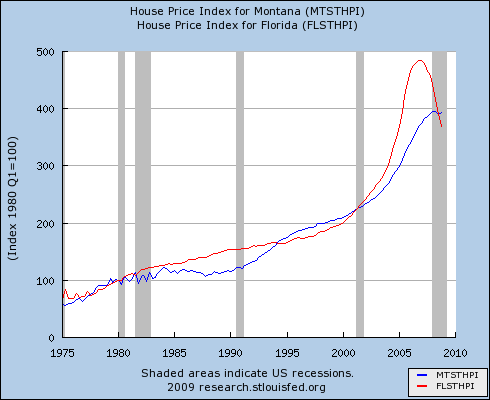
Indeed, things aren’t as bad here as they are in a lot of other places – yet. Compare our housing prices to Florida’s:
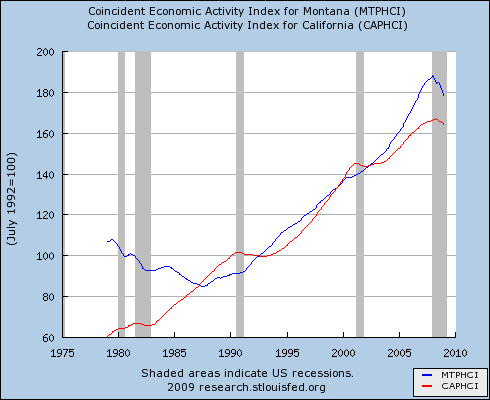
On the other hand, our overall economic situation shows a bigger hit than some places with hard-hit housing markets. Here’s the Fed’s coincident index vs. California:
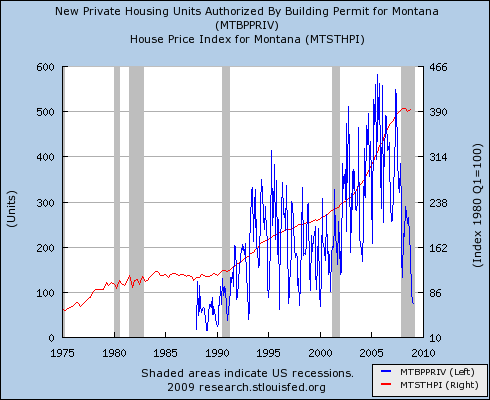
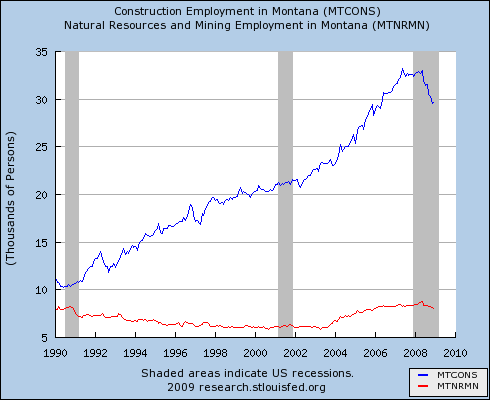
As one would expect, the construction and resource sectors are particularly hard hit by the double-whammy of housing bubble and commodity price collapse. In spite of home prices that seem to have held steady so far, new home construction has fallen dramatically:
Interestingly, that hasn’t hit construction employment as hard as one would expect. Mining and resources employment has taken a similar hit, though you can hardly see it here because the industry is comparatively small (so why is its influence on MT politics comparatively large?).
So, where’s the bottom? For metro home prices nationwide, futures markets think it’s 10 to 20% below today, some time around the end of 2010. If the recession turns into a depression, that’s probably too rosy, and it’s hard to see how Montana could escape the contagion. But the impact will certainly vary regionally. The answer for Montana likely depends a lot on two factors: how bubbly was our housing market, and how recession-resistant is our mix of economic activity?
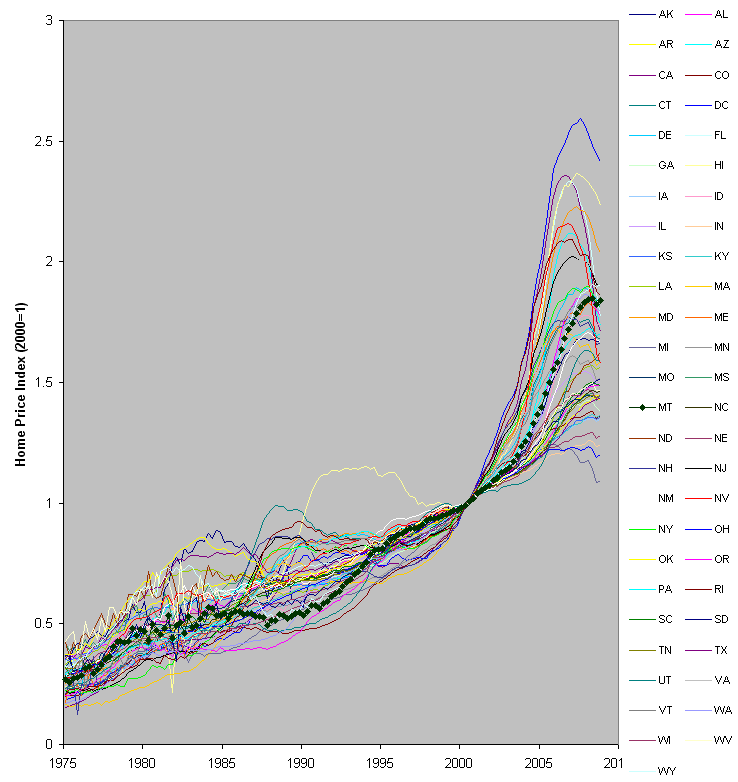
On the first point, here’s the Montana housing market (black diamonds), compared to the other 49 states and DC:
Prices above are normalized to 2000 levels, using the OFHEO index of conforming loan sales (which is not entirely representative – read on). At the end of 2003, Montana ranked 20th in appreciation from 2000. At the end of 2008, MT was 8th. Does the rise mean that we’re holding strong on fundamentals while others collapse? Or just that we’re a bunch of hicks, last to hear that the party’s over? Hard to say.
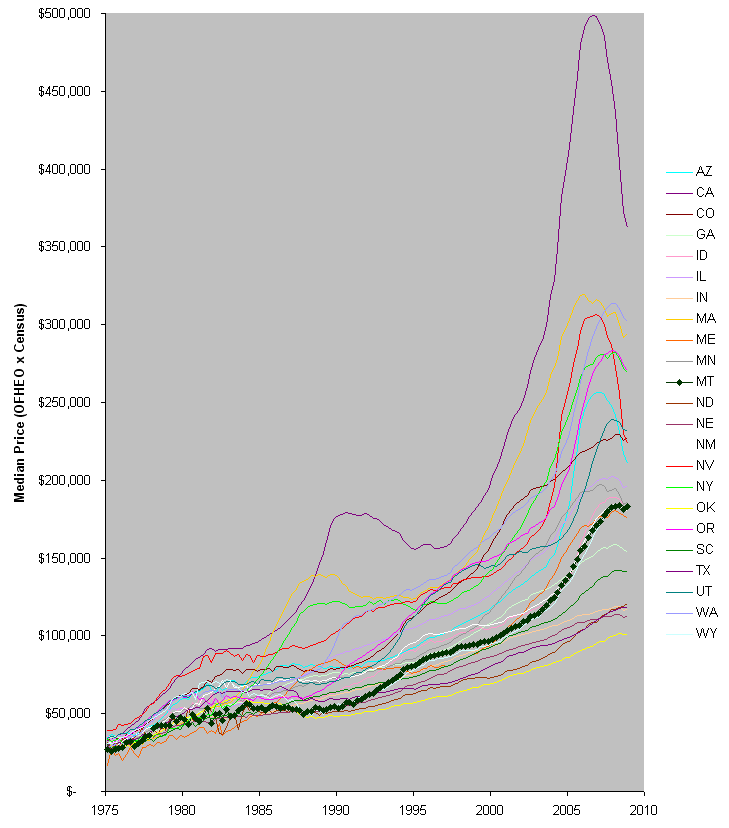
It’s perhaps a little easier to separate fundamentals from enthusiasm by looking at prices in absolute terms. Here, I’ve used the Census Bureau’s 2000 median home prices to translate the OFHEO index into $ terms:
Among its western region peers, a few other large states, and random states I like, Montana starts to look like a relative bargain still. The real question then is whether demographic trends (latte cowboys like me moving in) can buoy the market against an outgoing tide. I suspect that we’ll fare reasonably well in the long run, but suffer a significant undershoot in the near term.
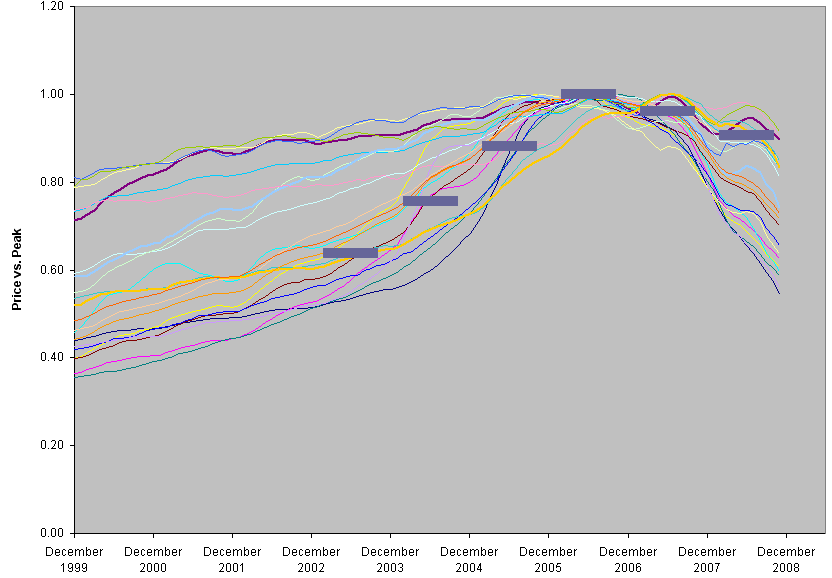
The OFHEO indices above are a little puzzling, in that so many states seem to be just now, or not yet, peaking. For comparison, here are the 20 metro areas in the CSI index (lines), together with Gallatin County’s median prices (bars):
These more representative indices still show Montana holding up comparatively well, but with Gallatin County peaking in 2006. I suspect that the OFHEO index is a biased picture of the wider market, due to its exclusion of nonconforming loans, and that this is a truer picture.
Bathtub Still Filling, Despite Slower Inflow
Found this bit, under the headline Carbon Dioxide Levels Rising Despite Economic Downturn:
A leading scientist said on Thursday that atmospheric levels of carbon dioxide are hitting new highs, providing no indication that the world economic downturn is curbing industrial emissions, Reuters reported.
Joe Romm does a good job explaining why conflating emissions with concentrations is a mistake. I’ll just add the visual:

And the data to go with it:
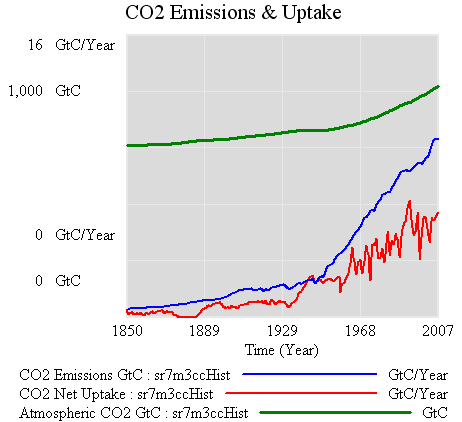
It would indeed take quite a downturn to bring the blue (emissions) below the red (uptake), which is what would have to happen to see a dip in the CO2 atmospheric content (green). In fact, the problem is tougher than it looks, because a fall in emissions would be accompanied by a fall in net uptake, due to the behavior of short-term sinks. Notice that atmospheric CO2 kept going up after the 1929 crash. (Interestingly, it levels off from about 1940-1945, but it’s hard to attribute that because it appears to be within natural variability).
At the moment, it’s kind of odd to look for the downturn in the atmosphere when you can observe fossil fuel consumption directly. The official stats do involve some lag, but less than waiting for natural variability to shake out of sparse atmospheric measurements. Things might change soon, though, with the advent of satellite measurements.
Another Bailout MetaRoundup
More good stuff from my blog reader:
Real Time Economics – Secondary Sources: Rebutting Myths, King on Stability, Green Econ & Secondary Sources: Rates, Innovation, Recession, Suprime Lending
Greg Mankiw – More Commentary on the Financial Mess
Economist’s View – links for 2008-10-23 &Â links for 2008-10-22
Marginal Revolution – Four myths of the credit crisis, again
Econbrowser – More Unhappy Numbers
Now THAT's exponential growth
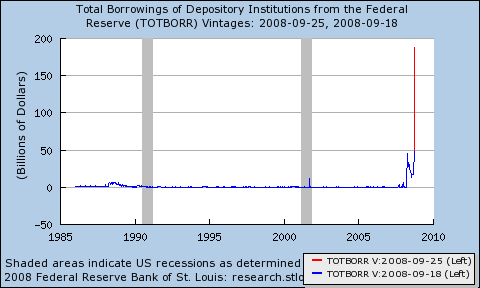
Brad Setser analyzes the Fed’s balance sheet in Extraordinary Times. They sure are:
Bailout MetaRoundup & Alternatives
MetaRoundup:
Several of the economics blogs I read have had useful roundups of bailout commentary. A few I find found useful:
Do we need to act now? on Economist’s View
9/26 Links on Economist’s View
NYT Economix’ analyst roundup
Greg Mankiw’s roundup of commentary
Update 9/29:
Real Time Economics’ Secondary Sources
Update 10/1:Â
Greg Mankiw with more commentary
Alternative Plans:
Economists Against the Paulson Plan
Brad de Long on Krugman on the Dodd plan
WSJ Real Time Economics’ Text of Lawmakers’ Agreement on Principles
Thomas Palley on Saving the Financial System
Marginal Revolution on the Republican plan to rescue mortgages instead of buying mortgage assets
Marginal Revolution with a Modest Proposal (finding and isolating toxic assets)
Update 9/27:
Marginal Revolution with substitute bridges
Greg Mankiw with a letter from Robert Shimer with a nice analysis, including problems with Paulson, the lemons problem, and the Diamond, Kaplan, Kashyap, Rajan & Thaler fix
Update 9/28:
Real Time Economics on securitization
Brad deLong on nationalization (the Swedish model)
Update 9/29:
The Big Picture with Stop Targeting Asset Prices
Marginal Revolution asks, is the Sweden plan better?

