More reasons to love emissions pricing

I was flipping through a recent Tech Review, and it seemed like every other article was an unwitting argument for emissions pricing. Two examples:

Job title of the future: carbon accountant

We need carbon engineers who know how to make emissions go away more than we need bean counters to tally them. Are we also going to have nitrogen accountants, and PFAS accountants, and embodied methane in iridium accountants, and … ? That way lies insanity.

The fact is, if carbon had a nontrivial price attached at the wellhead, it would pervade the economy, and we’d already have carbon accountants. They’re called accountants.

More importantly, behind those accountants is an entire infrastructure of payment systems that enforces conservation of money. You can only cheat an accounting system for so long, before the cash runs out. We can’t possibly construct parallel systems providing the same robustness for every externality we’re interested in.

Here’s what we know about lab-grown meat and climate change

Realistically, now matter how hard we try to work out the relative emissions of natural and laboratory cows, the confidence bounds on the answer will remain wide until the technology is used at scale.

We can’t guide that scaling process by assessments that are already out of date when they’re published. Lab meat innovators need a landscape in which carbon is priced into their inputs, so they can make the right choices along the way.

Climate Causality Confusion

A newish set of papers (1. Theory (preprint); 2. Applications (preprint); 3. Extension) is making the rounds on the climate skeptic sites, with – ironically – little skepticism applied.

The claim is bold:

… According to the commonly assumed causality link, increased [CO2] causes a rise in T. However, recent developments cast doubts on this assumption by showing that this relationship is of the hen-or-egg type, or even unidirectional but opposite in direction to the commonly assumed one. These developments include an advanced theoretical framework for testing causality based on the stochastic evaluation of a potentially causal link between two processes via the notion of the impulse response function. …. All evidence resulting from the analyses suggests a unidirectional, potentially causal link with T as the cause and [CO2] as the effect.

Galileo complex seeps in when the authors claim that absence of correlation or impulse response from CO2 -> temperature proves absence of causality:

Clearly, the results […] suggest a (mono-directional) potentially causal system with T as the cause and [CO2] as the effect. Hence the common perception that increasing [CO2] causes increased T can be excluded as it violates the necessary condition for this causality direction.

Unfortunately, these claims are bogus. Here’s why.

The authors estimate impulse response functions between CO2 and temperature (and back), using the following formalism:


where g(h) is the response at lag h. As the authors point out, if

the IRF is zero for every lag except for the specific lag 0, then Equation (1) becomes y(t)=bx(t-h0) +v(t). This special case is equivalent to simply correlating  y(t) with x(t-h0) at any time instance . It is easy to find (cf. linear regression) that in this case the multiplicative constant is the correlation coefficient of y(t) and  x(t-h0) multiplied by the ratio of the standard deviations of the two processes.

Now … anyone who claims to have an “advanced theoretical framework for testing causality” should be aware of the limitations of linear regression. There are several possible issues that might lead to misleading conclusions about causality.

Problem #1 here is bathtub statistics. Temperature integrates the radiative forcing from CO2 (and other things). This is not debatable – it’s physics. It’s old physics, and it’s experimental, not observational. If you question the existence of the effect, you’re basically questioning everything back to the Enlightenment. The implication is that no correlation is expected between CO2 and temperature, because integration breaks pattern matching. The authors purport to avoid integration by using first differences of temperature and CO2. But differencing both sides of the equation doesn’t solve the integration problem; it just kicks the can down the road. If y integrates x, then patterns of the integrals or derivatives of y and x won’t match either. Even worse differencing filters out the signals of interest.

Problem #2 is that the model above assumes only equation error (the term v(t) on the right hand side). In most situations, especially dynamic systems, both the “independent” (a misnomer) and dependent variables are subject to measurement error, and this dilutes the correlation or slope of the regression line (aka attenuation bias), and therefore also the IRF in the authors’ framework. In the case of temperature, the problem is particularly acute, because temperature also integrates internal variability of the climate system (weather) and some of this variability is autocorrelated on long time scales (because for example oceans have long time constants). That means the effective number of data points is a lot less than the 60 years or 720 months you’d expect from simple counting.

Dynamic variables are subject to other pathologies, generally under the heading of endogeneity bias, and related features with similar effects like omitted variable bias. Generalizing the approach to distributed lags in no way mitigates these. The bottom line is that absence of correlation doesn’t prove absence of causation.

Admittedly, even Nobel Prize winners can screw up claims about causality and correlation and estimate dynamic models with inappropriate methods. But causality confusion isn’t really a good way to get into that rarefied company.

I think methods purporting to assess causality exclusively from data are treacherous in general. The authors’ proposed method is provably wrong in some cases, including this one, as is Granger Causality. Even if you have pretty good assumptions, you’ll always find a system that violates them. That’s why it’s so important to take data-driven results with a grain of salt, and look for experimental control (where you can get it) and mechanistic explanations.

One way to tell if you’ve gotten causality wrong is when you “discover” mechanisms that are physically absurd. That happens on a spectacular scale in the third paper:

… we find Δ=23.5 and 8.1 Gt C/year, respectively, i.e., a total global increase in the respiration rate of Δ=31.6 Gt C/year. This rate, which is a result of natural processes, is 3.4 times greater than the CO2 emission by fossil fuel combustion (9.4 Gt C /year including cement production).

To put that in perspective, the authors propose a respiration flow that would put the biosphere about 30% out of balance. This implies a mass flow of trees harvested, soils destroyed, etc. 3.4 times as large as the planetary flow of fossil fuels. That would be about 4 cubic kilometers of wood, for example. In the face of the massive outflow from the biosphere, the 9.4 GtC/yr from fossil fuels went where, exactly? Extraordinary claims require extraordinary evidence, but the authors apparently haven’t pondered how these massive novel flows could be squared with other lines of evidence, like C isotopes, ocean Ph, satellite CO2, and direct estimates of land use emissions.

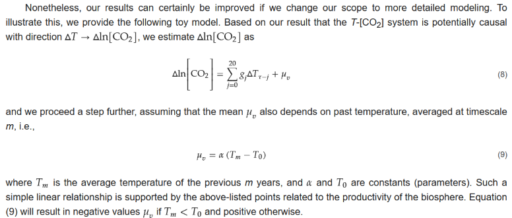
This “insight” is used to construct a model of the temperature->CO2 process:

In this model, the trend in CO2 is explained almost exclusively by the mean temperature effect mu_v = alpha*(T-T0). That effect is entirely ad hoc, with no basis in the impulse response framework.

How do we get into this pickle? I think the simple answer is that the authors’ specification of the system is incomplete. As above, they define a causal system,

y(t) = ∫g1(h)x(t-h)dh

x(t) = ∫g2(h)y(t-h)dh

where g(.) is an impulse response function weighting lags h and the integral is over h from 0 to infinity (because only nonnegative lags are causal). In their implementation, x and y are first differences, so in their climate example, Δlog(CO2) and ΔTemp. In the estimation of the impulse lag structures g(.), the authors impose nonnegativity and (optionally) smoothness constraints.

A more complete specification is roughly:

Y = A*X + U

dX/dt = B*X + E

where

  • X is a vector of system states (e.g., CO2 and temperature)
  • Y is a vector of measurements (observed CO2 and temperature)
  • A and B are matrices of coefficients (this is a linear view of the system, but could easily be generalized to nonlinear functions)
  • E is driving noise perturbing the state, and therefore integrated into it
  • U is measurement error

My notation could be improved to consider covariance and state-dependent noise, though it’s not really necessary here. Fred Schweppe wrote all this out decades ago in Uncertain Dynamic Systems, and you can now find it in many texts like Stengel’s Optimal Control and Estimation. Dixit and Pindyck transplanted it to economics and David Peterson brought it to SD where it found its way into Vensim as the combination of Kalman filtering and optimization.

How does this avoid the pitfalls of the Koutsoyiannis et al. approach?

  • An element of X can integrate any other element of X, including itself.
  • There are no arbitrary restrictions (like nonnegativity) on the impulse response function.
  • The system model (A, B, and any nonlinear elements augmenting the framework) can incorporate a priori structural knowledge (e.g., physics).
  • Driving noise and measurement error are recognized and can be estimated along with everything else.

Does the difference matter? I’ll leave that for a second post with some examples.


Held v Montana

The Montana climate case, Held vs. State of Montana, has just turned in a win for youth.

The decision looks pretty strong. I think the bottom line is that the legislature’s MEPA exclusions preventing consideration of climate in state regulation are a limitation of the MT constitutional environmental rights, and therefore require strict scrutiny. The state failed to show that the MEPA Limitation serves a compelling government interest.

Not to diminish the accomplishments of the plaintiffs, but the state put forth a very weak case. The Montana Supreme Court tossed out AG Knudsen’s untimely efforts to send the case back to the drawing board. The state’s own attorney, Thane Johnson, couldn’t get acronyms right for the IPCC and RCPs. That’s perhaps not surprising, given that the Director of Montana’s alleged environmental agency admitted unfamiliarity with the largest scientific body related to climate,

Montana’s top witnesses — state employees who are responsible for permitting fossil fuel projects — however, acknowledged they are not well-versed in climate science and at times struggled with the many acronyms used in the case.

Chris Dorrington, director of the Montana Department of Environmental Quality, told an attorney for the youth that he had been unaware of the U.N. Intergovernmental Panel on Climate Change (IPCC) — which has issued increasingly dire assessments since it was established more than 30 years ago to synthesize global climate data.

“I attended this trial last week, when there was testimony relevant to IPCC,” Dorrington said. “Prior to that, I wasn’t familiar, and certainly not deeply familiar with its role or its work.”

As noted by Judge Seeley, the state left much of the plaintiffs’ evidence uncontested. They also declined to call their start witness on climate science, Judith Curry, who reflects:

MT’s lawyers were totally unprepared for direct and cross examination of climate science witnesses. This was not surprising, since this is a very complex issue that they apparently had not previously encountered. One lawyer who was cross-examining the Plaintiffs’ witnesses kept getting confused by ICP (IPCC) and RPC (RCP). The Plaintiffs were very enthusiastic about keeping witnesses in reserve to rebut my testimony, with several of the Plaintiffs’ witnesses who were leaving on travel presenting pre-buttals to my anticipated testimony during their direct questioning – all of this totally misrepresented what was in my written testimony, and can now be deleted from the court record since I didn’t testify. I can see that all of this would have turned the Hearing into a 3-ring climate circus, and at the end of all that I might not have managed to get my important points across, since I am only allowed to respond to questions.

On Thurs eve, I received a call from the lead Montana lawyer telling me that they were “letting me off the hook.” I was relieved to be able to stay home and recapture those 4 days I had scheduled for travel to and from MT.

The state’s team sounds pretty dysfunctional:

Montana’s approach to the case has evolved since 2020, has evolved rapidly in the last 6 months since a new legal team was brought in, and even evolved rapidly during the course of the trial.  The lawyers I spoke to in Sept 2022 were gone by the end of Oct, with an interim team brought in from the private sector, and then a new team that was hired for the Montana’s State Attorney’s Office in Dec.

MT’s original expert witnesses were apparently tossed, and I and several other expert witnesses were brought on board in the 11th hour, around Sept 2022. Note:  instructions for preparing our written reports were received from lawyers two generations removed from the actual trial lawyers.  As per questioning during my Deposition, I gleaned that the state originally had a collection of witnesses that were pretty subpar (I don’t know who they were).  The new set of witnesses was apparently much better.

If the state has such a compelling case, why can’t they get their act together?

In any case, I find one argument in all of this really disturbing. Suppose we accept Curry’s math:

With regards to Montana’s CO2 emissions, based on 2019 estimates Montana produces 0.63% of U.S. emissions and 0.09% of global emissions.  For an anticipated warming of 2oC, Montana’s 0.09% of emissions would account for 0.0018oC of warming.  There are other ways to frame this calculation (and more recent numbers), but any way you slice it, you can’t come up with a significant amount of global warming that is caused by Montana’s emissions.

Never mind that MT is also only .0135% of global population. If you get granular enough, every region is a tiny fraction of the world in all things. So if we are to imagine that “my contribution is small” equates to “I don’t have to do anything about the problem,” then no one has to do anything about climate, or any other global problem for that matter. There’s no role for leadership, cooperation or enlightened self-interest. This is a circular firing squad for global civilization.

Computer Collates Climate Contrarian Claims

Coan et al. in Nature have an interesting text analysis of climate skeptics’ claims.

I’ve been at this long enough to notice that a few perennial favorites are missing, perhaps because they date from the 90s, prior to the dataset.

The big one is “temperature isn’t rising” or “the temperature record is wrong.” This has lots of moving parts. Back in the 90s, a key idea was that satellite MSU records showed falling temperatures, implying that the surface station record was contaminated by Urban Heat Island (UHI) effects. That didn’t end well, when it turned out that the UAH code had errors and the trend reversed when they were fixed.

Later UHI made a comeback when the SurfaceStations project crowdsourced an assessment of temperature station quality. Some turned out to be pretty bad. But again, when the dust settled, it turned out that the temperature trend was bigger, not smaller, when poor sites were excluded and TOD was corrected. This shouldn’t have been a surprise, because windy day analsyses and a dozen other things already ruled out UHI, but …

I consider this a reminder of the fact that part of the credibility of mainstream climate science arises not from the fact that models are so good, but because so many alternatives have been tried, and proved so bad, only to rise again and again.

Climate Catastrophe Loops

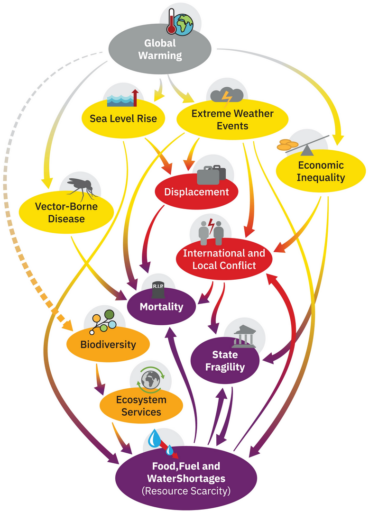
PNAS has a new article on climate catastrophe mechanisms, focused on the social side, not natural tipping points. The article includes a causal loop diagram capturing some of the key feedbacks:

The diagram makes an unconventional choice: link polarity is denoted by dashed lines, rather than the usual + and – designations at arrowheads. Per the caption,

This is a causal loop diagram, in which a complete line represents a positive polarity (e.g., amplifying feedback; not necessarily positive in a normative sense) and a dotted line denotes a negative polarity (meaning a dampening feedback).

Does this new convention work? I don’t think so. It’s not less visually cluttered, and it makes negative links look tentative, though in fact there’s no reason for a negative link to have any less influence than a positive one. I think it makes it harder to assess loop polarity by following reversals from – links. There’s at least one goof: increasing ecosystem services should decrease food and water shortages, so that link should have negative polarity.

The caption also confuses link and loop polarity: “a complete line represents a positive polarity (e.g., amplifying feedback”. A single line is a causal link, not a loop, and therefore doesn’t represent feedback at all. (The rare exception might be a variable with a link back to itself, sometimes used to indicate self-reinforcement without elaborating on the mechanism.)

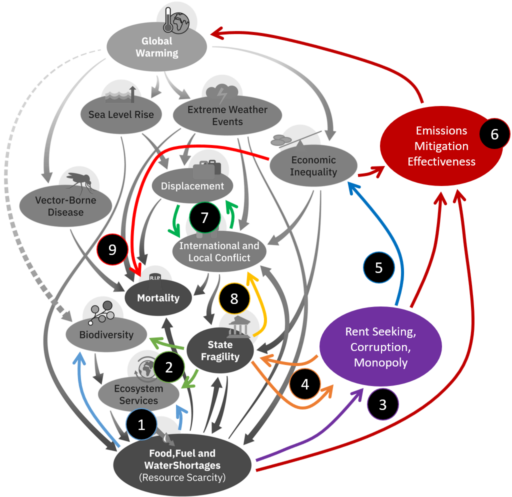
Nevertheless, I think this is a useful start toward a map of the territory. For me, it was generative, i.e. it immediately suggested a lot of related effects. I’ve elaborated on the original here:

  1. Food, fuel and water shortages increase pressure to consume more natural resources (biofuels, ag land, fishing for example) and therefore degrade biodiversity and ecosystem services. (These are negative links, but I’m not following the dash convention – I’m leaving polarity unlabeled for simplicity.) This is perverse, because it creates reinforcing loops worsening the resource situation.
  2. State fragility weakens protections that would otherwise protect natural resources against degradation.
  3. Fear of scarcity induces the wealthy to protect their remaining resources through rent seeking, corruption and monopoly.
  4. Corruption increases state fragility, and fragile states are less able to defend against further corruption.
  5. More rent seeking, corruption and monopoly increases economic inequality.
  6. Inequality, rent seeking, corruption, and scarcity all make emissions mitigation harder, eventually worsening warming.
  7. Displacement breeds conflict, and conflict displaces people.
  8. State fragility breeds conflict, as demagogues blame “the other” for problems and nonviolent conflict resolution methods are less available.
  9. Economic inequality increases mortality, because mortality is an extreme outcome, and inequality puts more people in the vulnerable tail of the distribution.

#6 is key, because it makes it clear that warming is endogenous. Without it, the other variables represent a climate-induced cascade of effects. In reality, I think we’re already seeing many of the tipping effects (resource and corruption effects on state fragility, for example) and the resulting governance problems are a primary cause of the failure to reduce emissions.

I’m sure I’ve missed a bunch of links, but this is already a case of John Muir‘s idea, “When we try to pick out anything by itself, we find it hitched to everything else in the Universe.”

Unfortunately, most of the hitches here create reinforcing loops, which can amplify our predicament and cause catastrophic tipping events. I prefer to see this as an opportunity: we can run these vicious cycles in reverse, making them virtuous. Fighting corruption makes states less fragile, making mitigation more successful, reducing future warming and the cascade of side effects that would otherwise reinforce state fragility in the future. Corruption is just one of many places to start, and any progress is amplified. It’s just up to us to cross enough virtuous tipping points to get the whole system moving in a good direction.

Lytton Burning

By luck and a contorted Jet Stream, Montana more or less escaped the horrific heat that gripped the Northwest at the end of June. You probably heard, but this culminated in temperatures in Lytton BC breaking all-time records for Canada and the globe north of latitude 50 by huge margins. The next day, the town burned to the ground.

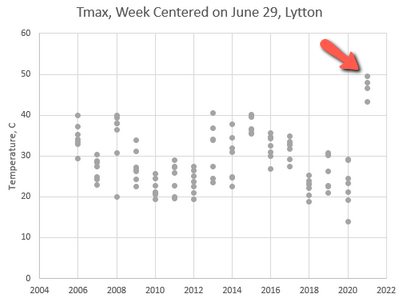
I wondered just how big this was, so when GHCN temperature records from KNMI became available, I pulled the data for a quick and dirty analysis. Here’s the daily Tmax for Lytton:

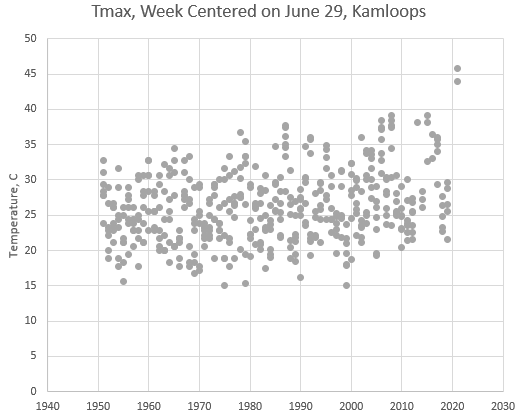
That’s about 3.5 standard deviations above the recent mean. Lytton’s records are short and fragmented, so I also pulled Kamloops (the closest station with a long record):

You can see how bizarre the recent event was, even in a long term context. In Kamloops, it’s a +4 standard deviation event, which means a likelihood of 1 in 16,000 if this were simply random. Even if you start adjusting for selection and correlations, it still looks exceedingly rare – perhaps a 1000-year event in a 70-year record.

Clearly it’s not simply random. For one thing, there’s a pretty obvious long term trend in the Kamloops record. But a key question is, what will happen to the variance of temperature in the future? The simplest thermodynamic argument is that energy in partitions of a system has a Boltzmann distribution and therefore that variance should go up with the mean. However, feedback might alter this.

This paper argues that variance goes up:

Extreme summertime temperatures are a focal point for the impacts of climate change. Climate models driven by increasing CO2 emissions project increasing summertime temperature variability by the end of the 21st century. If credible, these increases imply that extreme summertime temperatures will become even more frequent than a simple shift in the contemporary probability distribution would suggest. Given the impacts of extreme temperatures on public health, food security, and the global economy, it is of great interest to understand whether the projections of increased temperature variance are credible. In this study, we use a theoretical model of the land surface to demonstrate that the large increases in summertime temperature variance projected by climate models are credible, predictable from first principles, and driven by the effects of warmer temperatures on evapotranspiration. We also find that the response of plants to increased CO2 and mean warming is important to the projections of increased temperature variability.

But Zeke Housfather argues for stable variance:

summer variability, where extreme heat events are more of a concern, has been essentially flat. These results are similar to those found in a paper last fall by Huntingford et al published in the journal Nature. Huntingford and colleagues looked at both land and ocean temperature records and found no evidence of increasing variability. They also analyzed the outputs of global climate models, and reported that most climate models actually predict a slight decline in temperature variability over the next century as the world warms. The figure below, from Huntingford, shows the mean and spread of variability (in standard deviations) for the models used in the latest IPCC report (the CMIP5 models).

This is good news overall; increasing mean temperatures and variability together would lead to even more extreme heat events. But “good news” is relative, and the projected declines in variability are modest, so rising mean temperatures by the end of this century will still push the overall temperature distribution well outside of what society has experienced in the last 12,000 years.

If he’s right, stable variance implies that the mean temperature of scenarios is representative of what we’ll experience – nothing further to worry about. I hope this is true, but I also hope it takes a long time to find out, because I really don’t want to experience what Lytton just did.

Nordhaus on Subsidies

I’m not really a member of the neoclassical economics fan club, but I think this is on point:

“Subsidies pose a more general problem in this context. They attempt to discourage carbon-intensive activities by making other activities more attractive. One difficulty with subsidies is identifying the eligible low-carbon activities. Why subsidize hybrid cars (which we do) and not biking (which we do not)? Is the answer to subsidize all low carbon activities? Of course, that is impossible because there are just too many low-carbon activities, and it would prove astronomically expensive. Another problem is that subsidies are so uneven in their impact. A recent study by the National Academy of Sciences looked at the impact of several subsidies on GHG emissions. It found a vast difference in their effectiveness in terms of CO2removed per dollar of subsidy. None of the subsidies were efficient; some were horribly inefficient; and others such as the ethanol subsidy were perverse and actually increased GHG emissions. The net effect of all the subsidies taken together was effectively zero!” So in the end, it is much more effective to penalize carbon emissions than to subsidize everything else.” (Nordhaus, 2013, p. 266)

(Via a W. Hogan paper, https://scholar.harvard.edu/whogan/files/hogan_hepg_100418r.pdf)

Climate Skeptics in Search of Unity

The most convincing thing about mainstream climate science is not that the models are so good, but that the alternatives are so bad.

Climate skeptics have been at it for 40 years, but have produced few theories or predictions that have withstood the test of time. Even worse, where there were once legitimate measurement issues and model uncertainties to discuss, as those have fallen one by one, the skeptics are doubling down on theories that rely on “alternative” physics. The craziest ideas get the best acronyms and metaphors. The allegedly skeptical audience welcomes these bizarre proposals with enthusiasm. As they turn inward, they turn on each other.

The latest example is in the Lungs of Gaia at WUWT:

A fundamental concept at the heart of climate science is the contention that the solar energy that the disk of the Earth intercepts from the Sun’s irradiance must be diluted by a factor of 4. This is because the surface area of a globe is 4 times the interception area of the disk silhouette (Wilde and Mulholland, 2020a).

This geometric relationship of divide by 4 for the insolation energy creates the absurd paradox that the Sun shines directly onto the surface of the Earth at night. The correct assertion is that the solar energy power intensity is collected over the full surface area of a lit hemisphere (divide by 2) and that it is the thermal radiant exhaust flux that leaves from the full surface area of the globe (divide by 4).

Setting aside the weird pedantic language that seems to infect those with Galileo syndrome, these claims are simply a collection of errors. The authors seem to be unable to understand the geometry of solar flux, even though this is taught in first-year physics.

Some real college physics (divide by 4).

The “divide by 4” arises because the solar flux intercepted by the earth is over an area pi*r^2 (the disk of the earth as seen from the sun) while the average flux normal to the earth’s surface is over an area 4*pi*r^2 (the area of a sphere).

The authors’ notion of “divide by 2” resulting in 1368/2 = 684 w/m^2 average is laughable because it implies that the sun is somehow like a luminous salad bowl that delivers light at 1368 w/m^2 normal to the surface of one side of the earth only. That would make for pretty interesting sunsets.

In any case, none of this has much to do with the big climate models, which don’t “dilute” anything, because they have explicit geometry of the earth and day/night cycles with small time steps. So, all of this is already accounted for.

To his credit, Roy Spencer – a hero of the climate skeptics movement of the same magnitude as Richard Lindzen – arrives early to squash this foolishness:

How can some people not comprehend that the S/4 value of solar flux does NOT represent the *instantaneous* TOA illumination of the whole Earth, but instead the time-averaged (1-day or longer) solar energy available to the whole Earth. There is no flat-Earth assumption involved (in fact, dividing by 4 is because the Earth is approximately spherical). It is used in only simplistic treatments of Earth’s average energy budget. Detailed calculations (as well as 4D climate models as well as global weather forecast models) use the full day-night (and seasonal) cycle in solar illumination everywhere on Earth. The point isn’t even worth arguing about.

Responding to the clueless authors:

Philip Mulholland, you said: “Please confirm that the TOA solar irradiance value in a climate model cell follows the full 24 hour rotational cycle of daytime illumination and night time darkness.”

Oh, my, Philip… you cannot be serious.

Every one of the 24+ climate models run around the world have a full diurnal cycle at every gridpoint. This is without question. For example, for models even 20+ years ago start reading about the diurnal cycles in the models on page 796 of the following, which was co-authored by representatives from all of the modeling groups: https://www.ipcc.ch/site/assets/uploads/2018/02/WG1AR5_Chapter09_FINAL.pdf

Finally:

Philip, Ed Bo has hit the nail on the head. Your response to him suggests you do not understand even the basics of climate modeling, and I am a little dismayed that your post appeared on WUWT.

Undeterred, the WUWT crowd then proceeds to savage anyone, including their erstwhile hero Spencer, who dares to challenge the new “divide by 2” orthodoxy.

Dr roy with his fisher price cold warms hot physics tried to hold the line for the luke-warmers, but soon fecked off when he knew he would be embarrassed by the grown-ups in the room…..

This is not the first time a WUWT post has claimed to overturn climate science. There are others, like the 2011 Unified Theory of Climate. It’s basically technobabble, notable primarily for its utter obscurity in the nine years following. It’s not really worth analyzing, though I am a little curious how a theory driven by static atmospheric mass explains dynamics. Also, I notice that the perfect fit to the data for 7 planets in Fig. 5 has 7 parameters – ironic, given that accusations of overparameterization are a perennial favorite of skeptics. Amusingly, one of the authors of the “divide by two” revolution (Wilde) appears in the comments to point out his alternative “Unifying” Theory of Climate.

Are these alternate theories in agreement, mutually exclusive, or just not even wrong? It would be nice if skeptics would get together and decide which of their grand ideas is the right one. Does atmospheric pressure run the show, or is it sunspots? And which fundamentals that mathematicians and physicists screwed up have eluded verification for all these years? Is it radiative transfer, or the geometry of spheres and disks? Is energy itself misdefined? Inquiring minds want to know.

The bottom line is that Roy Spencer is right. It isn’t worth arguing about these things, any more than its worth arguing with flat earthers or perpetual motion enthusiasts. Engaging will just leave you wondering if proponents are serious, as in seriously deluded, or just yanking your chain while keeping a straight face.


Emissions Pricing vs. Standards

You need an emissions price in your portfolio to balance effort across all tradeoffs in the economy.

The energy economy consists of many tradeoffs. Some of these are captured in the IPAT framework:

Emissions 
= Population x GDP per Capita x Energy per GDP x Emissions per Energy

IPAT shows that, to reduce emisisons, there are multiple points of intervention. One could, for example, promote lower energy intensity, or reduce the carbon intensity of energy, or both.

An ideal policy, or portfolio of policies, would:

  • Cover all the bases – ensure that no major opportunity is left unaddressed.
  • Balance the effort – an economist might express this as leveling the shadow prices across areas.

We have a lot of different ways to address each tradeoff: tradeable permits, taxes, subsidies, quantity standards, performance standards, command-and-control, voluntary limits, education, etc. So far, in the US, we have basically decided that taxes are a non-starter, and instead pursued subsidies and tax incentives, portfolio and performance standards, with limited use of tradeable permits.

Here’s the problem with that approach. You can decompose the economy a lot more than IPAT does, into thousands of decisions that have energy consequences. I’ve sampled a tiny fraction below.

Is there an incentive?

Decision Standards Emissions Price
Should I move to the city or the suburbs? No  Yes
Should I telecommute? No  Yes
Drive, bike, bus or metro today? No  Yes
Car, truck or SUV? No (CAFE gets this wrong)  Yes
Big SUV or small SUV? CAFE (again)  Yes
Gasoline, diesel, hybrid or electric? ZEV, tax credits  Yes
Regular or biofuel? LCFS, CAFE credits  Yes
Detached house or condo? No  Yes
Big house or small? No  Yes
Gas or heat pump? No  Yes
High performance building envelope or granite countertops? Building codes (lowest common denominator)  Yes
Incandescent or LED lighting? Bulb Ban  Yes
LEDs are cheap – use more? No  Yes
Get up to turn out an unused light? No  Yes
Fridge: top freezer, bottom freezer or side by side? No  Yes
Efficient appliances? Energy Star (badly)  Yes
Solar panels? Building codes, net metering, tax credits, cap & trade  Yes
Green electricity? Portfolio standards  Yes
2 kids or 8? No  Yes

The beauty of an emissions price – preferably charged at the minemouth and wellhead – is that it permeates every economic aspect of life. The extent to which it does so depends on the emissions intensity of the subject activity – when it’s high, there’s a strong price signal, and when it’s low, there’s a weak signal, leaving users free to decide on other criteria. But the signal is always there. Importantly, the signal can’t be cheated: you can fake your EPA mileage rating – for a while – but it’s hard to evade costs that arrive packaged with your inputs, be they fuel, capital, services or food.

The rules and standards we have, on the other hand, form a rather moth-eaten patchwork. They cover a few of the biggest energy decisions with policies like renewable portfolio standards for electricity. Some of those have been pretty successful at lowering emissions. But others, like CAFE and Energy Star, are deficient or perverse in a variety of ways. As a group, they leave out a number of decisions that are extremely consequential. Effort is by no means uniform – what is the marginal cost of a ton of carbon avoided by CAFE, relative to a state’s renewable energy portfolio? No one knows.

So, how is the patchwork working? Not too well, I’d say. Some, like the CAFE standard, have been diluted by loopholes and stalled due to lack of political will:
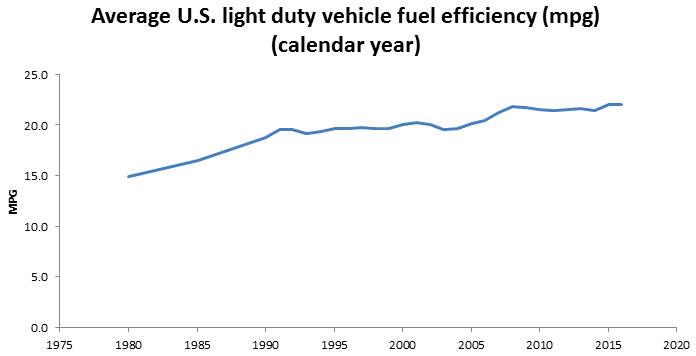
BTS

Others are making some local progress. The California LCFS, for example, has reduced carbon intensity of fuels 3.5% since authorization by AB32 in 2006:
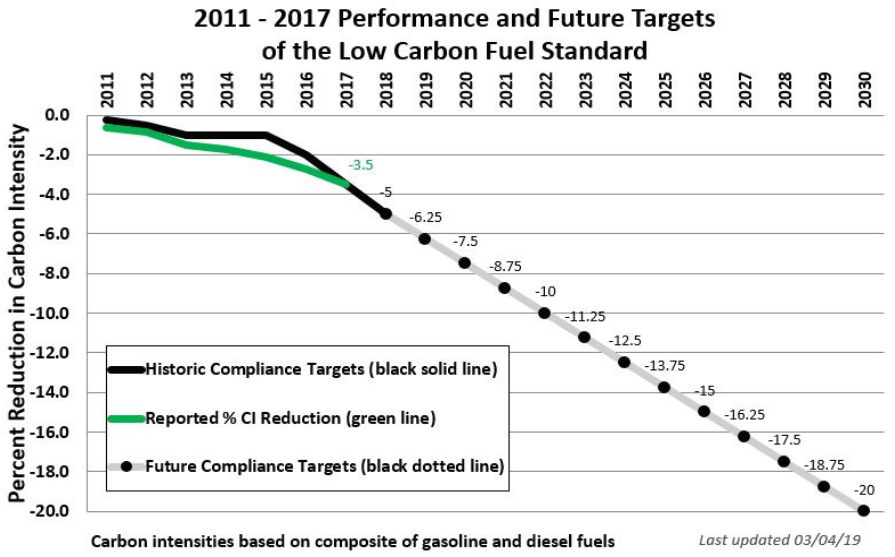
ARB

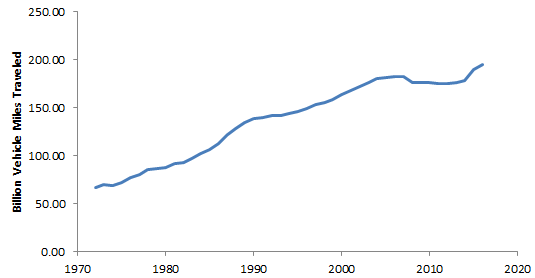
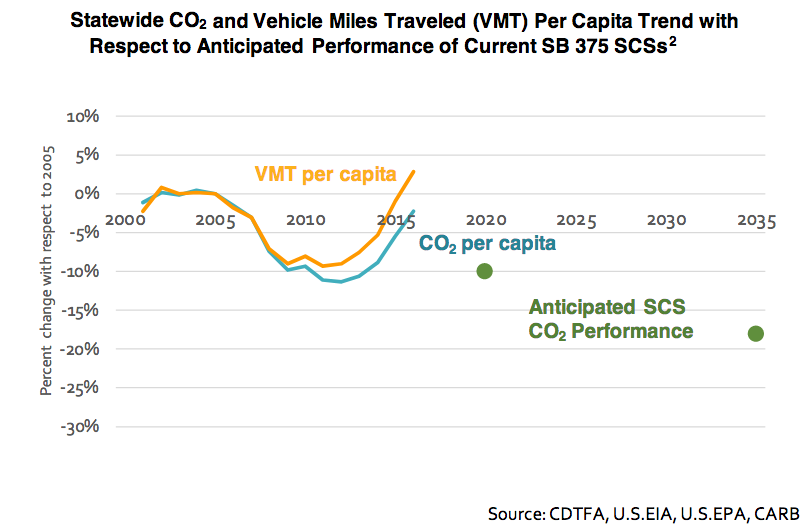
But the LCFS’ progress has been substantially undone by rising vehicle miles traveled (VMT). The only thing that put a real dent in driving was the financial crisis:
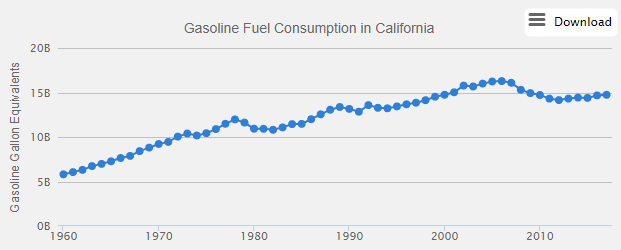
AFDC

Caltrans


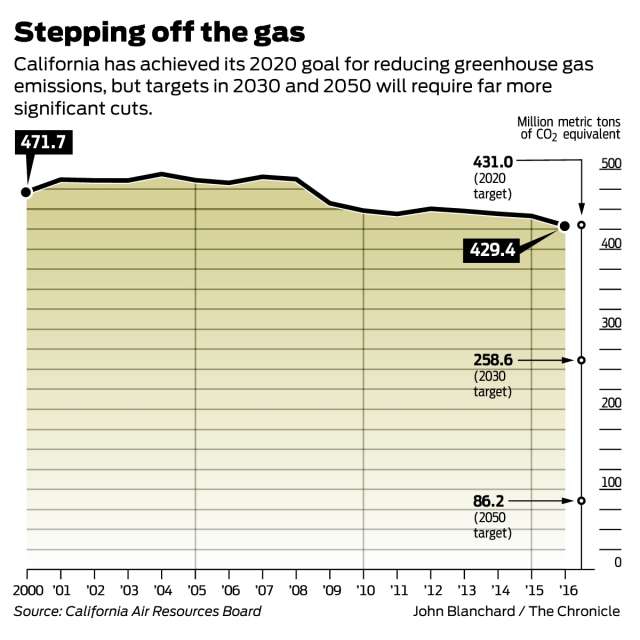
In spite of this, the California patchwork has worked – it has reached its GHG reduction target:
SF Chronicle

This is almost entirely due to success in the electric power sector. Hopefully, there’s more to come, as renewables continue to ride down their learning curves. But how long can the power sector carry the full burden? Not long, I think.

The problem is that the electricity supply side is the “easy” part of the problem. There are relatively few technologies and actors to worry about. There’s a confluence of federal and state incentives. The technology landscape is favorable, with cost-effective emerging technologies.

The technology landscape for clean fuels is not easy. That’s why LCFS credits are trading at $195/ton while electricity cap & trade allowances are at $16/ton. The demand side has more flexibility, but it is technically diverse and organizationally fragmented (like the questions in my table above), making it harder to regulate. Problems are coupled: getting people out of their cars isn’t just a car problem; it’s a land use problem. Rebound effects abound: every LED light bulb is just begging to be left on all the time, because it’s so cheap to do so, and electricity subsidies make it even cheaper.

Command-and-control regulators face an unpleasant choice. They can push harder and harder in a few major areas, widening the performance gap – and the shadow price gap – between regulated and unregulated decisions. Or, they can proliferate regulations to cover more and more things, increasing administrative costs and making innovation harder.

As long as economic incentives scream that the price of carbon is zero, every performance standard, subsidy, or limit is fighting an uphill battle. People want to comply, but evolution selects for those who can figure out how to comply the least. Every idea that’s not covered by a standard faces a deep “valley of death” when it attempts to enter the market.

At present, we can’t let go of this patchwork of standards (wingwalker’s rule – don’t let go of one thing until you have hold of another). But in the long run, we need to start activating every possible tradeoff that improves emissions. That requires a uniform that pervades the economy. Then rules and standards can backfill the remaining market failures, resulting in a system of regulation that’s more effective and less intrusive.

The end of the world is free!

Why should emitting greenhouse gases be free, when it contributes to the destruction of so much we care about?

In the New York Times, David Leonhardt ponders,

The Problem With Putting a Price on the End of the World

Economists have workable policy ideas for addressing
climate change. But what if they’re politically impossible?

I wrote about this exact situation nearly ten years ago, when the Breakthrough Institute (and others) proposed energy R&D as an alternative to politically-infeasible carbon taxes. What has R&D accomplished since then? All kinds of wonderful things, but the implications for climate are … diddly squat.

The emerging climate technology delusion

Leonhardt observes that emissions pricing programs have already failed to win approval several times, which is true. However, I think the diagnosis is partly incorrect. Cap and trade programs like Waxman Markey failed not because they imposed prices, but because they were incredibly complex and involved big property rights giveaways. Anyone who even understands the details of the program is right to wonder if anyone other than traders will profit from it.

In other cases, like the Washington carbon tax initiatives, I think the problem may be that potential backers required that it solve not only climate, but also environmental justice and income inequality more broadly. That’s an impossible task for a single policy.

Leonhardt proposes performance standards and a variety of other economically “second best” measures as alternatives.

The better bet seems to be an “all of the above” approach: Organize a climate movement around meaningful policies with a reasonable chance of near-term success, but don’t abandon the hope of carbon pricing.

At first blush, this seems reasonable to me. Performance standards and information policies have accomplished a lot over the years. Energy R&D is a good investment.

On second thought, these alternatives have already failed. The sum total of all such policies over the last few decades has been to reduce CO2 emissions intensity by 2% per year.

That’s slower than GDP growth, so emissions have actually risen. That’s far short of what we need to accomplish, and it’s not all attributable to policy. Even with twice the political will, and twice the progress, it wouldn’t be nearly enough.

All of the above have some role to play, but without prices as a keystone economic signal, they’re fighting the tide. Moreover, together they have a large cost in administrative complexity, which gives opponents a legitimate reason to whine about bureaucracy and promotes regulatory capture. This makes it hard to innovate and helps large incumbents contribute to worsening inequality.

Adapted from Tax Time

So, I think we need to do a lot more than not “abandon the hope” of carbon pricing. Every time we push a stopgap, second-best policy, we must also be building the basis for implementation of emissions prices. This means we have to get smarter about carbon pricing, and address the cognitive and educational gaps that explain failure so far. Leonhardt identifies one key point:

‘If we’re going to succeed on climate policy, it will be by giving people a vision of what’s in it for them.’

I think that vision has several parts.

  • One is multisolving – recognizing that clever climate policy can improve welfare now as well as in the future through health and equity cobenefits. This is tricky, because a practical policy can’t do everything directly; it just has to be compatible with doing everything.
  • Another is decentralization. The climate-economy system is too big to permit monolithic solution designs. We have to preserve diversity and put signals in place that allow it to evolve in beneficial directions.

Finally, emissions pricing has to be more than a vision – it has to be designed so that it’s actually good for the median voter:

As Nordhaus acknowledged in his speech, curbing dirty energy by raising its price “may be good for nature, but it’s not actually all that attractive to voters to reduce their income.”

Emissions pricing doesn’t have to be harmful to most voters, even neglecting cobenefits, as long as green taxes include equitable rebates, revenue finances good projects, and green sectors have high labor intensity. (The median voter has to understand this as well.)

Personally, I’m frustrated by decades of excuses for ineffective, complicated, inequitable policies. I don’t know how to put it in terms that don’t trigger cognitive dissonance, but I think there’s a question that needs to be asked over and over, until it sinks in:

Why should emitting greenhouse gases be free, when it contributes to the destruction of so much we care about?

Why should emitting greenhouse gases be free, when it contributes to the destruction of so much we care about?

Why should emitting greenhouse gases be free, when it contributes to the destruction of so much we care about?

Why should emitting greenhouse gases be free, when it contributes to the destruction of so much we care about?

Why should emitting greenhouse gases be free, when it contributes to the destruction of so much we care about?