Scientific Revolutions in Ventity

I’ve long wanted to translate the Sterman-Wittenberg model of Kuhnian paradigm revolutions to Ventity. The original was in Dynamo, and I translated that to Vensim, but neither is really satisfactory, because both require provisioning array space for new paradigms statically, before it’s needed. This means simulating lots of useless 0s, and even worse, looking at them in the output.

The model is about the lifecycle of scientific paradigms, so a central feature is the occasional introduction and evolution of new paradigms, which eventually accumulate enough anomalies to erode confidence, making them vulnerable to the next great idea. So ideally, you’d like to introduce new paradigms dynamically and delete them when they no longer have many adherents. Dynamic creation and deletion of entities is of course a core feature of Ventity – it’s the tool this model has been waiting for all those years.

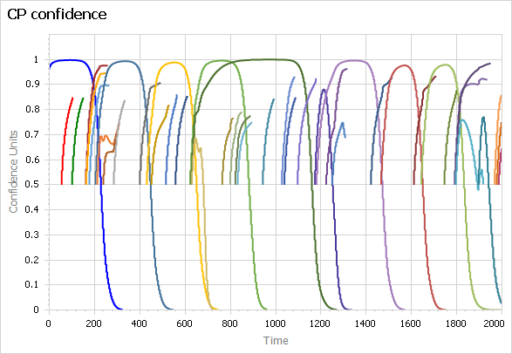
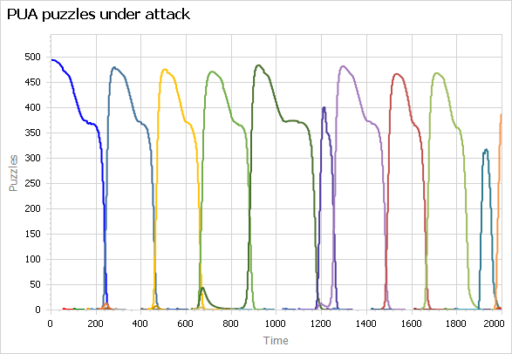
I finally got around to translating my Vensim version to Ventity recently. It works beautifully:

Above, paradigm confidence, showing eight dominant paradigms as well as many smaller paradigms that never rise to dominance. They disappear when they run out of adherents. Below, puzzles under attack for the same paradigms.

Links to the source papers and more notes on the model are in the Vensim library entry. I think the dynamics are generalizable to other aspects of thinking in paradigms, like filter bubbles. The model is also a bit ‘meta’: Ventity as a distinct modeling paradigm that’s neither in the classical array-based world nor the code-based discrete agent world has struggled to win mindshare.

A minor note on use: the Run Config includes two setups: “replicate” and “random”. The “replicate” setup, which is inactive by default, launches paradigms at fixed times given by initialization data from a run of the Vensim version. This makes it possible to compare the simulations without divergence from randomness. However, the randomized run will normally be the more interesting way to work with this model.

The model (requires Ventity, which has a free trial license):

SciRev 15.zip

S-shaped Functions

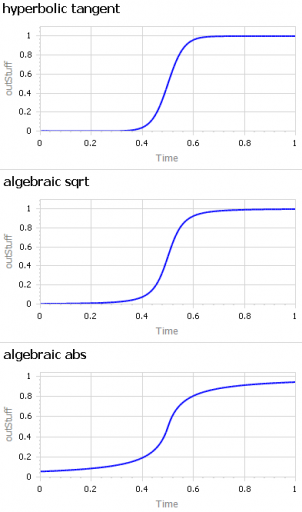
A question about sigmoid functions prompted me to collect a lot of small models that I’ve used over the years.

A sigmoid function is just a function with a characteristic S shape. (OK, you have to use your imagination a bit to get the S.) These tend to arise in two different ways:

  • As a nonlinear response, where increasing the input initially has little effect, then considerable effect, then saturates with little effect. Neurons, and transfer functions in neural networks, behave this way. Advertising is also thought to work like this: too little, and people don’t notice. Too much, and they become immune. Somewhere in the middle, they’re responsive.
  • Dynamically, as the behavior over time of a system with shifting dominance from growth to saturation. Examples include populations approaching carrying capacity and the Bass diffusion model.

Correspondingly, there are (at least) two modeling situations that commonly require the use of some kind of sigmoid function:

  • You want to represent the kind of saturating nonlinear effect described above, with some parameters to control the minimum and maximum values, the slope around the central point, and maybe symmetry features.
  • You want to create a simple scenario generator for some driver of your model that has logistic behavior, but you don’t want to bother with an explicit dynamic structure.

The examples in this model address both needs. They include:

I’m sure there are still a lot of alternatives I omitted. Cubic splines and Bezier curves come to mind. I’d be interested to hear of any others of interest, or just alternative parameterizations of things already here.

The model:

Vensim: sigmoids 1.mdl (works in PLE, Pro, DSS)

Ventity: Sigmoids 1.zip


Misadventures with Little’s Law

I’ve been working on a vehicle fleet model, re-implementing a spreadsheet in Ventity, using dynamic cohorts.

The vehicle lifetime in the spreadsheet is 11 years, and it’s discrete. This means that every vehicle retires precisely 11 years after it’s put into service. This raised a red flag for me, because it represents a rather short vehicle lifetime. I know from work in other jurisdictions that the average life of a vehicle is more like 16-18 years typically (and getting longer as quality improves).

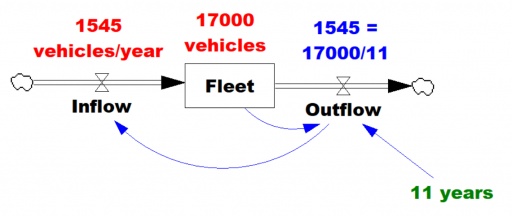
So, where does the 11 year figure come from? We’re not sure. Other published data for the region indicates an average vehicle age of 8.5 years, so it’s not that. A Ventana colleague pointed out that it might be a steady-state estimate from combining vehicle fleet data with new vehicle sales data:


Given the data (red), assume that the vehicle stock is in equilibrium (inflow=outflow). Then it follows from Little’s Law that the average lifetime of vehicles must be 11 years. Little’s Law works regardless of the delay distribution, i.e. regardless of the delay order, but if you were formulating the fleet as a first-order system, that’s precisely how you’d write the outflow equation: outflow = fleet/lifetime, with lifetime=11 years.

… the long-term average number L of customers in a stationary system is equal to the long-term average effective arrival rate λ multiplied by the average time W that a customer spends in the system. – Wikipedia

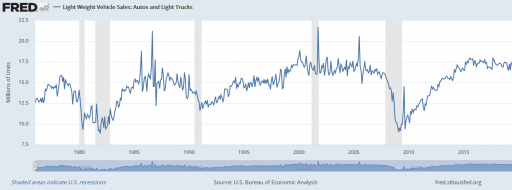
However, there’s a danger here. The system might not be in equilibrium. Then both the assumption of inflow=0utflow and the stationarity required in Little’s Law. Vehicle sales are, unfortunately, rather volatile, particularly around events like the 2008 recession:

It’s tempting to use the average age of vehicles as another data point, but that turns out to be a bad idea. The average age of vehicles is sensitive to both variations in the inflow and the assumed distribution of the discard process. The following Ventity model illustrates this problem, using some of the same machinery as last week’s Erlang model.

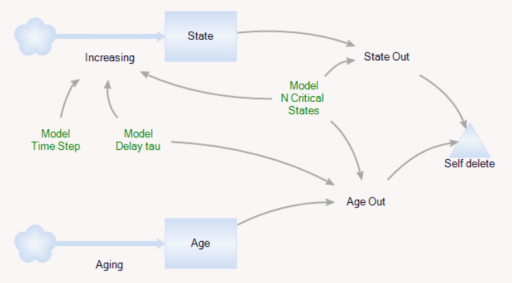
As before, there’s a population of entities (agents). Each has a cascade of N internal states, represented by a stock counter, and an age that increases continuously. An entity deletes itself when it’s too old, or its state count is too high.

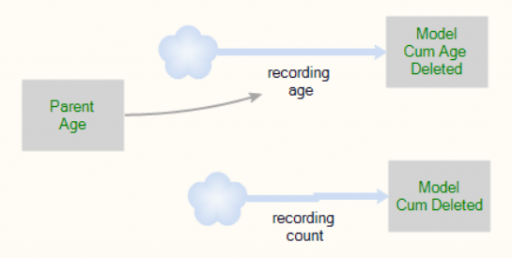
For accounting purposes, when an entity “dies” it records the event by incrementing counter stocks in the Model entity:

In this way, we can keep track of how old the average entity was at the time it deleted itself. This should be the average residence time in Little’s Law. We can also track the average age of existing entities, to see whether it’s the same.

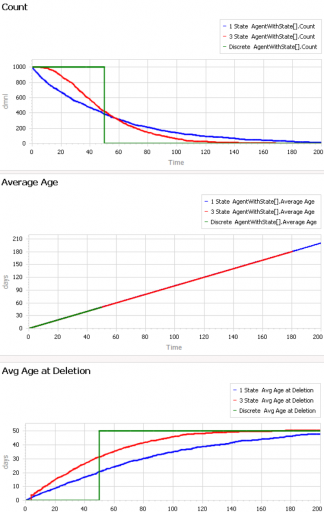
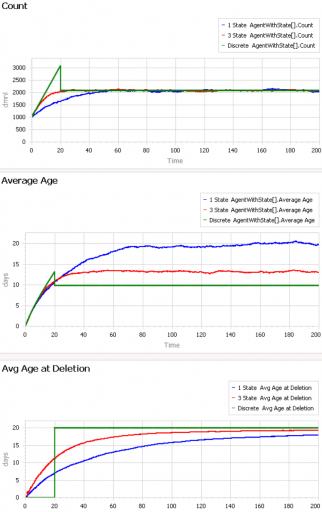
First, consider a very simple, very nonstationary special case, in which there’s no flow of entity turnover. There’s only an initial population of entities of age 0, who gradually leave the system. Here are three variants of that experiment:

Set Model.Delay tau = 50 and Model.Flow Start Time = 1000 to replicate this experiment.

The blue line is the stochastic population analog of the classic first-order delay. The probability of a given entity departing is constant over time, as for radioactive decay. Therefore we get exponential decay, with count = N0*exp(-time/Delay tau). The red line is the third-order equivalent, yielding an Erlang 3 distribution. The green line is the pipeline delay equivalent, in which all entities self-delete at a specified age, rather than with a random distribution. Therefore the population steps from 1000 to 0 at time 50.

The two lower panels compare the average age of surviving entities (middle) to the average age at which entities self-delete (bottom). At bottom, you can see that all variants eventually converge to (roughly) the expected 50-year entity lifespan. However, each trajectory initially indicates a shorter lifespan. This is due to a form of censoring bias – at a given point in time, the longest-lived entities have not yet been observed.

The middle panel indicates how average age can mislead. In this case, age=time for all entities, and therefore the average age increases linearly, even though the expected residence time is constant.

At the opposite extreme, here’s an experiment with a constant flow of new agents, so that the system is in equilibrium after a few time constants:

Set Model.Delay tau = 20 and Model.Flow Start Time = 0 to replicate this experiment.

After the initial transient has died out (by time 20 to 60), all 3 residence times (age at deletion) converge to the expected value of 20. But notice the ages. They converge, too, but the value is dependent on the distribution. For the 1st-order system (blue), the average age does equal the average residence time of 20 years. But the pipeline system (green) has an average age that’s half that, at 10 years. This makes sense, if you think about an equilibrium population composed of a uniform mix of ages between 0 and 20 years. The 3rd-order system is in between.

This uncertain relationship between age and residence time means that we can’t use the average age of the vehicle fleet to determine the rate of vehicle turnover. That’s too bad, because age is the one statistic that’s easy to compute from a database of vehicle registrations. To know more, we have to start making inferences about the inflows and outflows – but that’s tricky if data coverage varies with time. Unfortunately, this is a number that we care about, because the residence time of vehicles in the system is an important driver of future penetration of low-carbon technologies.

The model: AgentAge2.zip

The Delay Sandbox can be used to explore similar phenomena in a continuous, aggregate, deterministic setting.

Aging Chains and the Erlang Distribution

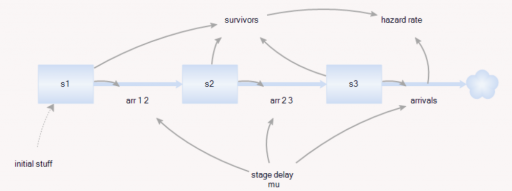
My Delay Sandbox model illustrates the correspondence between Nth-order delays and the Erlang distribution (among other things).

Delay Sandbox

This model provides some similar insights – this time in Ventity. It’s a hybrid of classic continuous SD and agent equivalents.

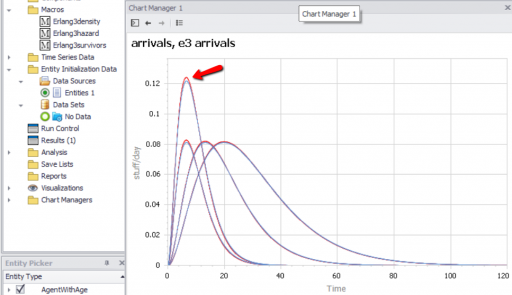
First, the Erlang3 entitytype compares the classic 3rd-order aging chain’s behavior to analytical equivalents, as in the Delay Sandbox. The analytic values are computed in a set of Ventity’s new macros:

Notice that the variances, which arise from Euler integration with a finite time step, are small enough to be uninteresting.

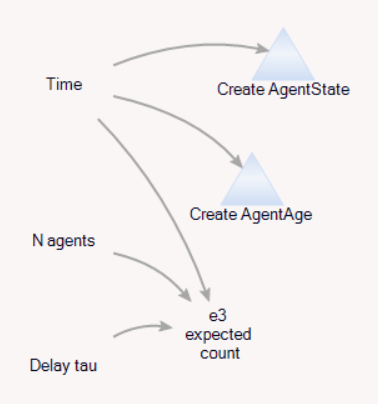
Second, the model compares the dynamics of discrete agent populations to the analytic Erlang results. To do this, the Model entity creates populations of agents at time 0, and (for comparison) computes the expected surviving population according to the Erlang distribution:

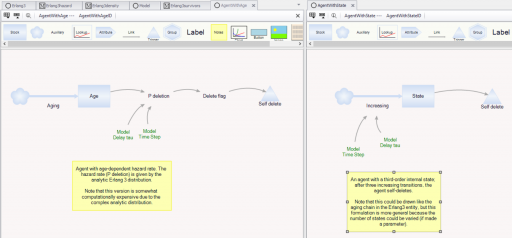
The agents live for a time, then self-delete according to two different strategies:

On the left, an agent tracks its own age, and has an age-specific probability of mortality (again, thanks to the hazard rate of the Erlang distribution). On the right, an agent has a state counter, and mortality occurs when the number of state transitions reaches 3.

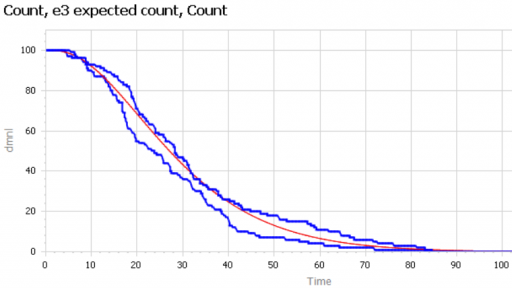
We can then compare the surviving agent populations (blue) to the Erlang expectation (red):

When the population is small (above, 100), there’s some stochastic variation around the expected result. But for larger populations, the difference is negligible.

The model: Erlang3 4 (2).zip

Coupled Catastrophes

I ran across this cool article on network dynamics, and thought the model would be an interesting application for Ventity:

Coupled catastrophes: sudden shifts cascade and hop among interdependent systems

Charles D. Brummitt, George Barnett and Raissa M. D’Souza

Abstract

An important challenge in several disciplines is to understand how sudden changes can propagate among coupled systems. Examples include the synchronization of business cycles, population collapse in patchy ecosystems, markets shifting to a new technology platform, collapses in prices and in confidence in financial markets, and protests erupting in multiple countries. A number of mathematical models of these phenomena have multiple equilibria separated by saddle-node bifurcations. We study this behaviour in its normal form as fast–slow ordinary differential equations. In our model, a system consists of multiple subsystems, such as countries in the global economy or patches of an ecosystem. Each subsystem is described by a scalar quantity, such as economic output or population, that undergoes sudden changes via saddle-node bifurcations. The subsystems are coupled via their scalar quantity (e.g. trade couples economic output; diffusion couples populations); that coupling moves the locations of their bifurcations. The model demonstrates two ways in which sudden changes can propagate: they can cascade (one causing the next), or they can hop over subsystems. The latter is absent from classic models of cascades. For an application, we study the Arab Spring protests. After connecting the model to sociological theories that have bistability, we use socioeconomic data to estimate relative proximities to tipping points and Facebook data to estimate couplings among countries. We find that although protests tend to spread locally, they also seem to ‘hop’ over countries, like in the stylized model; this result highlights a new class of temporal motifs in longitudinal network datasets.

Ventity makes sense here because the system consists of a network of coupled states. Ventity makes it easy to represent a wide variety of network architectures. This means there are two types of entities in the system: “Nodes” and “Couplings.”

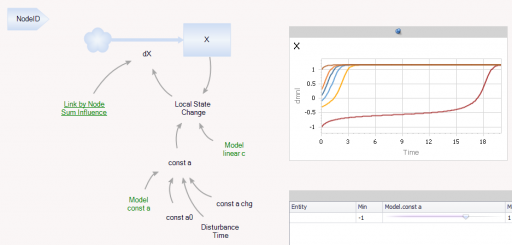
The Node entitytype contains a single state (X), with local feedback, as well as a remote influence from Coupling and a few global parameters referenced from the Model entity:

Continue reading “Coupled Catastrophes”

Towards Principles for Subscripting in Models

For many aspects of models, we have well-accepted rules that define good practice. All physical stocks must have first-order negative feedback on the outflow. Normalize your lookup tables. Thou shalt balance units.

In some areas, the rules haven’t been written down. Subscripts (arrays) are the poor stepchild of dynamic models. They simply didn’t exist when simulation languages emerged, and no one really thinks about them much. They’re treated as a utility, like memory allocation in C, rather than as a key part of the model architecture. I think that needs to change, so this post is attempt to write down some guidance. Consider it a work in progress; I’d be interested in your thoughts.

What’s the Question?

There are really two kinds of questions:

  • How much detail do you want in your model? This is just the age-old problem of aggregation, which I won’t rehash in this post.
  • How do the subscripts you’re using contribute to a transparent, operational description of the system?

It’s the latter I’m concerned with. In essence: how do you implement a given level of detail so that the array structure makes sense? Continue reading “Towards Principles for Subscripting in Models”

Modeling Investigations

538 had this cool visualization of the Russia investigation in the context of Watergate, Whitewater, and other historic investigations.

The original is fun to watch, but I found it hard to understand the time dynamics from the animation. For its maturity (660 days and counting), has the Russia investigation yielded more or fewer indictments than Watergate (1492 days total)? Are the indictments petering out, or accelerating?

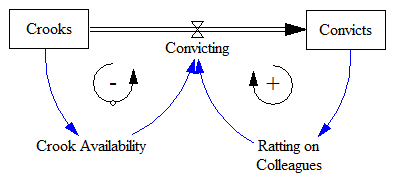
A simplified version of the problem looks a lot like an infection model (a.k.a. logistic growth or Bass diffusion):

So, the interesting question is whether we can – from partway through the history of the system – estimate the ultimate number of indictments and convictions it will yield. This is fraught with danger, especially when you have no independent information about the “physics” of the system, especially the population of potential crooks to be caught. Continue reading “Modeling Investigations”

Dynamic Cohorts

This is the model library entry for my ISDC 2017 plenary paper with Larry Yeager on dynamic cohorts in Ventity:

Dynamic cohorts: a new approach to managing detail

While it is desirable to minimize the complexity of a model, some problems require the detailed representation of heterogeneous subgroups, where nonlinearities prevent aggregation or explicit chronological aging is needed. It is desirable to have a representation that avoids burdening the modeler or user computationally or cognitively. Eberlein & Thompson (2013) propose continuous cohorting, a novel solution to the cohort blending problem in population modeling, and test it against existing aging chain and cohort-shifting approaches. Continuous cohorting prevents blending of ages and other properties, at at some cost in complexity.

We propose another new solution, dynamic cohorts, that prevents blending with a comparatively low computational burden. More importantly, the approach simplifies the representation of distinct age, period and cohort effects and representation of dynamics other than the aging process, like migration and attribute coflows. By encapsulating the lifecycle of a representative cohort in a single entity, rather than dispersing it across many states over time, it makes it easier to develop and explain the model structure.

Paper: Dynamic Cohorts P1363.pdf

Models: Dynamic Cohorts S1363.zip

Presentation slides: Dynamic Cohorts Fid Ventana v2b.pdf

I’ve previously written about this here.

Aging is unnatural

Larry Yeager and I submitted a paper to the SD conference, proposing dynamic cohorts as a new way to model aging populations, vehicle fleets, and other quantities. Cohorts aren’t new*, of course, but Ventity makes it practical to allocate them on demand, so you don’t waste computation and attention on a lot of inactive zeroes.

The traditional alternative has been aging chains. Setting aside technical issues like dispersion, I think there’s a basic conceptual problem with aging chains: they aren’t a natural, intuitive operational representation of what’s happening in a system. Here’s why.

Consider a model of an individual. You’d probably model age like this:

Here, age is a state of the individual that increases with aging. Simple. Equivalently, you could calculate it from the individual’s birth date:

Ideally, a model of a population would preserve the simplicity of the model of the individual. But that’s not what the aging chain does:

This says that, as individuals age, they flow from one stock to another. But there’s no equivalent physical process for that. People don’t flow anywhere on their birthday. Age is continuous, but the separate stocks here represent an arbitrary discretization of age.

Even worse, if there’s mortality, the transition time from age x to age x+1 (the taus on the diagram above) is not precisely one year.

You can contrast this with most categorical attributes of an individual or population:

When cars change (geographic) state, the flow represents an actual, physical movement across a boundary, which seems a lot more intuitive.

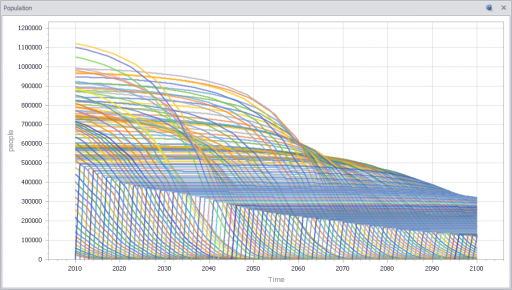
As we’ll show in the forthcoming paper, dynamic cohorts provide a more natural link between models of individuals and groups, and make it easy to see the lifecycle of a set of related entities. Here are the population sizes of annual cohorts for Japan:

I’ll link the paper here when it’s available.


* This was one of the applications we proposed in the original Ventity white paper, and others have arrived at the same idea, minus the dynamic allocation of the cohorts. Demographers have been doing it this way for ages, though usually in statistical approaches with no visual representation of the system.

Dynamics of the last Twinkie

When Hostess went bankrupt in 2012, there was lots of speculation about the fate of the last Twinkie, perhaps languishing on the dusty shelves of a gas station convenience store somewhere in New Mexico. Would that take ten days, ten weeks, ten years?

So, what does this have to do with system dynamics? It calls to mind the problem of modeling the inventory stockout constraint on sales. This problem dates back to Industrial Dynamics (see the variable NIR driving SSR and the discussion around figs. 15-5 and 15-7).

If there’s just one product in one inventory (i.e. one store), and visibility doesn’t matter, the constraint is pretty simple. As long as there’s one item left, sales or shipments can proceed. The constraint then is:

(1) selling = MIN(desired selling, inventory/time step)

In other words, the most that can be sold in one time step is the amount of inventory that’s actually on hand. Generically, the constraint looks like this:
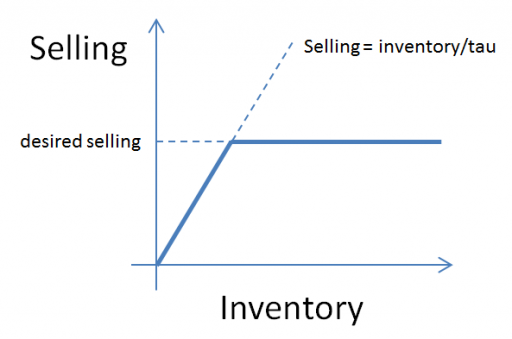
Here, tau is a time constant, that could be equal to time step (DT), as above, or could be generalized to some longer interval reflecting handling and other lags.

This can be further generalized to some kind of continuous function, like:

(2) selling = desired selling * f( inventory )

where f() is often a lookup table. This can be a bit tricky, because you have to ensure that f() goes to zero fast enough to obey the inventory/DT constraint above.

But what if you have lots of products and/or lots of inventory points, perhaps with different normal turnover rates? How does this aggregate? I built the following toy model to find out. You could easily do this in Vensim with arrays, but I found that it was ideally suited to Ventity.

Here’s the setup:

First, there’s a collection of Store entities, each with an inventory. Initial inventory is random, with a Poisson distribution, which ensures integer twinkies. Customer arrivals also have a Poisson distribution, and (optionally), the mean arrival rate varies by store. Selling is constrained to stock on hand via inventory/DT, and is also subject to a visibility effect – shelf stock influences the probability that a customer will buy a twinkie (realized with a Binomial distribution). The visibility effect saturates, so that there are diminishing returns to adding stock, as occurs when new stock goes to the back rows of the shelf, for example.
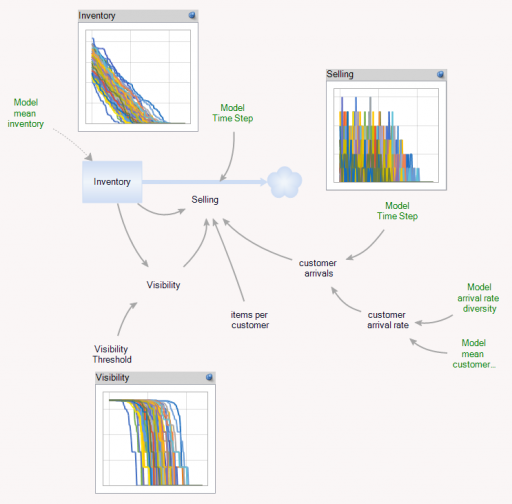
In addition, there’s an Aggregate entitytype, which is very similar to the Store, but deterministic and continuous.
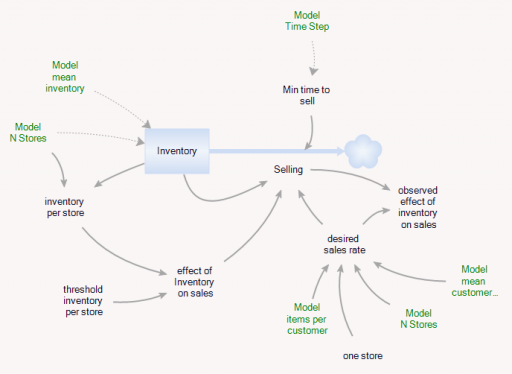
The Aggregate’s initial inventory and sales rates are set to the expected values for individual stores. Two different kinds of constraints on the inventory outflow are available: inventory/tau, and f(inventory). The sales rate simplifies to:

(3) selling = min(desired sales rate*f(inventory),Inventory/Min time to sell)

(4) min time to sell >= time step

In the Store and the Aggregate, the nonlinear effect of inventory on sales (called visibility in the store) is given by

(5) f(inventory) = 1-Exp(-Inventory/Threshold)

However, the aggregate threshold might be different from the individual store threshold (and there’s no compelling reason for the aggregate f() to match the individual f(); it was just a simple way to start).

In the Store[] collection, I calculate aggregates of the individual stores, which look quite continuous, even though the population is only 100. (There are over 100,000 gas stations in the US.)
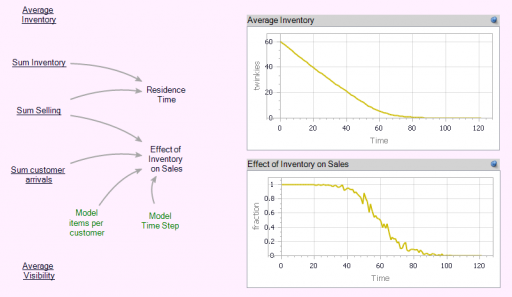
Notice that the time series behavior of the effect of inventory on sales is sigmoid.

Now we can compare individual and aggregate behavior:

Inventory
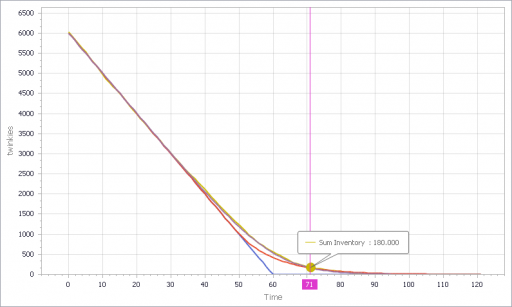
Selling
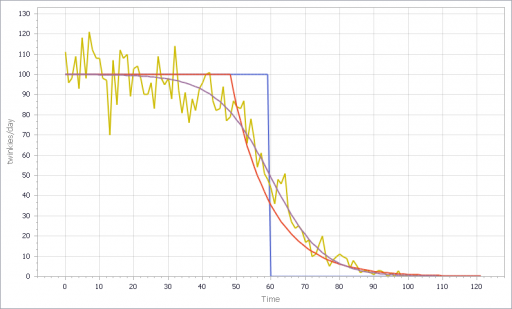
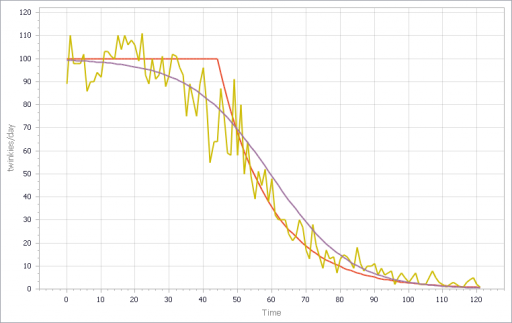
The noisy yellow line is the sum of the individual Stores. The blue line arises from imposing a hard cutoff, equation (1) above. This is like assuming that all stores are equal, and inventory doesn’t affect sales, until it’s gone. Clearly it’s not a great fit, though it might be an adequate shortcut where inventory dynamics are not really the focus of a model.

The red line also imposes an inventory/tau constraint, but the time constant (tau) is much longer than the time step, at 8 days (time step = 1 day). Finally, the purple sigmoid line arises from imposing the nonlinear f(inventory) constraint. It’s quite a good fit, but the threshold for the aggregate must be about twice as big as for the individual Stores.

However, if you parameterize f() poorly, and omit the inventory/tau constraint, you get what appear to be chaotic oscillations – cool, but obviously unphysical:
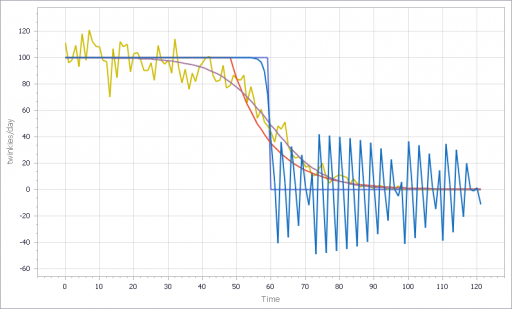
If, in addition, you add diversity in Store’s customer arrival rates, you get a longer tail on inventory. That last Twinkie is likely to be in a low-traffic outlet. This makes it a little tougher to fit all parts of the curve:
I think there are some interesting questions here, that would make a great paper for the SD conference:

  • (Under what conditions) can you derive the functional form of the aggregate constraint from the properties of the individual Stores?
  • When do the deficiencies of shortcut approaches, that may lack smooth derivatives, matter in aggregate models like Industrial dynamics?
  • What are the practical implications for marketing models?
  • What can you infer about inventory levels from aggregate data alone?
  • Is that really chaos?

Have at it!

The Ventity model: LastTwinkie1.zip