The real reason the lights went out in Texas

I think TikTokers have discovered the real reason for the Texas blackouts: the feds stole the power to make snow.

Here’s the math:

The are of Texas is about 695,663 km^2. They only had to cover the settled areas, typically about 1% of land, or about 69 trillion cm^2. A 25mm snowfall over that area (i.e. about an inch), with 10% water content, would require freezing 17 trillion cubic centimeters of water. At 334 Joules per gram, that’s 5800 TeraJoules. If you spread that over a day (86400 seconds), that’s 67.2313 GigaWatts. Scale that up for 3% transmission losses, and you’d need 69.3 GW of generation at plant busbars.

Now, guess what the peak load on the grid was on the night of the 15th, just before the lights went out? 69.2 GW. Coincidence? I think not.

How did this work? Easy. They beamed the power up to the Jewish Space Laser, and used that to induce laser cooling in the atmosphere. This tells us another useful fact: Soros’ laser has almost 70 GW output – more than enough to start lots of fires in California.

And that completes the final piece of the puzzle. Why did the Texas PUC violate free market principles and intervene to raise the price of electricity? They had to, or they would have been fried by 70 GW of space-based Liberal fury.

Now you know the real reason they call leftists “snowflakes.”

Did the Texas PUC stick it to ratepayers?

I’ve been reflecting further on yesterday’s post, in which I noticed that the PUC intervened in ERCOT’s market pricing.

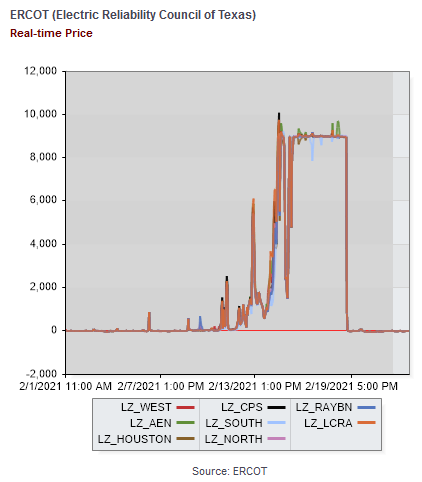
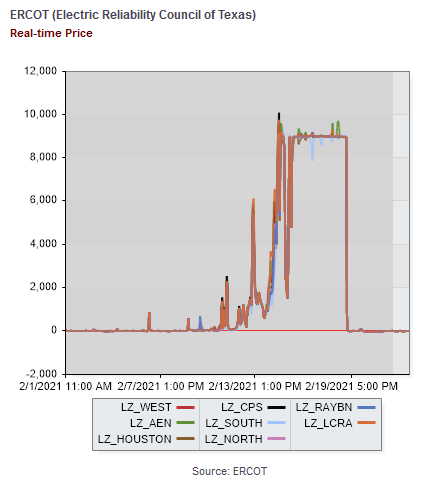
Here’s what happened. Starting around the 12th, prices ran up from their usual $20/MWh ballpark to $1000 typical of peak hours on the 14th, hitting the $9000/MWh market cap overnight on the 14th/15th, then falling midday on the 15th. Then the night of the 15th/16th, prices spiked back up to the cap and stayed there for several days.

ERCOT via energyonline

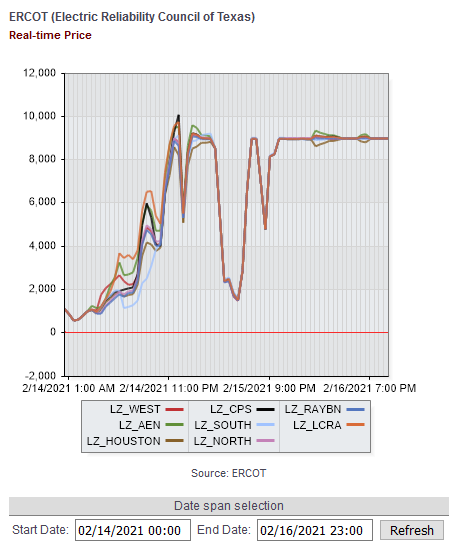
Zooming in,

On the 16th, the PUC issued an order to ERCOT, directing it to set prices at the $9000 level, even retroactively. Evidently they later decided that the retroactive aspect was unwise (and probably illegal) and rescinded that portion of the order.

ERCOT has informed the Commission that energy prices across the system are clearing at less than $9,000, which is the current system-wide offer cap pursuant to 16 TAC §25.505(g)(6)(B). At various times today, energy prices across the system have been as low as approximately $1,200. The Commission believes this outcome is inconsistent with the fundamental design of the ERCOT market. Energy prices should reflect scarcity of the supply. If customer load is being shed, scarcity is at its maximum, and the market price for the energy needed to serve that load should also be at its highest.

Griddy, who’s getting the blame for customers exposed to wholesale prices, argues that the PUC erred:

At Griddy, transparency has always been our goal. We know you are angry and so are we. Pissed, in fact. Here’s what’s been going down:

On Monday evening the Public Utility Commission of Texas (PUCT) cited its “complete authority over ERCOT” to direct that ERCOT set pricing at $9/kWh until the grid could manage the outage situation after being ravaged by the freezing winter storm.

Under ERCOT’s market rules, such a pricing scenario is only enforced when available generation is about to run out (they usually leave a cushion of around 1,000 MW). This is the energy market that Griddy was designed for – one that allows consumers the ability to plan their usage based on the highs and lows of wholesale energy and shift their usage to the cheapest time periods.

However, the PUCT changed the rules on Monday.

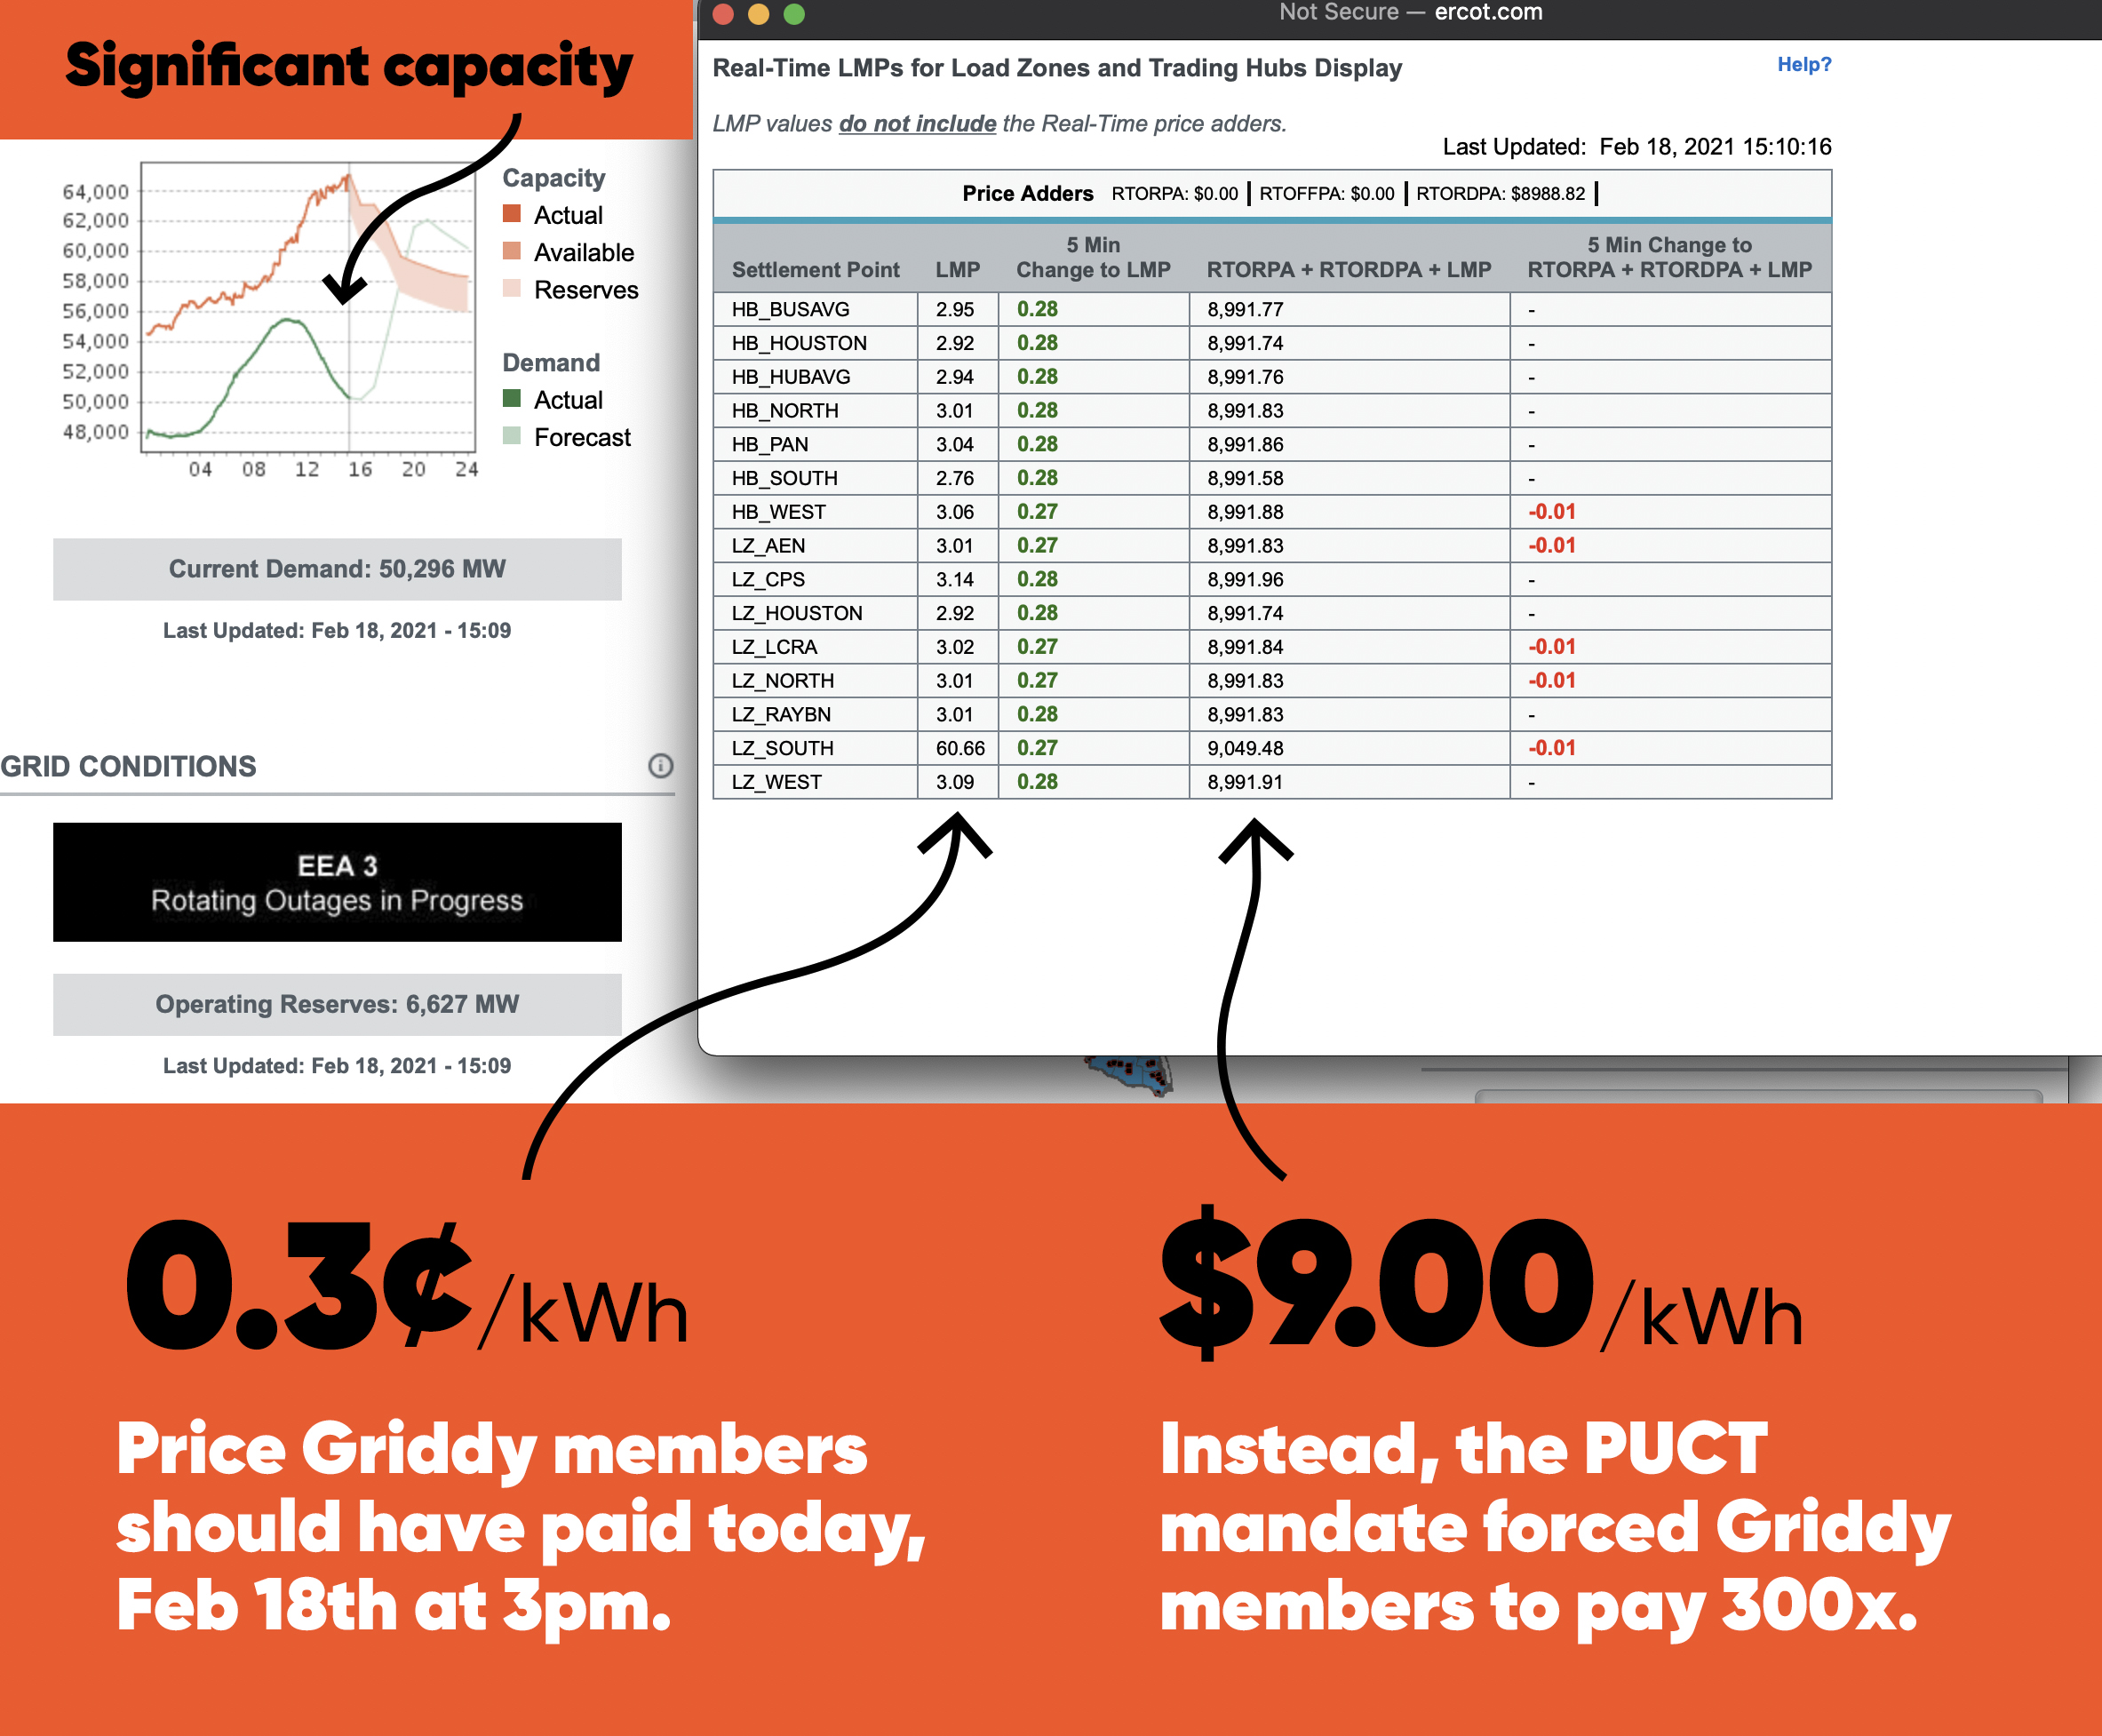
As of today (Thursday), 99% of homes have their power restored and available generation was well above the 1,000 MW cushion. Yet, the PUCT left the directive in place and continued to force prices to $9/kWh, approximately 300x higher than the normal wholesale price. For a home that uses 2,000 kWh per month, prices at $9/kWh work out to over $640 per day in energy charges. By comparison, that same household would typically pay $2 per day.

See (below) the difference between the price set by the market’s supply-and-demand conditions and the price set by the PUCT’s “complete authority over ERCOT.” The PUCT used their authority to ensure a $9/kWh price for generation when the market’s true supply and demand conditions called for far less. Why?

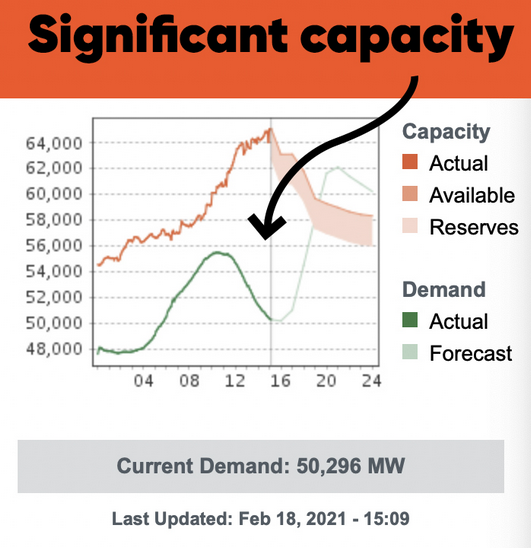
There’s one part of Griddy’s story I can’t make sense of. Their capacity chart shows substantial excess capacity from the 15th forward.

Griddy’s capacity chart – I believe the x-axis is hours on the 18th, not Feb 1-24.

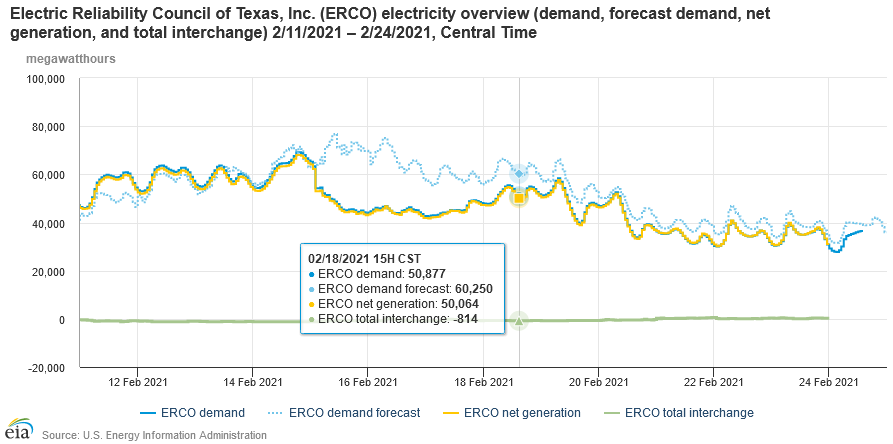
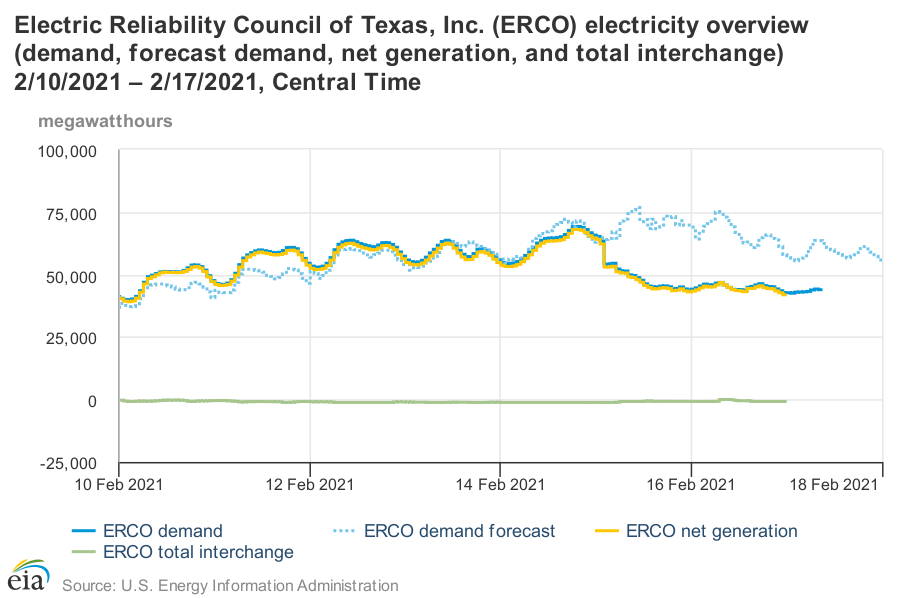
It’s a little hard to square that with generation data showing a gap between forecast conditions and actual generation persisting on the 18th, suggesting ongoing scarcity with a lot more than 1% of load offline.

ERCOT via EIA gridmonitor

This gap is presumably what the PUC relied upon to justify its order. Was it real, or illusory? One might ask, if widespread blackouts or load below projections indicate scarcity, why didn’t the market reflect the value placed on that shed load naturally? Specifically, why didn’t those who needed power simply bid for it? I can imagine a variety of answers. Maybe they couldn’t use it due to other systemic problems. Maybe they didn’t want it at such an outrageous price.

Whatever the answer, the PUC’s intervention was not a neutral act. There are winners and losers from any change in transfer pricing. The winners in this case were presumably generators. The losers were (a) customers exposed to spot prices, and (b) utilities with fixed retail rates but some exposure to spot prices. In the California debacle two decades ago, (b) led to bankruptcies. Losses for customers might be offset by accelerated restoration of power, but it doesn’t seem very plausible that pricing at the cap was a prerequisite for that.

The PUC’s mission is,

We protect customers, foster competition, and promote high quality infrastructure.

I don’t see anything about “protecting generators” and it’s hard to see how fixing prices fosters competition, so I have to agree … the PUC erred. Ironically, it’s ERCOT board members who are resigning, even though ERCOT’s actions were guided by the PUC’s assertion of total authority.

Texas masters and markets

The architect of Texas’ electricity market says it’s working as planned. Critics compare it to late Soviet Russia.

Yahoo – The Week

Who’s right? Both and neither.

I think there’s little debate about what actually happened, though probably much remains to be discovered. But the general features are known: bad weather hit, wind output was unusually low, gas plants and infrastructure failed in droves, and coal and nuclear generation also took a hit. Dependencies may have amplified problems, as for example when electrified gas infrastructure couldn’t deliver gas to power plants due to blackouts. Contingency plans were ready for low wind but not correlated failures of many thermal plants.

The failures led to a spectacular excursion in the market. Normally Texas grid prices are around $20/MWhr (2 cents a kWhr wholesale). Sometimes they’re negative (due to subsidized renewable abundance) and for a few hours a year they spike into the 100s or 1000s:
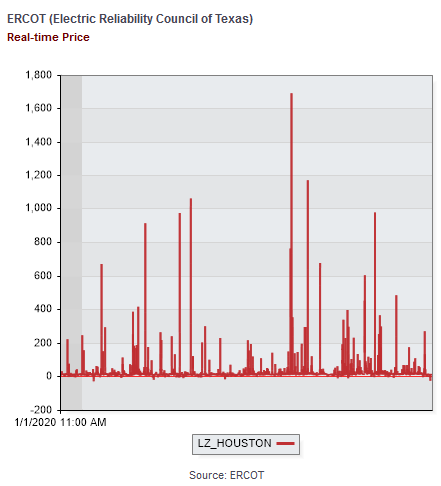
But last week, prices hit the market cap of $9000/MWhr and stayed there for days:
“The year 2011 was a miserable cold snap and there were blackouts,” University of Houston energy fellow Edward Hirs tells the Houston Chronicle. “It happened before and will continue to happen until Texas restructures its electricity market.” Texans “hate it when I say that,” but the Texas grid “has collapsed in exactly the same manner as the old Soviet Union,” or today’s oil sector in Venezuela, he added. “It limped along on underinvestment and neglect until it finally broke under predictable circumstances.”

I think comparisons to the Soviet Union are misplaced. Yes, any large scale collapse is going to have some common features, as positive feedbacks on a network lead to cascades of component failures. But that’s where the similarities end. Invoking the USSR invites thoughts of communism, which is not a feature of the Texas electricity market. It has a central operator out of necessity, but it doesn’t have central planning of investment, and it does have clear property rights, private ownership of capital, a transparent market, and rule of law. Until last week, most participants liked it the way it was.

The architect sees it differently:

William Hogan, the Harvard global energy policy professor who designed the system Texas adopted seven years ago, disagreed, arguing that the state’s energy market has functioned as designed. Higher electricity demand leads to higher prices, forcing consumers to cut back on energy use while encouraging power plants to increase their output of electricity. “It’s not convenient,” Hogan told the Times. “It’s not nice. It’s necessary.”

Essentially, he’s taking a short-term functional view of the market: for the set of inputs given (high demand, low capacity online), it produces exactly the output intended (extremely high prices). You can see the intent in ERCOT’s ORDC offer curve:
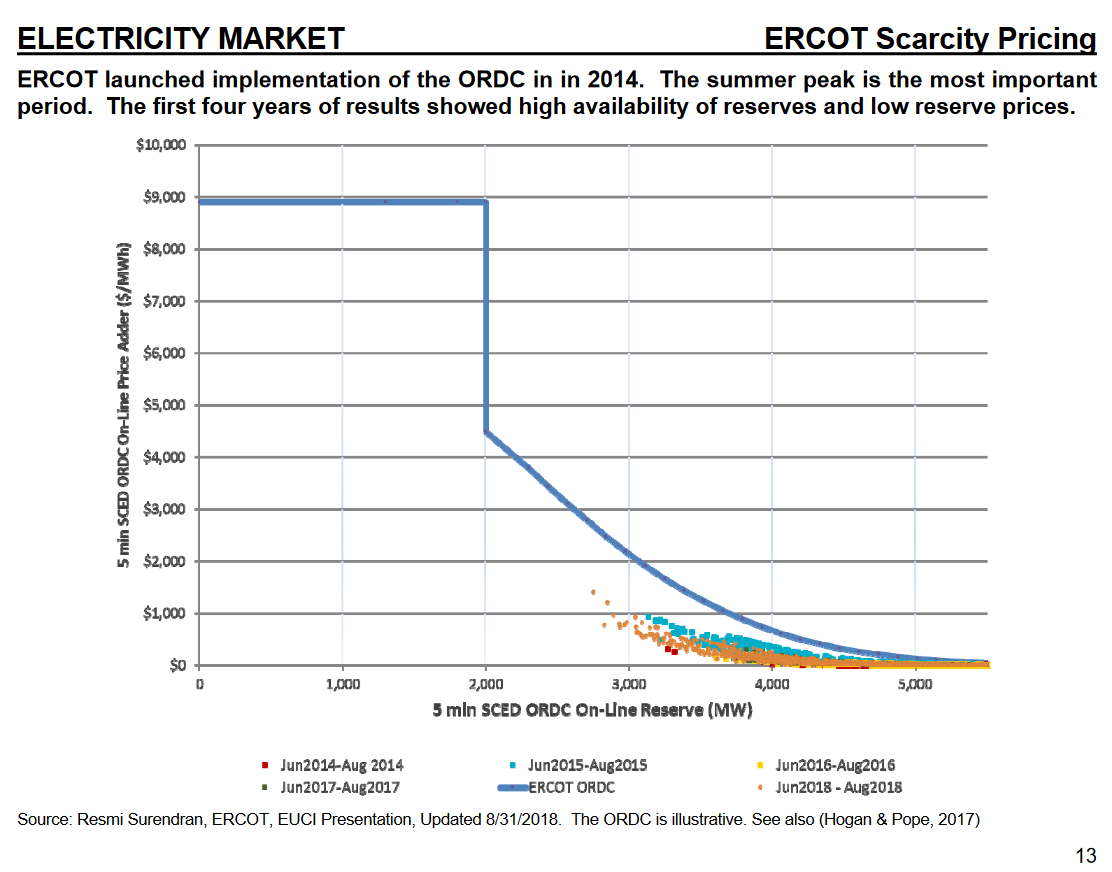
W. Hogan, 2018

(This is a capacity reserve payment, but the same idea applies to regular pricing.)

In a technical sense, Hogan may be right. But I think this takes too narrow a view of the market. I’m reminded of something I heard from Hunter Lovins a long time ago: “markets are good servants, poor masters, and a lousy religion.” We can’t declare victory when the market delivers a designed technical result; we have to decide whether the design served any useful social purpose. If we fail to do that, we are the slaves, with the markets our masters. Looking at things more broadly, it seems like there are some big problems that need to be addressed.

First, it appears that the high prices were not entirely a result of the market clearing process. According to Platt’s, the PUC put its finger on the scale:

The PUC met Feb. 15 to address the pricing issue and decided to order ERCOT to set prices administratively at the $9,000/MWh systemwide offer cap during the emergency.

“At various times today (Feb. 15), energy prices across the system have been as low as approximately $1,200[/MWh],” the order states. “The Commission believes this outcome is inconsistent with the fundamental design of the ERCOT market. Energy prices should reflect scarcity of the supply. If customer load is being shed, scarcity is at its maximum, and the market price for the energy needed to serve that load should also be at its highest.”

The PUC also ordered ERCOT “to correct any past prices such that firm load that is being shed in [Energy Emergency Alert Level 3] is accounted for in ERCOT’s scarcity pricing signals.”

S&P Global/Platt’s

Second, there’s some indication that exposure to the market was extremely harmful to some customers, who now face astronomical power bills. Exposing customers to almost-unlimited losses, in the face of huge information asymmetries between payers and utilities, strikes me as predatory and unethical. You can take a Darwinian view of that, but it’s hardly a Libertarian triumph if PUC intervention in the market transferred a huge amount of money from customers to utilities.

Third, let’s go back to the point of good price signals expressed by Hogan above:

Higher electricity demand leads to higher prices, forcing consumers to cut back on energy use while encouraging power plants to increase their output of electricity. “It’s not convenient,” Hogan told the Times. “It’s not nice. It’s necessary.”

It may have been necessary, but it apparently wasn’t sufficient in the short run, because demand was not curtailed much (except by blackouts), and high prices could not keep capacity online when it failed for technical reasons.

I think the demand side problem is that there’s really very little retail price exposure in the market. The customers of Griddy and other services with spot price exposure apparently didn’t have the tools to observe realtime prices and conserve before their bills went through the roof. Customers with fixed rates may soon find that their utilities are bankrupt, as happened in the California debacle.

Hogan diagrams the situation like this:
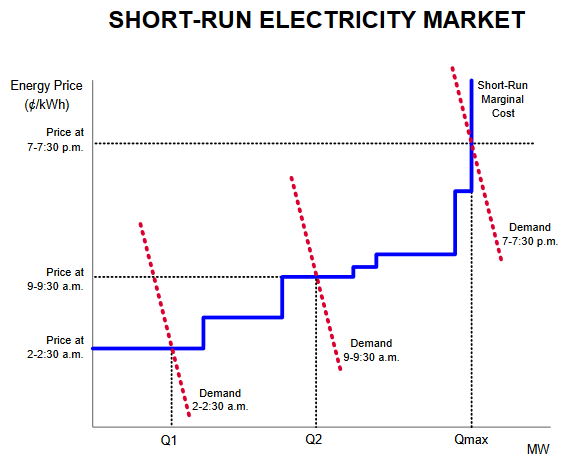
This is just a schematic, but in reality I think there are too many markets where the red demand curves are nearly vertical, because very few customers see realtime prices. That’s very destabilizing.

Strangely, the importance of retail price elasticity has long been known. In their seminal work on Spot Pricing of Electricity, Schweppe, Caramanis, Tabors & Bohn write, right in the introduction:

Five ingredients for a successful marketplace are

  1. A supply side with varying supply costs that increase with demand
  2. A demand side with varying demands which can adapt to price changes
  3. A market mechanism for buying and selling
  4. No monopsonistic behavior on the demand side
  5. No monopolistic behavior on the supply side

I find it puzzling that there isn’t more attention to creation of retail demand response. I suspect the answer may be that utilities don’t want it, because flat rates create cross-subsidies that let them sell more power overall, by spreading costs from high peak users across the entire rate base.

On the supply side, I think the question is whether the expectation that prices could one day go to the $9000/MWhr cap induced suppliers to do anything to provide greater contingency power by investing in peakers or resiliency of their own operations. Certainly any generator who went offline on Feb. 15th due to failure to winterize left a huge amount of money on the table. But it appears that that’s exactly what happened.

Presumably there are some good behavioral reasons for this. No one expected correlated failures across the system, and thus they underestimated the challenge of staying online in the worst conditions. There’s lots of evidence that perception of risk of rare events is problematic. Even a sophisticated investor who understood the prospects would have had a hard time convincing financiers to invest in resilience: imagine walking into a bank, “I’d like a loan for this piece of equipment, which will never be used, until one day in a couple years when it will pay for itself in one go.”

I think legislators and regulators have their work cut out for them. Hopefully they can resist the urge to throw the baby out with the bathwater. It’s wrong to indict communism, capitalism, renewables, or any single actor; this was a systemic failure, and similar events have happened under other regimes, and will happen again. ERCOT has been a pioneering design in many ways, and it would be a shame to revert to a regulated, average-cost-pricing model. The cure for ills like demand inelasticity is more market exposure, not less. The market may require more than a little tinkering around the edges, but catastrophes are rare, so there ought to be time to do that.

The Lies are Bigger in Texas

It may take a while for the full story to be understood, but renewables are far from the sole problem in the Texas power outages.

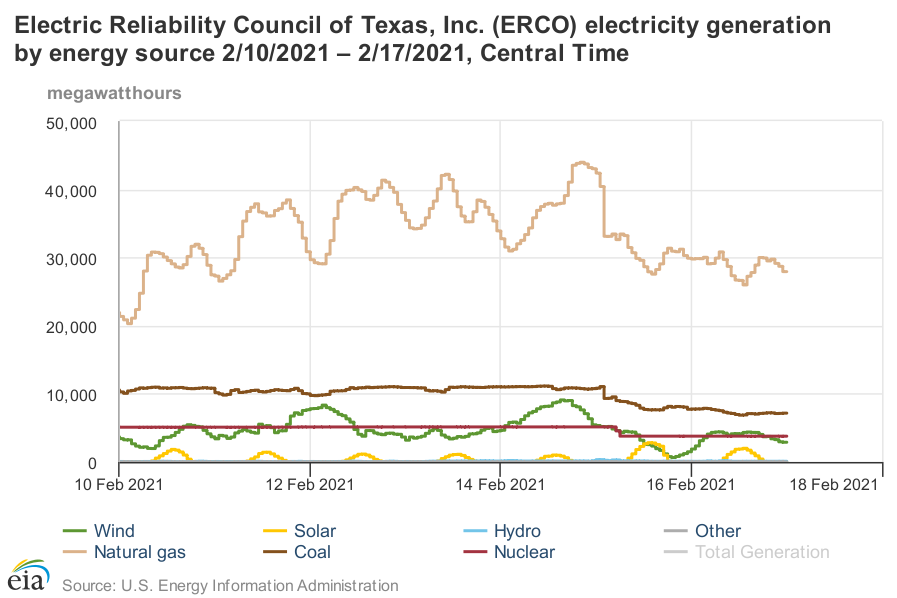
In Texas, the power is out when it’s most needed, and a flurry of finger pointing is following the actual flurries. The politicians seem to have seized on frozen wind turbines as the most photogenic scapegoat, but that’s far from the whole story. It’ll probably take time for the full story to come into focus, but here’s some data:

EIA

Problems really start around midnight on the 15th/16th, and demand remains depressed as of now.

Wind output began dropping the night of the 15th, and gradually fell from a peak of 9GW to about 1GW the next day, before rebounding to a steadier 3-4GW recently. But that’s not the big hit. Gas generation fell 7GW in one hour from 2-3am on the 16th. In total, it dropped from a peak of 44GW to under 28GW. Around the same time, about 3GW of coal went down, along with South Texas Project unit 1, a nuclear plant, taking 1.3GW in one whack. In total, the thermal power losses are much bigger than renewables, even if they went to 0.

The politicians, spearheaded by Gov. Abbott, are launching a witch hunt against the system operator ERCOT. I suspect that they’ll find the problem at their own doorstep.

Some, like Jesse Jenkins, think we have to wait to get the “complete picture” to figure out who is to blame. Jenkins is an associate professor with Princeton University’s Center for Energy & Environment.
“Across the board, from the system operators, to the network operators to the power plant owners, and architects and builders that build their buildings, they all made the decision not to weatherize for this kind of event, and that’s coming back to, to bite us in the end,” Jenkins said.

WFAA

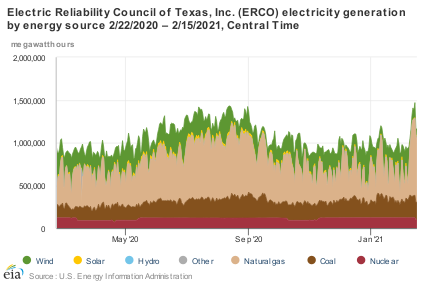
You can get a better perspective by looking at the data over longer horizons:

In the context of a year, you can see how big the demand spike has been. This winter peak exceeds the normal summer peak. You can also see that wind is always volatile – expect the unexpected. Normally, gas, and to some extent, coal plants, are cycling to fill the gaps in the wind.

If you look at ERCOT’s winter risk assessment, they’re pretty close on many things. Their extreme load scenario is 67.2GW. The actual peak hour in the EIA data above is 69.2GW. Low wind was predicted at 1.8GW; reality was less than half that.

ERCOT’s low wind forecast is roughly the level that prevailed for one day in 2020, which is about 2.7 standard deviations out, or about 99.7% reliability. That’s roughly consistent with what Gov. Abbott expressed, that no one should have to go without power for more than a day. Actual wind output was worse than expected, but not by a large margin, so that’s not the story.

On the other hand, thermal power forced outages have been much larger than expected. In the table above, forced outages are expected to be about 10GW at the 95% level. This is a puzzling choice, because it’s inconsistent with the apparent wind reliability level. If you’re targeting one bad day over December/January/February, you should be planning for the 99% outage rate. In that case, the plan should have targeted >12GW of forced outages. But that’s still not the whole story – the real losses were bigger, maybe 5 standard deviations, not 3 or 2.

I think the real problem may be failure to anticipate the covariance of extremes. In Texas, there have been correlated failures of power plants due to shared natural gas infrastructure and shared design features like outdoor turbines.

Similarly, while wind speeds are positively correlated with winter heat load, it’s still a noisy process, and the same kind of conditions that bring extreme cold can stall wind speeds. This isn’t just random, it’s expected, and familiar because it happened in the 2018 Polar Vortex.

In any domain, a risk plan that treats correlated events as independent is prone to failure. This was the killer in the runup to the 2008 financial crisis: rating agencies treated securitized mortgages like packages of independent assets, failing to anticipate correlated returns across the entire real estate asset class. Coupling is one of the key features of industrial catastrophes described in Perrow’s Normal Accidents.

Rating agencies were clearly motivated by greed. ERCOT’s motivations are not clear to me, but ultimately, the Texas legislature decides the operating rules for ERCOT. If the rules favor cheap power and limit ERCOT’s ability to fund reliability investments, then you get a system that isn’t robust to extreme events like this.

CAFE and Policy Resistance

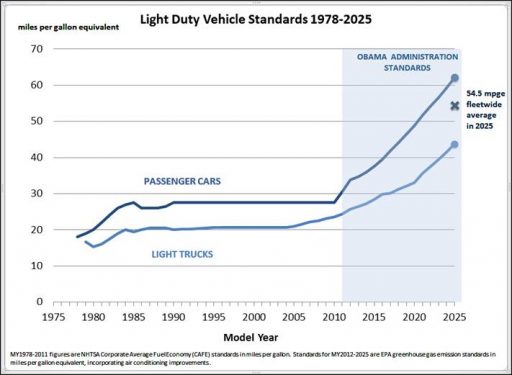
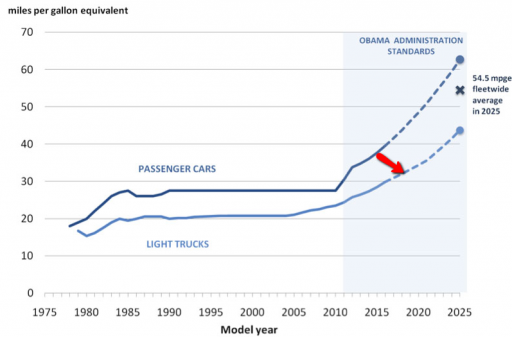
In 2011, the White House announced big increases in CAFE fuel economy standards.

The result has been counterintuitive. But before looking at the outcome, let me correct a misconception. The chart above refers to the “fleetwide average” – but this is the new vehicle fleetwide average, not the average of vehicles on the road. Of course it is the latter that matters for CO2 emissions and other outcomes. The on-the-road average lags the standards by a long time, because the fleet turns over slowly, due to the long lifetime of vehicles. It’s worse than that, because actual performance lags the standards due to loopholes and measurement issues. The EPA puts the 2017 model year here:

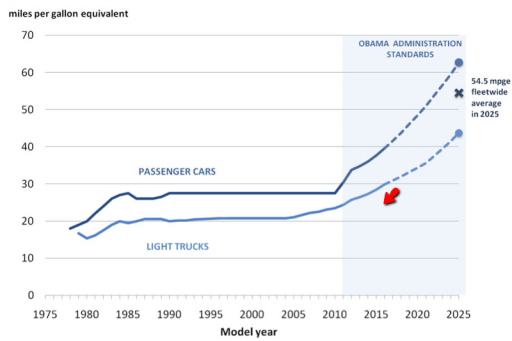
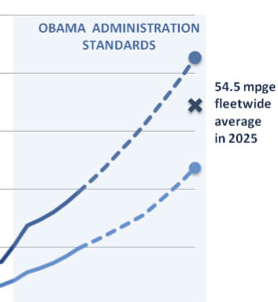
But wait … it’s still worse than that. Notice that the future fleetwide average is closer to the car standard than to the truck standard:

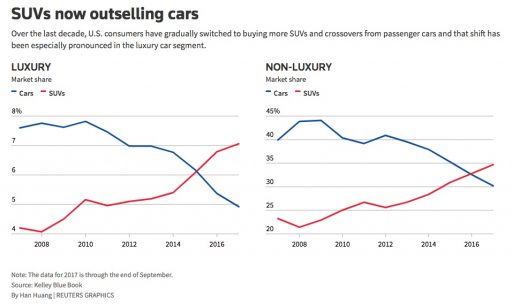
That implies that the market share of cars is more than 50%. But look what’s been happening:

The market share of cars is collapsing. (If you look at longer series, it looks like the continuation of a long slide.) Presumably this is because, faced with consumer appetites guided by cheap gas and a standards gap between cars and trucks, automakers are doing the rational thing: they’re dumping their cars fleets and switching to trucks and SUVs. In other words, they’re moving from the upper curve to the less-constrained lower curve:

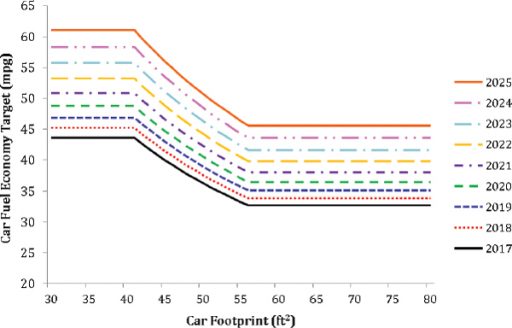
It’s actually worse than that, because within each vehicle class, EPA uses a footprint methodology that essentially assigns greater emissions property rights to larger vehicles.

So, while the CAFE standards seemingly require higher performance, they simultaneously incentivize behavioral responses that offset much of the improvement. The NRC actually wondered if this would happen when it evaluated CAFE about 5 years ago.

Three outcomes related to the size of vehicles in the fleet are possible due to the regulations: Manufacturers could change the size of individual vehicles, they could change the mix of vehicle sizes in their portfolio (i.e., more large cars relative to small cars), or they could change the mix of cars and light trucks.

I think it’s safe to say that yes, we’re seeing exactly these effects in the US fleet. That makes aggregate progress on emissions rather glacial. Transportation emissions are currently rising, interrupted only by the financial crisis. That’s because we’re not working all the needed leverage points in the system. We have one rule (CAFE) and technology (EVs) but we’re not doing anything about prices (carbon tax) or preferences (e.g., walkable cities). We need a more comprehensive approach if we’re going to beat the unintended consequences.

Rise of the Watt Guzzler

Overconsumption isn’t green.

Tesla’s strategy of building electric cars that are simply better than conventional cars has worked brilliantly. They harnessed lust for raw power in service of greener tech (with the help of public subsidies – the other kind of green involved).

That was great, but now it’s time to grow up. Not directly emitting CO2 just isn’t good enough. If personal vehicle transport continues to grow exponentially, it will just run into other limits, especially because renewable electricity is not entirely benign.

The trucks on the horizon are perfect examples. The Cybertruck consumes nearly twice the energy per mile of a Model 3 (and presumably still more if heavily loaded, which is kind of the point of a truck). That power is cheap, so anyone who can afford the capital cost can afford the juice, but if it’s to be renewable, it’s consuming scarce power that could be put to greener purposes than stroking drivers’ egos. It’s also consuming more parking and road space and putting more rubber into waters.

When you consider in addition the effects of driving automation on demand, you get a perfect storm of increased depletion, pollution, congestion and other side effects.

The EV transition isn’t all bad – it’s a big climate mitigation enabler. But I think we could find wiser ways to apply technology and public money that don’t simply move the externalities to other areas.

Challenges Sourcing Parameters for Dynamic Models

A colleague recently pointed me to this survey:

Estimating the price elasticity of fuel demand with stated preferences derived from a situational approach

It starts with a review of a variety of studies:

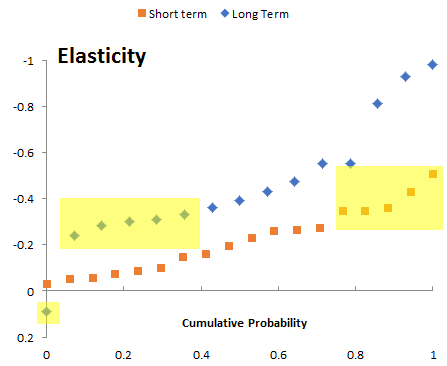
Table 1. Price elasticities of fuel demand reported in the literature, by average year of observation.

This is similar to other meta-analyses and surveys I’ve seen in the past. That means using it directly is potentially problematic. In a model, you’d typically plug the elasticity into something like the following:

Indicated fuel demand 
   = reference fuel demand * (price/reference price) ^ elasticity

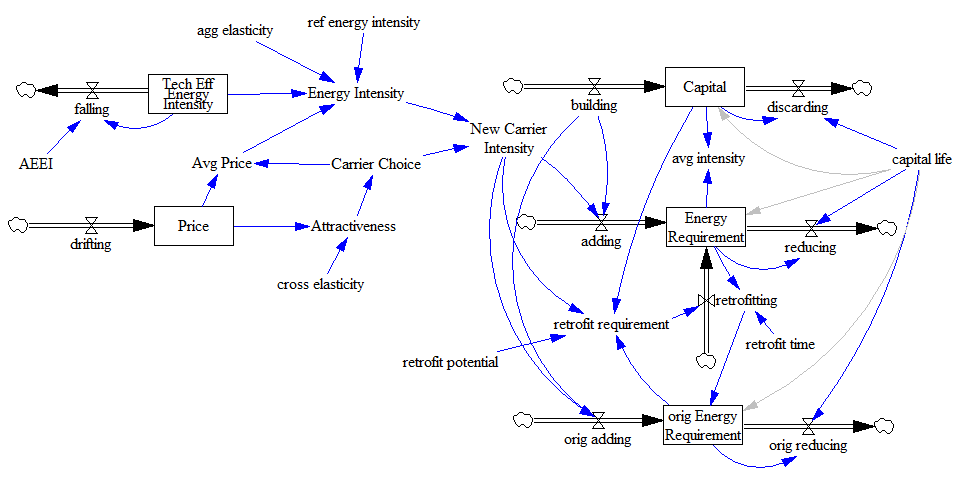
You’d probably have the expression above embedded in a larger structure, with energy requirements embodied in the capital stock, and various market-clearing feedback loops (as below). The problem is that plugging the elasticities from the literature into a dynamic model involves several treacherous leaps.

First, do the parameter values even make sense? Notice in the results above that 33% of the long term estimates have magnitude < .3, overlapping the top 25% of the short term estimates. That’s a big red flag. Do they have conflicting definitions of “short” and “long”? Are there systematic methods problems?

Second, are they robust as you plan to use them? Many of the short term estimates have magnitude <<.1, meaning that a modest supply shock would cause fuel expenditures to exceed GDP. This is primarily problem with the equation above (but that’s likely similar to what was estimated). A better formulation would consider non-constant elasticity, but most likely the data is not informative about the extremes. One of the long term estimates is even positive – I’d be interested to see the rationale for that. Perhaps fuel is a luxury good?

Third, are the parameters any good? My guess is that some of these estimates are simply violating good practice for estimating dynamic systems. The real long term response involves a lot of lags on varying time scales, from annual (perceptions of prices and behavior change) to decadal (fleet turnover, moving, mode-switching) to longer (infrastructure and urban development). Almost certainly some of this is ignored in the estimate, meaning that the true magnitude of the long term response is understated.

Stated preference estimates avoid some problems, but create others. In the short run, people have a good sense of their options and responses. But in the long term, likely not: you’re essentially asking them to mentally simulate a complex system, evaluating options that may not even exist at present. Expert judgments are subject to some of the same limitations.

I think this explains why it’s possible to build a model that’s backed up with a lot of expertise and literature at every equation, that fails to reproduce the aggregate behavior of the system. Until you’ve spend time integrating components, reconciling conflicting definitions across domains, and revisiting open-loop estimates in a closed-loop context, you don’t have an internally consistent story. Getting to that is a big part of the value of dynamic modeling.

The Tesla roof is a luxury product

No one buys a Tesla Model S because it’s cheaper than a regular car. But there’s currently a flurry of breathless tweets, rejoicing that a Tesla roof is cheaper than a regular roof. That’s dubious.

When I see $21.85 per square foot for anything associated with a house, “cheap” is not what comes to mind. That’s in the territory for luxury interior surfaces, not bulk materials like roofing. I’m reminded of the old saw in energy economics (I think from the EMF meetings in Aspen) that above 7000 feet, the concept of discount rates evaporates.

So, what are the numbers, really?

Continue reading “The Tesla roof is a luxury product”

ICE Roadkill

Several countries have now announced eventual bans of internal combustion engines. It’s nice that such a thing can now be contemplated, but this strikes me as a fundamentally flawed approach.

Banning a whole technology class outright is inefficient. When push comes to shove, that inefficiency is likely to lead to an implementation that’s complex and laden with exceptions. Bans and standards are better than nothing, but that regulatory complexity gives opponents something real to whine about. Then the loonies come out. At any plausible corporate cost of capital, a ban in 2040 has near-zero economic weight today.

Rather than banning gas and diesel vehicles at some abstract date in the far future, we should be pricing their externalities now. Air and water pollution, noise, resource extraction, the opportunity cost of space for roads and parking, and a dozen other free rides are good candidates. And, electric vehicles should not be immune to the same charges where applicable.

Once the basic price signal points the transportation market in the right direction, we can see what happens, and tinker around the edges with standards that address particular misperceptions and market failures.

Structure First!

One of the central tenets of system dynamics and systems thinking is that structure causes behavior. This is often described as an iceberg, with events at as the visible tip, and structure as greater submerged bulk. Patterns of behavior, in the middle, are sequences of events that may signal the existence of the underlying structure.

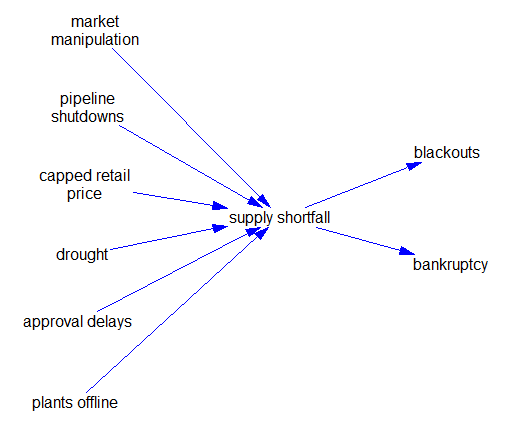
The header of the current Wikipedia article on the California electricity crisis is a nice illustration of the difference between event and structural descriptions of a problem.

The California electricity crisis, also known as the Western U.S. Energy Crisis of 2000 and 2001, was a situation in which the United States state of California had a shortage of electricity supply caused by market manipulations, illegal[5] shutdowns of pipelines by the Texas energy consortium Enron, and capped retail electricity prices.[6] The state suffered from multiple large-scale blackouts, one of the state’s largest energy companies collapsed, and the economic fall-out greatly harmed GovernorGray Davis’ standing.

Drought, delays in approval of new power plants,[6]:109 and market manipulation decreased supply.[citation needed] This caused an 800% increase in wholesale prices from April 2000 to December 2000.[7]:1 In addition, rolling blackouts adversely affected many businesses dependent upon a reliable supply of electricity, and inconvenienced a large number of retail consumers.

California had an installed generating capacity of 45GW. At the time of the blackouts, demand was 28GW. A demand supply gap was created by energy companies, mainly Enron, to create an artificial shortage. Energy traders took power plants offline for maintenance in days of peak demand to increase the price.[8][9] Traders were thus able to sell power at premium prices, sometimes up to a factor of 20 times its normal value. Because the state government had a cap on retail electricity charges, this market manipulation squeezed the industry’s revenue margins, causing the bankruptcy of Pacific Gas and Electric Company (PG&E) and near bankruptcy of Southern California Edison in early 2001.[7]:2-3

The financial crisis was possible because of partial deregulation legislation instituted in 1996 by the California Legislature (AB 1890) and Governor Pete Wilson. Enron took advantage of this deregulation and was involved in economic withholding and inflated price bidding in California’s spot markets.[10]

The crisis cost between $40 to $45 billion.[7]:3-4

This is mostly a dead buffalo description of the event:

ca_elec_dead_buffalo

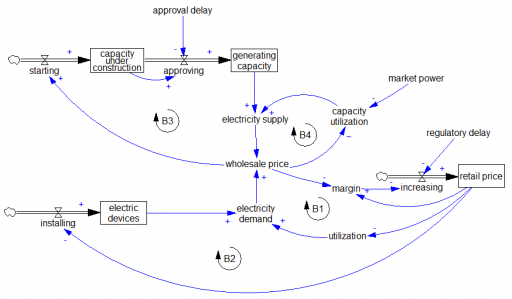
It offers only a few hints about the structure that enabled these events to unfold. It would be nice if the article provided a more operational description of the problem up front. (It does eventually get there.) Here’s a stab at it:

ca_elec_structure

A normal market manages supply and demand through four balancing loops. On the demand side, in the short run utilization of electricity-consuming devices falls with increasing price (B1). In the long run, higher prices also suppress installation of new devices (B2). In parallel on the supply side, higher prices increase utilization in the short run (B4) and provide an incentive for capacity investment in the long run (B3).

The California crisis happened because these market-clearing mechanisms were not functioning. Retail pricing is subject to long regulatory approval lags, so there was effectively no demand price elasticity response in the short run, i.e. B1 and B2 were ineffective. The system might still function if it had surplus capacity, but evidently long approval delays prevented B3 from creating that. Even worse, the normal operation of B4 was inverted when Enron amassed sufficient market power. That inverted the normal competitive market incentive to increase capacity utilization when prices are high. Instead, Enron could deliberately lower utilization to extract monopoly prices. If any of B1-B3 had been functioning, Enron’s ability to exploit B4 would have been greatly diminished, and the crisis might not have occurred.

I find it astonishing that deregulation created such a dysfunctional market. The framework for electricity markets was laid out by Caramanis, Schweppe, Tabor & Bohn – they literally wrote the book on Spot Pricing of Electricity. Right in the introduction, page 5, it cautions:

Five ingredients for a successful marketplace are

  1. A supply side with varying supply costs that increase with demand
  2. A demand side with varying demands which can adapt to price changes
  3. A market mechanism for buying and selling
  4. No monopsonistic behavior on the demand side
  5. No monopolistic behavior on the supply side

I guess the market designers thought these were optional?