Go ahead, shut down the EPA

Companies self-regulate just fine, without any rule of law, like they do in Nigeria:

Some of the results are “horrifying” and “unprecedented,” Brown says. The wells serving at least 10 Ogoni communities, for instance, have unsafe levels of hydrocarbons; one well had levels of benzene, a known carcinogen, that were 900 times greater than those deemed safe by the World Health Organization. In some areas, the researchers measured 8 centimeters of oil floating on top of groundwater and oil-soaked soils 5 meters deep. “Areas which appear unaffected at the surface are in reality severely contaminated underground,” the report concluded. In one bit of good news, the researchers concluded that spilled oil had not tainted local fish, a major source of protein, although it had ruined numerous fish farms.

Thinking about stuff

A while back I decided to never buy another garden plant unless I’d first dug the hole for it. In a single stroke, this simple rule eliminated impulse shopping at the nursery, improved the survival rate of new plants, and increased overall garden productivity.

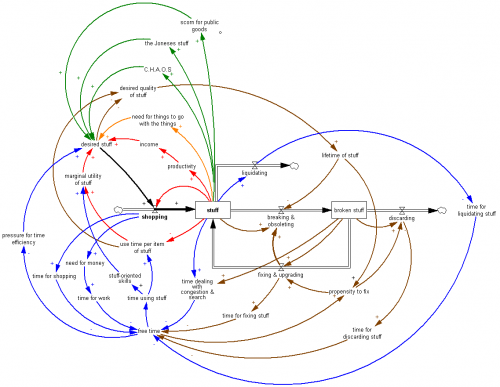
This got me thinking about the insidious dynamics of stuff, by which tools come to rule their masters. I’ve distilled most of my thinking into this picture:


Click to enlarge.

This is mainly a visual post, but here’s a quick guide to some of the loops:

Black: stuff is the accumulation of shopping, less outflows from discarding and liquidation.

Red: Shopping adjusts the stock of stuff to a goal. The goal is set by income (a positive feedback, to the extent that stuff makes you more productive, so you can afford more stuff) and by the utility of stuff at the margin, which falls as you have less and less time to use each item of stuff, or acquire increasingly useless items.

So far, Economics 101 would tell a nice story of smooth adjustment of the shopping process to an equilibrium at the optimal stuff level. That’s defeated by the complexity of all of the other dynamics, which create a variety of possible vicious cycles and misperceptions of feedback that result in suboptimal stuffing.

Orange: You need stuff to go with the stuff. The iPad needs a dock, etc. Even if the stuff is truly simple, you need somewhere to put it.

Green: Society reinforces the need for stuff, via keep-up-with-the-Joneses and neglect of shared stuff. When you have too much stuff, C.H.A.O.S. ensues – “can’t have anyone over syndrome” – which reinforces the desire for stuff to hide the chaos or facilitate fun without social contact.

Blue: Stuff takes time, in a variety of ways. The more stuff  you have, the less time you actually have for using stuff for fun. This can actually increase your desire for stuff, due to the desire to have fun more efficiently in the limited time available.

Brown: Pressure for time and more stuff triggers a bunch of loops involving quality of stuff. One response is to buy low-quality stuff, which soon increases the stock of broken stuff lying about, worsening time pressure. One response is the descent into disposability, which saves the time, at the expense of a high throughput (shopping->discarding) relative to the stock of stuff. Once you’re fully stocked with low-quality stuff, why bother fixing it when it breaks? Fixing one thing often results in collateral damage to another (computers are notorious for this).

I’m far from a successful minimalist yet, but here’s what’s working for me to various degrees:

  • The old advice, “Use it up, wear it out, make it do or do without” works.
  • Don’t buy stuff when you can rent it. Unfortunately rental markets aren’t very liquid so this can be tough.
  • Allocate time to liquidating stuff. This eats up free time in the short run, but it’s a worse-before-better dynamic, so there’s a payoff in the long run. Fortunately liquidating stuff has a learning curve – it gets easier.
  • Make underutilized and broken stuff salient, by keeping lists and eliminating concealing storage.
  • Change your shopping policy to forbid acquisition of new stuff until existing stuff has been dealt with.
  • Buy higher quality than you think you’ll need.
  • Learn low-stuff skills.
  • Require steady state stuff: no shopping for new things until something old goes to make way for it.
  • Do things, even when you don’t have the perfect gear.
  • Explicitly prioritize stuff acquisition.
  • Tax yourself, or at least mentally double the price of any proposed acquisition, to account for all the side effects that you’ll discover later.
  • Get relatives to give $ to your favorite nonprofit rather than giving you something you won’t use.

There are also some policies that address the social dimensions of stuff:

  • Underdress and underequip. Occasionally this results in your own discomfort, but reverses the social arms race.
  • Don’t reward other peoples’ shopping by drooling over their stuff. Pity them.
  • Use and promote shared stuff, like parks.

This system has a lot of positive feedback, so once you get the loops running the right way, improvement really takes off.

Downgrade causality confusion

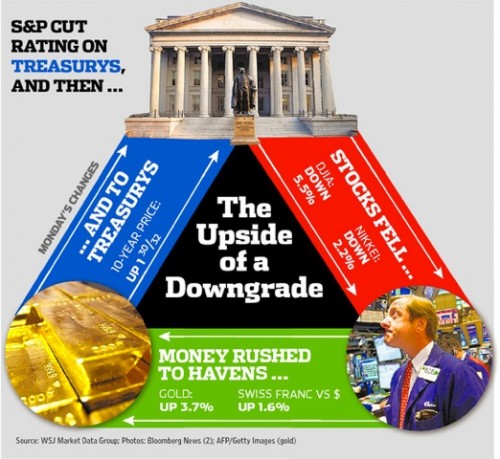
A sort of causal loop diagram made the cover of the WSJ today:

Source: WSJ h/t Drew Jone

Is it useful, or chartjunk? When I started to look at it from the perspective of good SD diagramming practice, I realized that it’s the latter.

First off, this isn’t really a structural diagram at all. It depicts a sequence of events mixed up with icons depicting some entities involved in those events. From the chain of events, one might infer that there is causality, but that would be hazardous, particularly in this case where there is no operational description of what’s happening. Did money rush to havens because stocks fell, or did stocks fall because money was rushing to havens? How could we tell, without articulating the mechanics of stocks and flows of money in price formation?

A good diagram ought to include quantifiable elements that can vary, with clear directionality. Traders and bars of gold are clearly not helpful variables. Nor are events particularly useful; mental accounting for a “decrease in Stocks Fell” is difficult, for example.

A good diagram should also distinguish key states that describe a system, and distinguish actual states from desired states. Presumably the magnitude and direction of the “money rush to havens” is a function of desired and actual positions in various securities, but we won’t learn much about that from this picture.

Finally, a good diagram ought to give some indication of the polarity of relationships. But what exactly is happening at the top of this diagram, where blue seems to pass to red through the treasury building? Is the diagram arguing that rising treasuries caused falling stocks, so that this is a runaway positive feedback loop? (stock value down, flight to havens, treasuries up, stocks down…). Or are we to be reassured that rising treasuries lower yields, reversing the fall in stocks?

Personally, I preferred the old black & white all-text WSJ.

So far, the comedy coverage of the downgrade is more illuminating than some serious efforts:

More power of personal feedback

Now that I’ve dumped on emerging behavioral feedback technologies, perhaps I should share a personal success story, in which measurement technology played a key role.

Ten years ago, a routine test revealed that my cholesterol was 280 mg/dl, and even higher in a confirmation test. That’s not instant death, but it’s bad. NIH calls <200 desirable, and many argue for even lower levels.

This was a surprise, because I was getting a fair amount of exercise and eating healthier than the typical American diet. I suspect that their must be some genetic component.

Without any discussion, my doctor handed me a prescription for Lipitor. Now, I liked that doctor, and I know he was smart because we’d just had an interesting conversation about wavelet analysis of time series data in biomedical research. But I think he was operating under the assumption that there was no potential for improvement from behavior change. This idea seems to grip much of the medical profession, and creates nasty self-fulfilling prophecy and eroding goals dynamics.

I decided that I didn’t want to take statins for the rest of my (hopefully long) life, so with the aid of spousal prodding and planning, I eliminated all cholesterol and saturated fats (essentially all animal products) from my diet. I was quickly below 200, and then made more gradual progress to a range of about 160 to 180.

Interestingly, since then I’ve also cut out a lot of carbohydrates, because the rest of my family is gluten intolerant, which takes the fun out of bread and pasta. My cholesterol is now lower than ever, 149 at last check, in spite of adding eggs, a big dietary cholesterol source, back into my diet.

While my wife deserves most of the credit for my success, I think technology played a key role as well. Early on, I bought a home cholesterol test meter (a Bioscanner 2000, predecessor to the CardioChek that I now have). The meter allowed me to close the loop between behavior and outcome without the long delay and expense involved with a trip to the doctor. That obviously had a practical benefit, but it was also very motivating.

Continue reading “More power of personal feedback”

Big data and the power of personal feedback

In a recent conversation about data requirements for future Vensim, a colleague observed that the availability of ready access to ‘big data’ in corporations has had curious side effects. One might have hoped for a flowering of model-driven conversations about the firm. Instead, ubiquitous access to data has led managers to spend less time contemplating what data might actually be important. Crucial data for model calibration are often harder to get than they were in the bad old days, because:

  • The perceived time scale of relevance is shorter than ever; there are no enduring generic structures, only transient details, so old data gets tossed or ignored.
  • Prevalent databases are still lousy at constructing aggregate time series.
  • Zombie managerial instincts for hoarding data still walk the earth.
  • Users are riveted by slick graphics which conceal quality issues in the underlying data.

Perhaps this is a consequence of the fact that data collection has become incredibly cheap. In the short run, business is about execution of essentially fixed strategies, and raw data is pretty darn useful for that. The problem is that the long run challenge of formulating strategies requires an investment of time to turn data into models (mental or formal), but modeling hasn’t experienced the same productivity revolution. This could leave companies more strategically blind than ever, and therefore accelerate the process of inadvertently walking off a cliff.

Around the same time, I ran into this Wired article about the power of feedback to change behavior. It details a variety of interesting innovations, from radar speed signs to brainwave headbands. I’ve experimented with similar stuff, like Daytum (found here, clever, but soon abandoned) and the Kill-a-watt (still used occasionally).

In the past two or three years, the plunging price of sensors has begun to foster a feedback-loop revolution. …

And today, their promise couldn’t be greater. The intransigence of human behavior has emerged as the root of most of the world’s biggest challenges. Witness the rise in obesity, the persistence of smoking, the soaring number of people who have one or more chronic diseases. Consider our problems with carbon emissions, where managing personal energy consumption could be the difference between a climate under control and one beyond help. And feedback loops aren’t just about solving problems. They could create opportunities. Feedback loops can improve how companies motivate and empower their employees, allowing workers to monitor their own productivity and set their own schedules. They could lead to lower consumption of precious resources and more productive use of what we do consume. They could allow people to set and achieve better-defined, more ambitious goals and curb destructive behaviors, replacing them with positive actions. Used in organizations or communities, they can help groups work together to take on more daunting challenges. In short, the feedback loop is an age-old strategy revitalized by state-of-the-art technology. As such, it is perhaps the most promising tool for behavioral change to have come along in decades.

But the applications don’t quite live up to these big ambitions:

… The GreenGoose concept starts with a sheet of stickers, each containing an accelerometer labeled with a cartoon icon of a familiar household object—a refrigerator handle, a water bottle, a toothbrush, a yard rake. But the secret to GreenGoose isn’t the accelerometer; that’s a less-than-a-dollar commodity. The key is the algorithm that Krejcarek’s team has coded into the chip next to the accelerometer that recognizes a particular pattern of movement. For a toothbrush, it’s a rapid back-and-forth that indicates somebody is brushing their teeth. … In essence, GreenGoose uses sensors to spray feedback loops like atomized perfume throughout our daily life—in our homes, our vehicles, our backyards. “Sensors are these little eyes and ears on whatever we do and how we do it,” Krejcarek says. “If a behavior has a pattern, if we can calculate a desired duration and intensity, we can create a system that rewards that behavior and encourages more of it.” Thus the first component of a feedback loop: data gathering.

Then comes the second step: relevance. GreenGoose converts the data into points, with a certain amount of action translating into a certain number of points, say 30 seconds of teeth brushing for two points. And here Krejcarek gets noticeably excited. “The points can be used in games on our website,” he says. “Think FarmVille but with live data.” Krejcarek plans to open the platform to game developers, who he hopes will create games that are simple, easy, and sticky. A few hours of raking leaves might build up points that can be used in a gardening game. And the games induce people to earn more points, which means repeating good behaviors. The idea, Krejcarek says, is to “create a bridge between the real world and the virtual world. This has all got to be fun.”

This strikes me as a rehash of the corporate experience: use cheap data to solve execution problems, but leave the big strategic questions unaddressed. The torrent of the measurable might even push the crucial intangibles – love, justice, happiness, wisdom – further toward the unmanaged margins of our existence.

My guess is that these technologies can help us solve our universal personal problems, particularly in areas like health and fitness where rewards are proximate in time and space. There might even be beneficial spillovers from healthier, happier personal lifestyles to reduced resource demand and

But I don’t see them doing much to solve global environmental problems, or even large-scale universal problems like urban decay and poverty. Those problems exist, not for lack of data, but for lack of feedback that is compelling to the same degree as the pressures of markets and other financial and social systems, which aren’t all about fun. In the US, we’re not even willing to entertain the idea of creating climate feedback loops. I suspect that the solutions to our biggest problems awaits some other technology that makes us much more productive at devising good strategies based on shared mental models.

Stimulus regret revisited

A year ago I wrote,

Stimulus regret seems to be pretty widespread now. The undercurrent seems to be that, because unemployment is still 10% etc., the stimulus didn’t work …. This conclusion is based on pattern matching thinking. Pattern matching assumes simple A->B correlation: Stimulus->Unemployment. Working backwards from that assumption, one concludes from ongoing high unemployment and the fact that stimulus did occur that the correlation between stimulus and unemployment is low.

There are two problems with this logic. First, there are many confounding factors in the A->B relationship that could be responsible for ongoing problems. Second, there’s feedback between A and B, which also means that there are (possibly large) intervening stocks (integrations, accumulations). Stocks decouple the temporal relationship between A and B, so that pattern matching doesn’t work.

Today, Paul Krugman decries similar thinking, and identifies a third misperception (that an effect may be small either because of weak causal links, or because the cause was small),

It’s kind of annoying when people claim that I said the stimulus would work; how much noisier could I have been in warning both that it was grossly inadequate, and that by claiming that a far-too-small stimulus was just right, Obama would discredit the whole idea?

Krugman points out that evaluating suites of predictions, not just a single outcome, provides a way to discriminate between competing mental models:

Of course, the WSJ also said that the stimulus wouldn’t work. The difference was in how it was supposed to fail.

The WSJ view was that federal borrowing would crowd out private spending by driving interest rates sky-high, that the bond vigilantes would destroy the economy. …

My view was that government borrowing in a liquidity trap does not drive up rates, and indeed that rates would stay low as long as the economy stayed depressed.

How it turned out.

That’s a pretty clear test; among other things, you would have lost a lot of money if you believed the WSJ view.

The problem remains that there is relatively little of such thoughtful evaluation going on in the public discourse.

For a politician evaluated by people who ignore system structure, this is a no-win situation. As long as things get worse, blame follows, regardless of what policy is chosen.

The rise of systems sciences

The Google books ngram viewer nicely documents the rise of various systems science disciplines, from about the time of Maxwell’s landmark 1868 paper, On Governors:

Click to enlarge.

We still have a long way to go though:

Further reading:

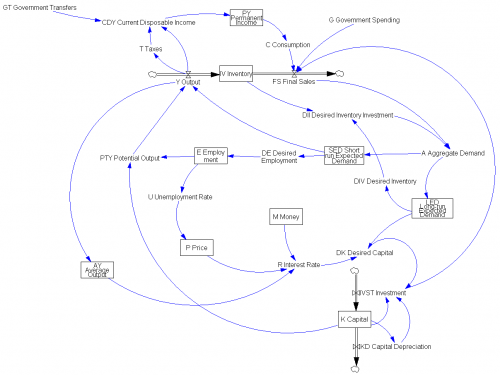
A Dynamic Synthesis of Basic Macroeconomic Theory

Model Name: A Dynamic Synthesis of Basic Macroeconomic Theory

Citation: Forrester, N.B. (1982) A Dynamic Synthesis of Basic Macroeconomic Theory: Implications for Stabilization Policy Analysis. PhD Dissertation, MIT Sloan School of Management.

Source: Provided by Nathan Forrester

Units balance: Yes, with 3 exceptions, evidently from the original publication

Format: Vensim

Notes: I mention this model in this article

A Dynamic Synthesis of Basic Macroeconomic Theory (Vensim .vpm)

Update: a newer version with improved diagrams and a control panel, plus changes files for a series of experiments with responses to negative demand shocks:

Download NFDis+TF-3.vpm or NFDis+TF-3.zip

The model runs in Vensim PLE, but you’ll need an advanced version to use the .cin and .cmd files included.

Limits to bathtubs

Danger lurks in the bathtub – not just slips, falls, and Norman Bates, but also bad model formulations.

A while ago, after working with my kids to collect data on our bathtub, I wrote My bathtub is nonlinear.

We grabbed a sheet of graph paper, fat pens, a yardstick, and a stopwatch and headed for the bathtub. …

When the tub was full, we made a few guesses about how long it might take to empty, then started the clock and opened the drain. Every ten or twenty seconds, we’d stop the timer, take a depth reading, and plot the result on our graph. …

To my astonishment, the resulting plot showed a perfectly linear decline in water depth, all the way to zero (as best we could measure). In hindsight, it’s not all that strange, because the tub tapers at the bottom, so that a constant linear decline in the outflow rate corresponds with the declining volumetric flow rate you’d expect (from decreasing pressure at the outlet as the water gets shallower). Still, I find it rather amazing that the shape of the tub (and perhaps nonlinearity in the drain’s behavior) results in such a perfectly linear trajectory.

It turns out that my attribution of the linear time vs. depth profile was sloppy – the behavior has a little to do with tub shape, and a lot to do with nonlinearity in the draining behavior. In a nice brief from the SD conference, Pål Davidsen, Erling Moxnes, Mauricio Munera Sánchez and David Wheat explain why:

… in the 16th century the Italian scientist Evangelista Torricelli found the relationship between water height and outflow to be nonlinear.

… Torricelli may have reasoned as follows. Let a droplet of water fall frictionless outside the tank from the same height … as the surface of the water. Gravitation will make the droplet accelerate. As the droplet passes the bottom of the tank, its kinetic energy will equal the loss of potential energy … Reorganizing this equation Torricelli found the following nonlinear expression for speed as a function of height

v = SQRT(2*g*h)

Then Torricelli moved inside the tank and reasoned that the same must apply there. …

Assuming that the water tank is a cylinder with straight walls … The outflow is given by the square root of volume; it is not a linear function of volume.

– “A note on the bathtub analogy,” ISDC 2011; final proceedings aren’t online yet but presumably will be here eventually.

In hindsight, this ought to have been obvious to me, because bathtubs clearly don’t exhibit the heavy-right-tail behavior of a first order linear draining process. The difference matters:

The bathtub analogy has been used extensively to illustrate stock and flow relationships. Because this analogy is frequently used, System Dynamicists should be aware that the natural outflow of water from a bathtub is a nonlinear function of water volume. A questionnaire suggests that students with one year or more of System Dynamics training tend to assume a linear relationship when asked to model a water outflow driven by gravity. We present Torricelli’s law for the outflow and investigate the error caused by assuming linearity. We also construct an “inverted funnel” which does behave like a linear system. We conclude by pointing out that the nonlinearity is of no importance for the usefulness of bathtubs or funnels as analogies. On the other hand, simplified analogies could make modellers overconfident in linear formulations and not able to address critical remarks from physicists or other specialists.

I’ve been doing SD for over two decades, and have the physical science background to know better, but found it a little too easy to assume a linear bathtub as a mental model, without inquiring very deeply when confronted with disconfirming data. For me, this is a nice cautionary lesson, that we forget the roots of system dynamics in engineering at our own peril.

My implementation of the model is in my library.

A note on the bathtub analogy

Adapted from “A note on the bathtub analogy,” Pål Davidsen, Erling Moxnes, Mauricio Munera Sánchez, David Wheat, 2011 System Dynamics Conference.

Abstract

The bathtub analogy has been used extensively to illustrate stock and flow relationships. Because this analogy is frequently used, System Dynamicists should be aware that the natural outflow of water from a bathtub is a nonlinear function of water volume. A questionnaire suggests that students with one year or more of System Dynamics training tend to assume a linear relationship when asked to model a water outflow driven by gravity. We present Torricelli’s law for the outflow and investigate the error caused by assuming linearity. We also construct an “inverted funnel” which does behave like a linear system. We conclude by pointing out that the nonlinearity is of no importance for the usefulness of bathtubs or funnels as analogies. On the other hand, simplified analogies could make modellers overconfident in linear formulations and not able to address critical remarks from physicists or other specialists.

See my related blog post for details.

Units balance.

Runs in Vensim (any version): ToricelliBathtub.mdl ToricelliBathtub.vpm