
Drew and Beth showed me this funny video while we were working in Copenhagen. It’s a perfect metaphor for how policy processes go wrong, when everyone jumps straight to detailed analysis (the binoculars) and no one has a big picture of the system outside their own stovepipe (other players, the game field).
Month: November 2008
Parting Shot
I’m off to Copenhagen for a week, with Drew Jones & Beth Sawin of SI – getting ready for Poznan and Copenhagen 2009.

News Flash: There Is No "Environmental Certainty"
The principal benefit cited for cap & trade is “environmental certainty,” meaning that “a cap-and-trade system, coupled with adequate enforcement, assures that environmental goals actually would be achieved by a certain date.” Environmental certainty is a bit of a misnomer. I think of environmental certainty as ensuring a reasonable chance of avoiding serious climate impacts. What people mean when they’re talking about cap & trade is really “emissions certainty.” Unfortunately, emissions certainty doesn’t provide climate certainty:
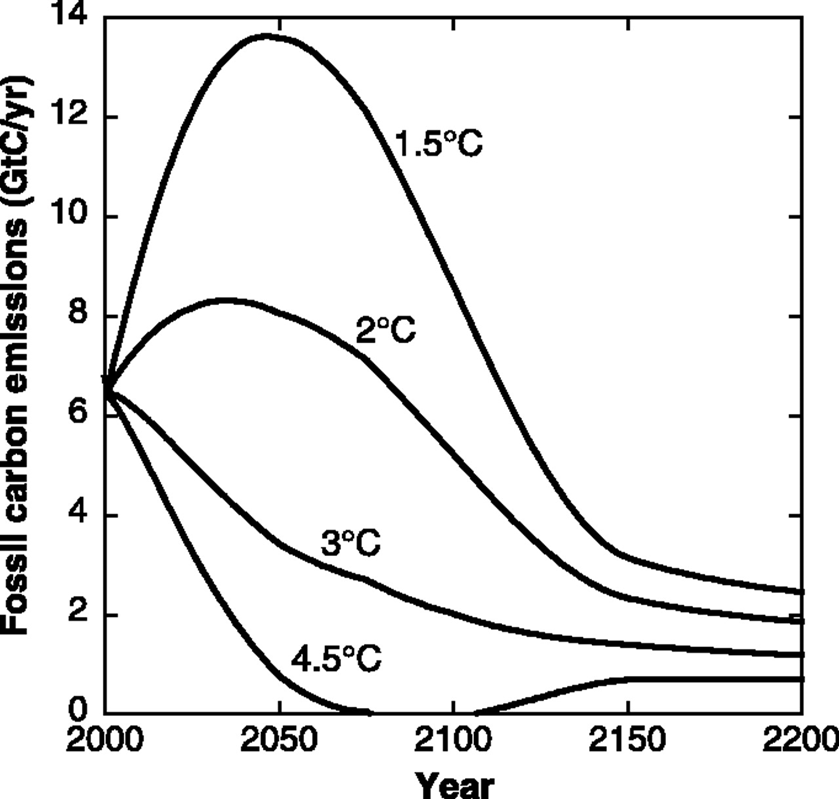
Even if we could determine a “safe” level of interference in the climate system, the sensitivity of global mean temperature to increasing atmospheric CO2 is known perhaps only to a factor of three or less. Here we show how a factor of three uncertainty in climate sensitivity introduces even greater uncertainty in allowable increases in atmospheric CO2 CO2 emissions. (Caldeira, Jain & Hoffert, Science)
The uncertainty about climate sensitivity (not to mention carbon cycle feedbacks and other tipping point phenomena) makes the emissions trajectory we need highly uncertain. That trajectory is also subject to other big uncertainties – technology, growth convergence, peak oil, etc. Together, those features make it silly to expend a lot of effort on detailed plans for 2050. We don’t need a ballistic trajectory; we need a guidance system. I’d like to see us agree to a price on GHGs everywhere now, along with a decision rule for adapting that price over time until we’re on a downward emissions trajectory. Then move on to the other legs of the stool: ensuring equitable opportunities for development, changing lifestyle, tackling institutional barriers to change, and investing in technology.
Unfortunately, cap & trade seems ill-suited to adaptive control. Emissions commitments and allowance allocations are set in multi-year intervals, announced in advance, with long lead times for design. Financial markets and industry players want that certainty, but the delay limits responsiveness. Decision makers don’t set the commitment by strictly environmental standards; they also ask themselves what allocation will result in an “acceptable” price. They’re risk averse, so they choose an allocation that’s very likely to lead to an acceptable price. That means that, more often than not, the system will be overallocated. On balance, their conservatism is probably a good thing; otherwise the whole system could unravel from a negative public reaction to volatile prices. Ironically, safety valves – one policy that could make cap & trade more robust, and thus enable better mean performance – are often opposed because they reduce emissions certainty.
Cap & Trade – How Soon?
I’m a strong advocate for a price on carbon, but I have serious reservations about cap & trade. I’m thrilled that climate policy is finally getting off the dime, but I wish enthusiasm were focused on a carbon tax instead. Consider this:
| Jurisdiction | Instrument | Started | Operational | Status |
| EU | Cap & Trade | 2003 | 2005 | Phase 1 overallocated & underpriced; still wrangling over loopholes for subsequent phases |
| British Columbia | Tax | Feb 2008 | July 2008 | Too low to do much yet, but working |
| Sweden | Tax | 1991 | 1991 | Running, at $150/TonCO2; emissions down |
| RGGI | Cap & Trade | 2003 | 2008 | Overallocated |
| Norway | Tax | 1990 | 1991 | Works; not enough to lower emissions substantially |
| California | Cap & Trade (part of AB32) | 2007 | Earliest 2012 | Punted |
| WCI | Cap & Trade | 2007 | Earliest 2012 | Draft design |
The pattern that stands out to me is timing – cap & trade systems are slow to get out of the gate compared to carbon taxes. They entail huge design challenges, which often restrict sectoral coverage. Price uncertainty makes it difficult to work out the implications of allowance allocation (unless you go to pure auction, in which case you lose the benefit of transitional grandfathering as a mechanism to buy carbon-intensive industry participation). I think we’ll be lucky to see an operational cap & trade system in the US, with meaningful prices and broad coverage, by the end of the first Obama administration.
Winter Approaches

Next Generation Climate Policy Models
Today I’m presenting a talk at an ECF workshop, Towards the next generation of climate policy models. The workshop’s in Berlin, but I’m staying in Montana, so my carbon footprint is minimal for this one (just wait until next month …). My slides are here: Towards Next Generation Climate Policy Models.
I created a set of links to supporting materials on del.icio.us.
Update Workshop materials are now on a web site here.
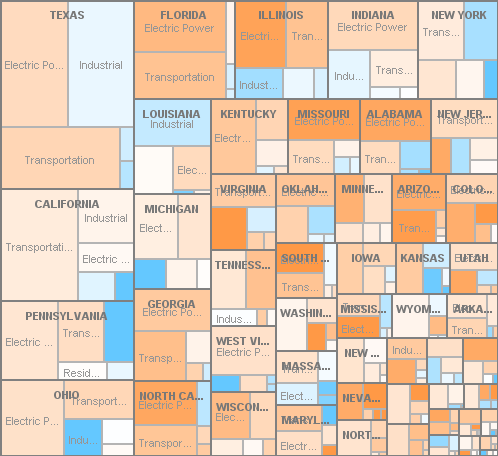
State CO2 Emissions from Fossil Fuel Combustion
California Punting on Cap & Trade
Bloomberg reports that California’s cap and trade program may still be some way off:
[CARB chair] Nichols told venture capitalists and clean-energy executives last week in Mountain View, California, that she was “thinking of punting,” saying the specifics of the emissions-trading program may not be ready for 1-2 more years.
“I think the cap-and-trade system needs to be thought through and I don’t think that has been done yet,” said Jerry Hill, a member of the Air Resources Board. “It would be a good idea to take our time to be sure what we do create is successful.”
Greentech VCs aren’t thrilled, but I think this is wise, and applaud CARB for recognizing the scale of the design task rather than launching a half-baked program. Still, delay is costly, and design complexity contributes to delay. California has a lot of balls in the air, with a hybrid design involving a dozen or so sectoral initiatives, a low-carbon fuel standard, and cap & trade. As I said a while ago,
My fear is that the analysis of GHG initiatives will ultimately prove overconstrained and underpowered, and that as a result implementation will ultimately crumble when called upon to make real changes (like California’s ambitious executive order targeting 2050 emissions 80% below 1990 levels). California’s electric power market restructuring debacle jumps to mind. I think underpowered analysis is partly a function of history. Other programs, like emissions markets for SOx, energy efficiency programs, and local regulation of criteria air pollutants have all worked OK in the past. However, these activities have all been marginal, in the sense that they affect only a small fraction of energy costs and a tinier fraction of GDP. Thus they had limited potential to create noticeable unwanted side effects that might lead to damaging economic ripple effects or the undoing of the policy. Given that, it was feasible to proceed by cautious experimentation. Greenhouse gas regulation, if it is to meet ambitious goals, will not be marginal; it will be pervasive and obvious. Analysis budgets of a few million dollars (much less in most regions) seem out of proportion with the multibillion $/year scale of the problem.
One result of the omission of a true top-down design process is that there has been no serious comparison of proposed emissions trading schemes with carbon taxes, though there are many strong substantive arguments in favor of the latter. In California, for example, the CPUC Interim Opinion on Greenhouse Gas Regulatory Strategies states, ‘We did not seriously consider the carbon tax option in the course of this proceeding, due to the fact that, if such a policy were implemented, it would most likely be imposed on the economy as a whole by ARB.’ It’s hard for CARB to consider a tax, because legislation does not authorize it. It’s hard for legislators to enable a tax, because a supermajority is required and it’s generally considered poor form to say the word ‘tax’ out loud. Thus, for better or for worse, a major option is foreclosed at the outset.
At the risk of repeating myself,
The BC tax demonstrates a huge advantage of a carbon tax over cap & trade: it can be implemented quickly. The tax was introduced in the Feb. 19 budget, and switched on July 1st. By contrast, the WCI and California cap & trade systems have been underway much longer, and still are no where near going live.
My preferred approach to GHG regulation would be, in a nutshell: (a) get a price on emissions ASAP, in as simple and stable a way as possible; if you can’t have a tax, design cap & trade to look like a tax (b) get other regions to harmonize (c) then do all that other stuff: removing institutional barriers to change, R&D, efficiency and renewable incentives, in roughly that order (c) dispense with portfolio standards and other mandates unless (a) through (c) aren’t doing the job.
My Bathtub is Nonlinear
I’m working on raising my kids as systems thinkers. I’ve been meaning to share some of our adventures here for some time, so here’s a first installment, from quite a while back.
I decided to ignore the great online resources for system dynamics education and reinvent the wheel. But where to start? I wanted an exercise that included stocks and flows, accumulation, graph reading, estimation, and data collection, with as much excitement as could be had indoors. (It was 20 below outside, so fire and explosions weren’t an option).
We grabbed a sheet of graph paper, fat pens, a yardstick, and a stopwatch and headed for the bathtub. Step 1 (to sustain interest) was turn on the tap to fill the tub. While it filled, I drew time and depth axes on the graph paper and explained what we were trying to do. That involved explaining what a graph was for, and what locations on the axes meant (they were perhaps 5 and 6 and probably hadn’t seen a graph of behavior over time before).
When the tub was full, we made a few guesses about how long it might take to empty, then started the clock and opened the drain. Every ten or twenty seconds, we’d stop the timer, take a depth reading, and plot the result on our graph. After a few tries, the kids could place the points. About half way, we took a longer pause to discuss the trajectory so far. I proposed a few forecasts of how the second half of the tub might drain – slowing, speeding up, etc. Each of us took a guess about time-to-empty. Naturally my own guess was roughly consistent with exponential decay. Then we reopened the drain and collected data until the tub was dry.
To my astonishment, the resulting plot showed a perfectly linear decline in water depth, all the way to zero (as best we could measure). In hindsight, it’s not all that strange, because the tub tapers at the bottom, so that a constant linear decline in the outflow rate corresponds with the declining volumetric flow rate you’d expect (from decreasing pressure at the outlet as the water gets shallower). Still, I find it rather amazing that the shape of the tub (and perhaps nonlinearity in the drain’s behavior) results in such a perfectly linear trajectory.
We spent a fair amount of time further exploring bathtub dynamics, with much filling and emptying. When the quantity of water on the floor got too alarming, we moved to the sink to explore equilibrium by trying to balance the tap inflow and drain outflow, which is surprisingly difficult.
We lost track of our original results, so we recently repeated the experiment. This time, we measured the filling as well as the draining, shown below on the same axes. The dotted lines are our data; others are our prior guesses. Again, there’s no sign of exponential draining – it’s a linear rush to the finish line. Filling – which you’d expect to be a perfect ramp if the tub had constant volume per depth – is initially fast, then slows slightly as the tapered bottom area is full. However, that effect doesn’t seem to be big enough to explain the outflow behavior.
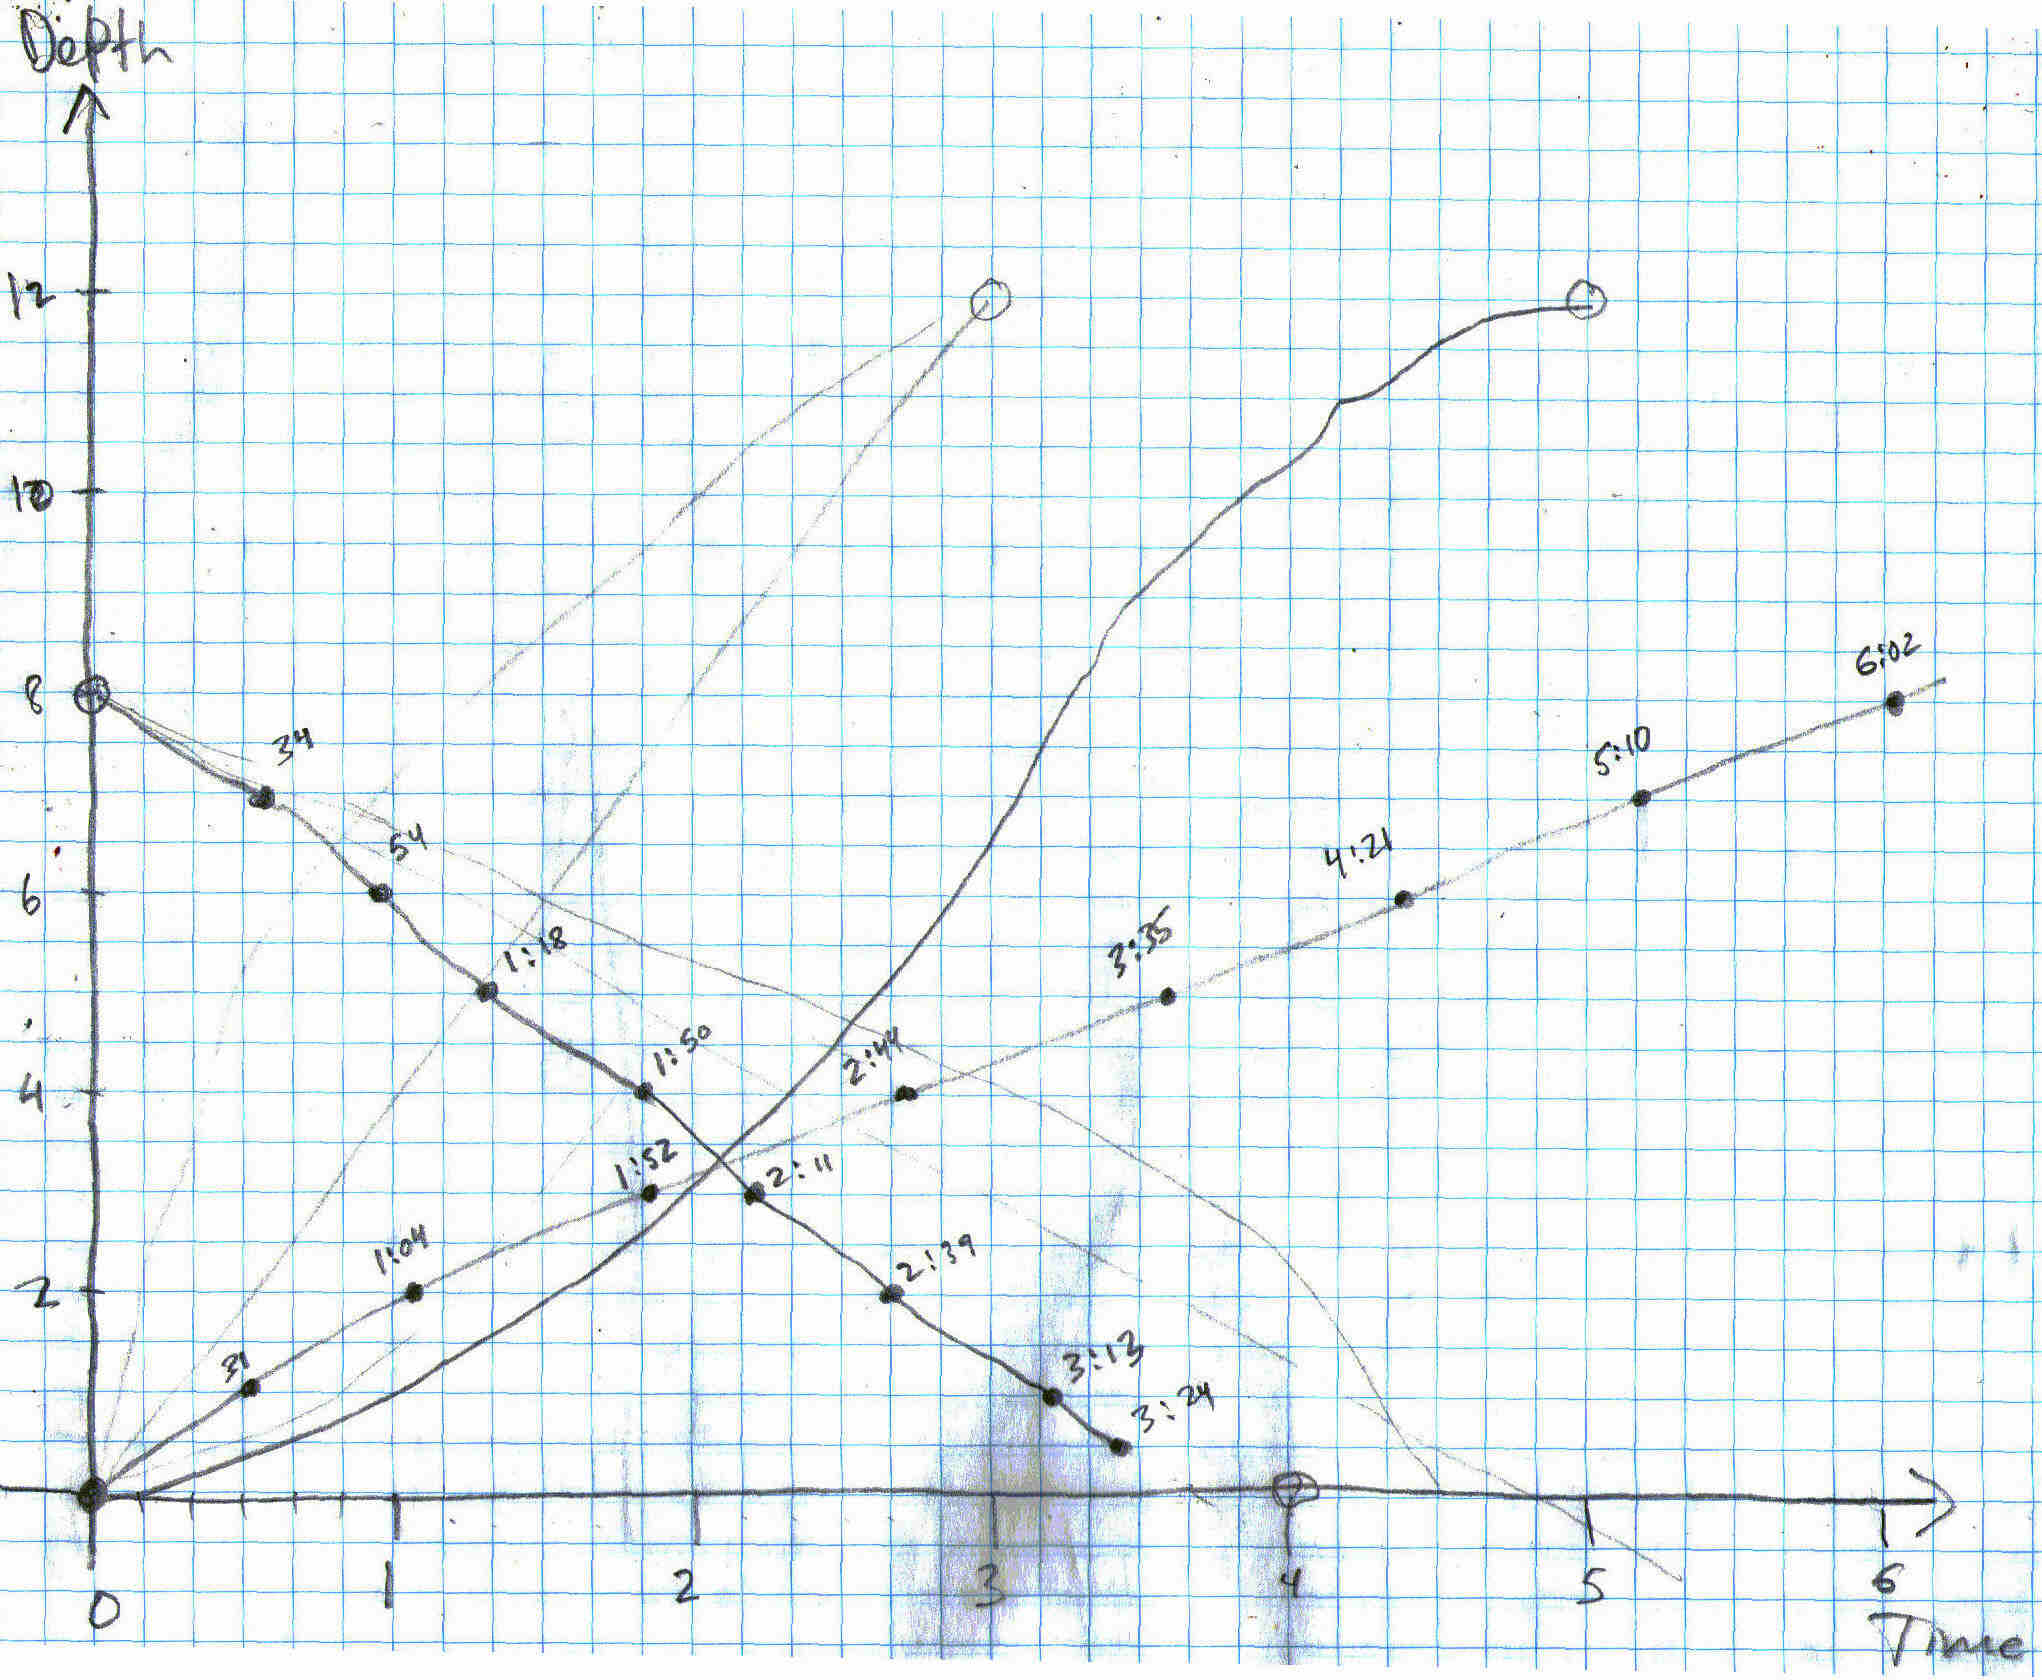
I’ve just realized that I have a straight-sided horse trough lying about, so I think we may need to head outside for another test …
Update: the follow-on to this is rather important.
Cap and Trade, Not in the First 100 Days?
Via Prometheus.