Thyroid Dynamics: Misperceptions of Nonlinearity

I’ve been working on thyroid dynamics, tracking a friend’s data and seeking some understanding with models. With only one patient to go on, it’s impossible to generalize about thyroid behavior from one time series (though there are some interesting features I’ll report on later). On the other hand, our sample size of doctors is now around 10, and I’m starting to see some persistent misperceptions leading to potentially dangerous errors. One of the big issues is simple.

The principal indicator used for thyroid diagnosis is TSH (thyroid stimulating hormone). TSH regulates production of T4 and T3, T3 being the metabolically active hormone. T4 and T3 in turn downregulate TSH (via TRH), producing a negative feedback loop. The basis for the target range for TSH in thyroid treatment is basically the distribution of TSH in the general population without a thyroid diagnosis.

The challenge with TSH is that its response is logarithmic, so its distribution is lognormal. The usual target range is 0.4 to 4 mIU/L (or .45 to 4.5, or something else, depending on which source you prefer). Anyway, suppose you test at 2.2 – bingo! right in the middle! Well, not so fast. The geometric mean of .4 and 4.4 is actually 1.6, so you’re a little high.

How high? Well, no one will tell you without a fight. For some reason, most sources insist on throwing out much of the relevant information about the distribution of “normal”. In fact, when you look at the large survey papers reporting on population health, like NHANES, it’s hard to find the distribution. For example, Thyroid Profile of the Reference United States Population: Data from NHANES 2007-2012 (Jain 2015) doesn’t have a single visualization of the data – just a bunch of tables. When you do find the distribution, you’ll often get a subset (smokers) or a linear-scaled version that makes it hard to see the left tail. (For the record, TSH=2.2 is just above the 75th percentile in the NHANES THYROD_G dataset – so already quite far from the middle.)

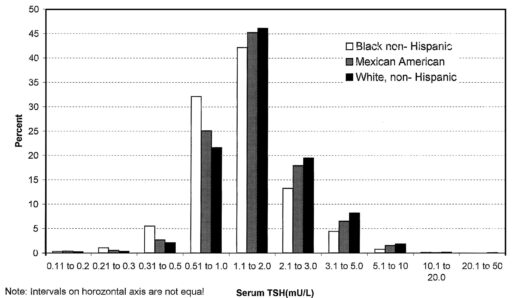
There are also more subtle issues. In the first NHANES thyroid survey article, I found Fig. 1:

Here we have a log scale, but bins of convenience. The breakpoints 1, 2, 3, 5, 10… happen to be roughly equally spaced on a log scale. But when you space histogram bins at these intervals, the bin width is very rough indeed – varying by almost a factor of 2. That means the shape of the distribution is distorted. One of the bins expected to be small is the 2.1-3 range, and you can actually see here that those columns look anomalously low, compared to what you’d expect of a nice bell curve.

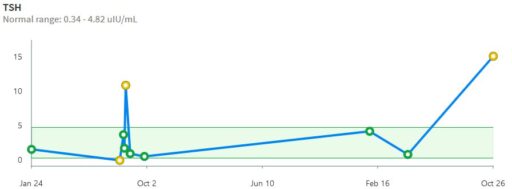
That was 20 years ago, but things are no better with modern analytics. If you get a blood test now, your results are likely to be reported to you, and your doc, though a system like MyChart. For TSH, this means you’ll get a range plot with a linear scale:

backed up by a time series with a linear scale:

Notice that the “normal” range doesn’t match the ATA recommendation or any other source I’ve seen. Presumably it’s the lab’s +/- 2 standard deviation range or something like that. That’s bad, because the upper limit – 4.82 – is above every clinical association recommendation I’ve seen. The linear scale squashes all the variation around low values, and exaggerates the high ones.

Given that the information systems for the entire thyroid management enterprise offer biased, low-information displays of TSH stats, I think it’s not surprising that physicians have trouble overcoming the nonlinearity bias. They have hundreds of variables to think about, and can’t possibly be expected to maintain a table of log or Z transformations in their heads. Patients are probably even more baffled by the asymmetry.

It would be simple to remedy this by presenting the information in a way that minimizes the cognitive burden on the viewer. Reporting TSH on a log scale is trivial. Reporting percentiles as a complementary statistic would also be trivial, and percentiles are widely used, so you don’t have to explain them. Setting a target value rather than a target range would encourage driving without bouncing off the guardrails. I hope authors and providers can figure this out.

What is SD?

Asmeret Naugle, Saeed Langarudi, Timothy Clancy propose to define System Dynamics in a new paper.

The defining characteristics are: (1) models are based on causal feedback structure, (2) accumulations and delays are foundational, (3) models are equation-based, (4) concept of time is continuous, and (5) analysis focuses on feedback dynamics.

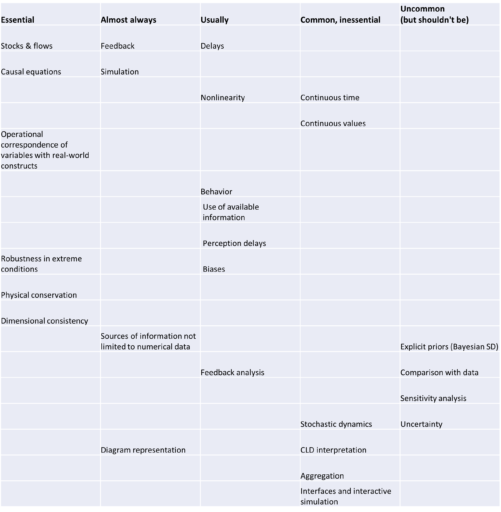
I like the paper, but … not so fast. I think more, and more flexible, criteria are needed. I would use the term “characterize” rather than “define.” The purpose should be to aid recognition of SD, and hopefully good SD, without drawing too tight a box around the field.

I particularly disagree with the inclusion of continuous time. Even though discrete time stinks, I think continuous time is a common but inessential feature, like continuous flows. Many models include occasional discrete events, and sometimes they’re important. Ventity’s actions are explicit discrete events between time steps, and they may modify model structure in ways that are key to an operational representation of reality.

My top-of-mind alternative framework looks like:

I think it’s also helpful to describe things that are not SD:

  • Intertemporal optimization or rational expectations representing behavior
  • Computable general equilibrium
  • Linear regression
  • Linear programming
  • Mixed integer programming
  • Social Network Analysis (static)
  • Discrete ABM
  • Discrete event simulation
  • Equilibrium
  • Simultaneity

Sometimes it’s easier to see the negative space, but there are exceptions to these rules.

I think it’s notable that both frameworks exclude a variety of qualitative systems thinking approaches, like group model building or elicitation methods that create CLDs rather than simulatable models. I’m a big tent fan, and certainly some of the exceptions are common at the SD conference, but does that make them SD?

I think behavior is another challenging feature to describe. In my mind, System Dynamics is almost synonymous with behavioral dynamics. If you’re building an economic model in which agents explicitly know the future (e.g., via intertemporal optimization), it’s not an SD model (though you might be using it as a comparison case for some SD purpose). Yet there’s a strong tradition of prize-winning biomedical models that lack behavior because they lack human agency. These are not easily distinguishable from what other fields might call ODEs or nonlinear dynamics. I would not want to eject those from the field, but neither would I want this to become our focus.

I’ll be interested to see how the conversation evolves on this.

Believing Exponential Growth

Verghese: You were prescient about the shape of the BA.5 variant and how that might look a couple of months before we saw it. What does your crystal ball show of what we can expect in the United Kingdom and the United States in terms of variants that have not yet emerged?

Pagel: The other thing that strikes me is that people still haven’t understood exponential growth 2.5 years in. With the BA.5 or BA.3 before it, or the first Omicron before that, people say, oh, how did you know? Well, it was doubling every week, and I projected forward. Then in 8 weeks, it’s dominant.

It’s not that hard. It’s just that people don’t believe it. Somehow people think, oh, well, it can’t happen. But what exactly is going to stop it? You have to have a mechanism to stop exponential growth at the moment when enough people have immunity. The moment doesn’t last very long, and then you get these repeated waves.

You have to have a mechanism that will stop it evolving, and I don’t see that. We’re not doing anything different to what we were doing a year ago or 6 months ago. So yes, it’s still evolving. There are still new variants shooting up all the time.

At the moment, none of these look devastating; we probably have at least 6 weeks’ breathing space. But another variant will come because I can’t see that we’re doing anything to stop it.

Medscape, We Are Failing to Use What We’ve Learned About COVID, Eric J. Topol, MD; Abraham Verghese, MD; Christina Pagel, PhD

Lake Mead and incentives

Since I wrote about Lake Mead ten years ago (1 2 3), things have not improved. It’s down to 1068 feet, holding fairly steady after a brief boost in the wet year 2011-12. The Reclamation outlook has it losing another 60 feet in the next two years.

The stabilization has a lot to do with successful conservation. In Phoenix, for example, water use is down even though population is up. Some of this is technology and habits, and some of it is banishment of “useless grass” and other wasteful practices. MJ describes water cops in Las Vegas:

Investigator Perry Kaye jammed the brakes of his government-issued vehicle to survey the offense. “Uh oh this doesn’t look too good. Let’s take a peek,” he said, exiting the car to handle what has become one of the most existential violations in drought-stricken Las Vegas—a faulty sprinkler.

“These sprinklers haven’t popped up properly, they are just oozing everywhere,” muttered Kaye. He has been policing water waste for the past 16 years, issuing countless fines in that time. “I had hoped I would’ve worked myself out of a job by now. But it looks like I will retire first.”

Enforcement undoubtedly helps, but it strikes me as a band-aid where a tourniquet is needed. While the city is out checking sprinklers, people are free to waste water in a hundred less-conspicuous ways. That’s because standards say “conserve” but the market says “consume” – water is still cheap. As long as that’s true, technology improvements are offset by rebound effects.

Often, cheap water is justified as an equity issue: the poor need low-cost water. But there’s nothing equitable about water rates. The symptom is in the behavior of the top users:

Total and per-capita water use in Southern Nevada has declined over the last decade, even as the region’s population has increased by 14%. But water use among the biggest water users — some of the valley’s wealthiest, most prominent residents — has held steady.

The top 100 residential water users serviced by the Las Vegas Valley Water District used more than 284 million gallons of water in 2018 — over 11 million gallons more than the top 100 users of 2008 consumed at the time, records show. …

Properties that made the top 100 “lists” — which the Henderson and Las Vegas water districts do not regularly track, but compiled in response to records requests — consumed between 1.39 million gallons and 12.4 million gallons. By comparison, the median annual water consumption for a Las Vegas water district household was 100,920 gallons in 2018.

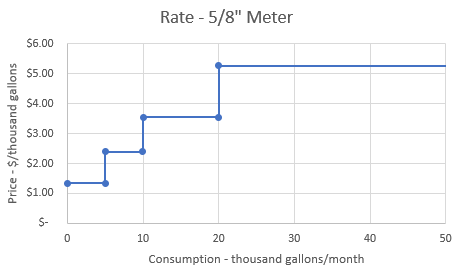
In part, I’m sure the top 100 users consume 10 to 100x as much water as the median user because they have 10 to 100x as much money (or more). But this behavior is also baked into the rate structure. At first glance, it’s nicely progressive, like the price tiers for a 5/8″ meter:

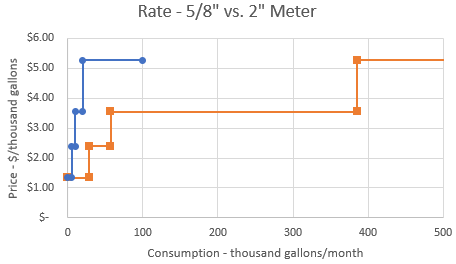
A top user (>20k gallons a month) pays almost 4x as much as a first-tier user (up to 5k gallons a month). But … not so fast. There’s a huge loophole. High users can buy down the rate by installing a bigger meter. That means the real rate structure looks like this:

A high user can consume 20x as much water with a 2″ meter before hitting the top rate tier. There’s really no economic justification for this – transaction costs and economies of scale are surely tiny compared to these discounts. The seller (the water district) certainly isn’t trying to push more sales to high-volume users to make a profit.

To me, this looks a lot like CAFE, which allocates more fuel consumption rights to vehicles with larger footprints, and Energy Star, which sets a lower bar for larger refrigerators. It’s no wonder that these policies have achieved only modest gains over multiple decades, while equity has worsened. Until we’re willing to align economic incentives with standards, financing and other measures, I fear that we’re just not serious enough to solve water or energy problems. Meanwhile, exhorting virtue is just a way to exhaust altruism.

Confusing the decision rule with the system

In the NYT:

To avoid quarantining students, a school district tries moving them around every 15 minutes.

Oh no.

To reduce the number of students sent home to quarantine after exposure to the coronavirus, the Billings Public Schools, the largest school district in Montana, came up with an idea that has public health experts shaking their heads: Reshuffling students in the classroom four times an hour.

The strategy is based on the definition of a “close contact” requiring quarantine — being within 6 feet of an infected person for 15 minutes or more. If the students are moved around within that time, the thinking goes, no one will have had “close contact” and be required to stay home if a classmate tests positive.

For this to work, there would have to be a nonlinearity in the dynamics of transmission. For example, if the expected number of infections from 2 students interacting with an infected person for 10 minutes each were less than the number from one student interacting with an infected person for 20 minutes, there might be some benefit. This would be similar to a threshold in a dose-response curve. Unfortunately, there’s no evidence for such an effect – if anything, increasing the number of contacts by fragmentation makes things worse.

Scientific reasoning has little to do with the real motivation:

Greg Upham, the superintendent of the 16,500-student school district, said in an interview that contact tracing had become a huge burden for the district, and administrators were looking for a way to ease the burden when they came up with the movement idea. It was not intended to “game the system,” he said, but rather to encourage the staff to be cognizant of the 15-minute window.

Regardless of the intent, this is absolutely an example of gaming the system. However, you game rules, but you can’t fool mother nature. The 15-minute window is a decision rule for prioritizing contact tracing, invented in the context of normal social mixing. Administrators have confused it with a physical phenomenon. Whether or not they intended to game the system, they’re likely to get what they want: less contact tracing. This makes the policy doubly disastrous: it increases transmission, and it diminishes the preventive effects of contact tracing and quarantine. In short order, that means more infections. A few doublings of cases will quickly overwhelm any reduction in contact tracing burden from shuffling students around.

I think the administrators who came up with this might want to consider adding systems thinking to the curriculum.


Talking with COVID conspiracy theorists

Tech review has a nice article on how to talk to conspiracy theorists.

What are they hiding in the woods?

I think some of the insights here are also applicable to talking about models, which is turning out to be a real challenge in the COVID era, with high rates of belief in conspiracies. My experience in social media settings is very negative. If I mention anything indicating that I might actually know something about the problem, that triggers immediate suspicion – oh, so you work for the government, eh? Somehow non sequiturs and hearsay beat models every time.

h/t Chris Soderquist for an interesting resource:

“Any assertion of expertise from an actual expert, meanwhile, produces an explosion of anger from certain quarters of the American public, who immediately complain that such claims are nothing more than fallacious “appeals to authority,” sure signs of dreadful “elitism,” and an obvious effort to use credentials to stifle the dialogue required by a “real” democracy. Americans now believe that having equal rights in a political system also means that each person’s opinion about anything must be accepted as equal to anyone else’s. This is the credo of a fair number of people despite being obvious nonsense. It is a flat assertion of actual equality that is always illogical, sometimes funny, and often dangerous.”

Notes From: Tom Nichols. “The Death of Expertise.” Apple Books.

I’m finding the Tech Review article’s points 3 & 6 to be most productive: test the waters first, and use the Socratic method (careful questioning to reveal gaps in thinking). But the best advice is really proving to be, don’t look and don’t take on the trolls directly. It’s more productive to help people who are curious and receptive to modeling than to battle people who basically resist everything since the enlightenment.


Dynamics of Hoarding

“I’m not hoarding, I’m just stocking up before the hoarders get here.”
Behavioral causes of phantom ordering in supply chains
John D. Sterman
Gokhan Dogan

When suppliers are unable to fill orders, delivery delays increase and customers receive less than they desire. Customers often respond by seeking larger safety stocks (hoarding) and by ordering more than they need to meet demand (phantom ordering). Such actions cause still longer delivery times, creating positive feedbacks that intensify scarcity and destabilize supply chains. Hoarding and phantom ordering can be rational when customers compete for limited supply in the presence of uncertainty or capacity constraints. But they may also be behavioral and emotional responses to scarcity. To address this question we extend Croson et al.’s (2014) experimental study with the Beer Distribution Game. Hoarding and phantom ordering are never rational in the experiment because there is no horizontal competition, randomness, or capacity constraint; further, customer demand is constant and participants have common knowledge of that fact. Nevertheless 22% of participants place orders more than 25 times greater than the known, constant demand. We generalize the ordering heuristic used in prior research to include the possibility of endogenous hoarding and phantom ordering. Estimation results strongly support the hypothesis, with hoarding and phantom ordering particularly strong for the outliers who placed extremely large orders. We discuss psychiatric and neuroanatomical evidence showing that environmental stressors can trigger the impulse to hoard, overwhelming rational decision‐making. We speculate that stressors such as large orders, backlogs or late deliveries trigger hoarding and phantom ordering for some participants even though these behaviors are irrational. We discuss implications for supply chain design and behavioral operations research.

Eroding Environmental Goals

In System Dynamics we typically refer to this as the eroding goals archetype, or the boiled frog syndrome:

Shifting baseline syndrome: causes, consequences, and implications

With ongoing environmental degradation at local, regional, and global scales, people’s accepted thresholds for environmental conditions are continually being lowered. In the absence of past information or experience with historical conditions, members of each new generation accept the situation in which they were raised as being normal. This psychological and sociological phenomenon is termed shifting baseline syndrome (SBS), which is increasingly recognized as one of the fundamental obstacles to addressing a wide range of today’s global environmental issues. Yet our understanding of this phenomenon remains incomplete. We provide an overview of the nature and extent of SBS and propose a conceptual framework for understanding its causes, consequences, and implications. We suggest that there are several self‐reinforcing feedback loops that allow the consequences of SBS to further accelerate SBS through progressive environmental degradation. Such negative implications highlight the urgent need to dedicate considerable effort to preventing and ultimately reversing SBS.

Eugenics rebooted – what could go wrong?

Does DNA IQ testing create a meritocracy, or merely reinforce existing biases?

Technology Review covers new efforts to use associations between DNA and IQ.

… Intelligence is highly heritable and predicts important educational, occupational and health outcomes better than any other trait. Recent genome-wide association studies have successfully identified inherited genome sequence differences that account for 20% of the 50% heritability of intelligence. These findings open new avenues for research into the causes and consequences of intelligence using genome-wide polygenic scores that aggregate the effects of thousands of genetic variants.

The new genetics of intelligence

Robert Plomin and Sophie von Stumm

I have no doubt that there’s much to be learned here. However, research is not all they’re proposing:

IQ GPSs will be used to predict individuals’ genetic propensity to learn, reason and solve problems, not only in research but also in society, as direct-to-consumer genomic services provide GPS information that goes beyond single-gene and ancestry information. We predict that IQ GPSs will become routinely available from direct-to-consumer companies along with hundreds of other medical and psychological GPSs that can be extracted from genome-wide genotyping on SNP chips. The use of GPSs to predict individuals’ genetic propensities requires clear warnings about the probabilistic nature of these predictions and the limitations of their effect sizes (BOX 7).

Although simple curiosity will drive consumers’ interests, GPSs for intelligence are more than idle fortune telling. Because intelligence is one of the best predictors of educational and occupational outcomes, IQ GPSs will be used for prediction from early in life before intelligence or educational achievement can be assessed. In the school years, IQ GPSs could be used to assess discrepancies between GPSs and educational achievement (that is, GPS-based overachievement and underachievement). The reliability, stability and lack of bias of GPSs make them ideal for prediction, which is essential for the prevention of problems before they occur. A ‘precision education’ based on GPSs could be used to customize education, analogous to ‘precision medicine’

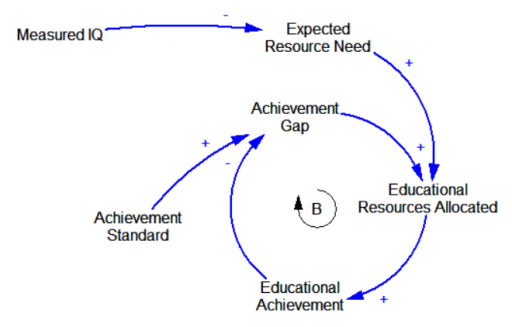
There are two ways “precision education” might be implemented. An egalitarian model would use information from DNA IQ measurements to customize resource allocations, so that all students could perform up to some common standard:

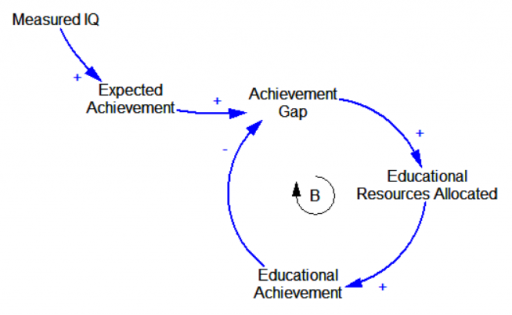
An efficiency model, by contrast, would use IQ measurements to set achievement expectations for each student, and customize resources to ensure that students who are underperforming relative to their DNA get a boost:

This latter approach is essentially a form of tracking, in which DNA is used to get an early read on who’s destined to flip bonds, and who’s destined to flip burgers.

One problem with this scheme is noise (as the authors note, seemingly contradicting their own abstract’s claim of reliability and stability). Consider the effect of a student receiving a spuriously low DNA IQ score. Under the egalitarian scheme, they receive more educational resources (enabling them to overperform), while under the efficiency scheme, resources would be lowered, leading self-fulfillment of the predicted low performance. The authors seem to regard this as benign and self-correcting:

By contrast, GPSs are ‘less dangerous’ because they are intrinsically probabilistic, not hardwired and deterministic like single-gene disorders. It is important to recall here that although all complex traits are heritable, none is 100% heritable. A similar logic can be applied to IQ scores: although they have great predic­tive validity for key life outcomes, IQ is not determin­istic but probabilistic. In short, an individual is always more than the sum of their genes or their IQ scores.

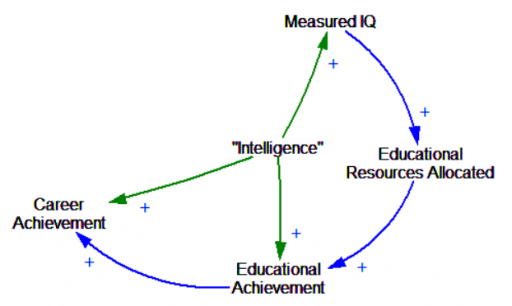
I think this might be true when you consider the local effects on the negative loops governing resource allocation. But I don’t think that remains true when you put it in context. Education is a nest of positive feedbacks. This creates path dependence that amplifies errors in resource allocation, whether they come from subjective teacher impressions or DNA measurements.

In a perfect world, DNA-IQ provides an independent measurement that’s free of those positive feedbacks. In that sense, it’s perfectly meritocratic:

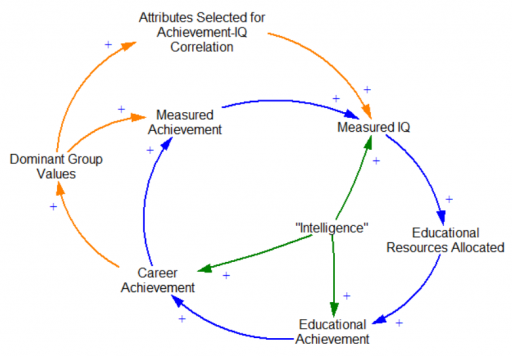
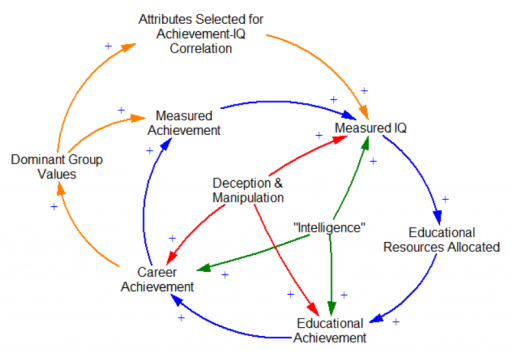
But how do you decide what to measure? Are the measurements good, or just another way to institutionalize bias? This is hotly contested. Let’s suppose that problems of gender and race/ethnicity bias have been, or can be solved. There are still questions about what measurements correlate with better individual or societal outcomes. At some point, implicit or explicit choices have to be made, and these are not value-free. They create reinforcing feedbacks:

I think it’s inevitable that, like any other instrument, DNA IQ scores are going to reflect the interests of dominant groups in society. (At a minimum, I’d be willing to bet that IQ tests don’t measure things that would result in low scores for IQ test designers.) If that means more Einsteins, Bachs and Ghandis, maybe it’s OK. But I don’t think that’s guaranteed to lead to a good outcome. First, there’s no guarantee that a society composed of apparently high-performing individuals is in itself high-performing. Second, the dominant group may be dominant, not by virtue of faster CPUs in their heads, but something less appetizing.

I think there’s no guarantee that DNA IQ will not reflect attributes that are dysfunctional for society. We would hate to inadvertently produce more Stalins and Mengeles by virtue of inadvertent correlations with high achievement of less virtuous origin. And certainly, like any instrument used for high-stakes decisions, the pressure to distort and manipulate results will increase with use.

Note that if education is really egalitarian, the link between Measured IQ and Educational Resources Allocated reverses polarity, becoming negative. Then the positive loops become negative loops, and a lot of these problems go away. But that’s not often a choice societies make, presumably because egalitarian education is in itself contrary to the interests of dominant groups.

I understand researchers’ optimism for this technology in the long run. But for now, I remain wary, due to the decided lack of systems thinking about the possible side effects. In similar circumstances, society has made poor choices about teacher value added modeling, easily negating any benefits it might have had. I’m expecting a similar outcome here.

Vi Hart on positive feedback driving polarization

Vi Hart’s interesting comments on the dynamics of political polarization, following the release of an innocuous video:

I wonder what made those commenters think we have opposite views; surely it couldn’t just be that I suggest people consider the consequences of their words and actions. My working theory is that other markers have placed me on the opposite side of a cultural divide that they feel exists, and they are in the habit of demonizing the people they’ve put on this side of their imaginary divide with whatever moral outrage sounds irreproachable to them. It’s a rather common tool in the rhetorical toolset, because it’s easy to make the perceived good outweigh the perceived harm if you add fear to the equation.

Many groups have grown their numbers through this feedback loop: have a charismatic leader convince people there’s a big risk that group x will do y, therefore it seems worth the cost of being divisive with those who think that risk is not worth acting on, and that divisiveness cuts out those who think that risk is lower, which then increases the perceived risk, which lowers the cost of being increasingly divisive, and so on.

The above feedback loop works great when the divide cuts off a trust of the institutions of science, or glorifies a distrust of data. It breaks the feedback loop if you act on science’s best knowledge of the risk, which trends towards staying constant, rather than perceived risk, which can easily grow exponentially, especially when someone is stoking your fear and distrust.

If a group believes that there’s too much risk in trusting outsiders about where the real risk and harm are, then, well, of course I’ll get distrustful people afraid that my mathematical views on risk/benefit are in danger of creating a fascist state. The risk/benefit calculation demands it be so.