Climate Causality Confusion

A newish set of papers (1. Theory (preprint); 2. Applications (preprint); 3. Extension) is making the rounds on the climate skeptic sites, with – ironically – little skepticism applied.

The claim is bold:

… According to the commonly assumed causality link, increased [CO2] causes a rise in T. However, recent developments cast doubts on this assumption by showing that this relationship is of the hen-or-egg type, or even unidirectional but opposite in direction to the commonly assumed one. These developments include an advanced theoretical framework for testing causality based on the stochastic evaluation of a potentially causal link between two processes via the notion of the impulse response function. …. All evidence resulting from the analyses suggests a unidirectional, potentially causal link with T as the cause and [CO2] as the effect.

Galileo complex seeps in when the authors claim that absence of correlation or impulse response from CO2 -> temperature proves absence of causality:

Clearly, the results […] suggest a (mono-directional) potentially causal system with T as the cause and [CO2] as the effect. Hence the common perception that increasing [CO2] causes increased T can be excluded as it violates the necessary condition for this causality direction.

Unfortunately, these claims are bogus. Here’s why.

The authors estimate impulse response functions between CO2 and temperature (and back), using the following formalism:


where g(h) is the response at lag h. As the authors point out, if

the IRF is zero for every lag except for the specific lag 0, then Equation (1) becomes y(t)=bx(t-h0) +v(t). This special case is equivalent to simply correlating  y(t) with x(t-h0) at any time instance . It is easy to find (cf. linear regression) that in this case the multiplicative constant is the correlation coefficient of y(t) and  x(t-h0) multiplied by the ratio of the standard deviations of the two processes.

Now … anyone who claims to have an “advanced theoretical framework for testing causality” should be aware of the limitations of linear regression. There are several possible issues that might lead to misleading conclusions about causality.

Problem #1 here is bathtub statistics. Temperature integrates the radiative forcing from CO2 (and other things). This is not debatable – it’s physics. It’s old physics, and it’s experimental, not observational. If you question the existence of the effect, you’re basically questioning everything back to the Enlightenment. The implication is that no correlation is expected between CO2 and temperature, because integration breaks pattern matching. The authors purport to avoid integration by using first differences of temperature and CO2. But differencing both sides of the equation doesn’t solve the integration problem; it just kicks the can down the road. If y integrates x, then patterns of the integrals or derivatives of y and x won’t match either. Even worse differencing filters out the signals of interest.

Problem #2 is that the model above assumes only equation error (the term v(t) on the right hand side). In most situations, especially dynamic systems, both the “independent” (a misnomer) and dependent variables are subject to measurement error, and this dilutes the correlation or slope of the regression line (aka attenuation bias), and therefore also the IRF in the authors’ framework. In the case of temperature, the problem is particularly acute, because temperature also integrates internal variability of the climate system (weather) and some of this variability is autocorrelated on long time scales (because for example oceans have long time constants). That means the effective number of data points is a lot less than the 60 years or 720 months you’d expect from simple counting.

Dynamic variables are subject to other pathologies, generally under the heading of endogeneity bias, and related features with similar effects like omitted variable bias. Generalizing the approach to distributed lags in no way mitigates these. The bottom line is that absence of correlation doesn’t prove absence of causation.

Admittedly, even Nobel Prize winners can screw up claims about causality and correlation and estimate dynamic models with inappropriate methods. But causality confusion isn’t really a good way to get into that rarefied company.

I think methods purporting to assess causality exclusively from data are treacherous in general. The authors’ proposed method is provably wrong in some cases, including this one, as is Granger Causality. Even if you have pretty good assumptions, you’ll always find a system that violates them. That’s why it’s so important to take data-driven results with a grain of salt, and look for experimental control (where you can get it) and mechanistic explanations.

One way to tell if you’ve gotten causality wrong is when you “discover” mechanisms that are physically absurd. That happens on a spectacular scale in the third paper:

… we find Δ=23.5 and 8.1 Gt C/year, respectively, i.e., a total global increase in the respiration rate of Δ=31.6 Gt C/year. This rate, which is a result of natural processes, is 3.4 times greater than the CO2 emission by fossil fuel combustion (9.4 Gt C /year including cement production).

To put that in perspective, the authors propose a respiration flow that would put the biosphere about 30% out of balance. This implies a mass flow of trees harvested, soils destroyed, etc. 3.4 times as large as the planetary flow of fossil fuels. That would be about 4 cubic kilometers of wood, for example. In the face of the massive outflow from the biosphere, the 9.4 GtC/yr from fossil fuels went where, exactly? Extraordinary claims require extraordinary evidence, but the authors apparently haven’t pondered how these massive novel flows could be squared with other lines of evidence, like C isotopes, ocean Ph, satellite CO2, and direct estimates of land use emissions.

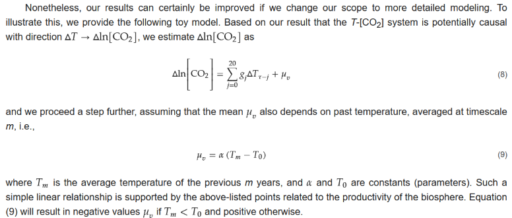
This “insight” is used to construct a model of the temperature->CO2 process:

In this model, the trend in CO2 is explained almost exclusively by the mean temperature effect mu_v = alpha*(T-T0). That effect is entirely ad hoc, with no basis in the impulse response framework.

How do we get into this pickle? I think the simple answer is that the authors’ specification of the system is incomplete. As above, they define a causal system,

y(t) = ∫g1(h)x(t-h)dh

x(t) = ∫g2(h)y(t-h)dh

where g(.) is an impulse response function weighting lags h and the integral is over h from 0 to infinity (because only nonnegative lags are causal). In their implementation, x and y are first differences, so in their climate example, Δlog(CO2) and ΔTemp. In the estimation of the impulse lag structures g(.), the authors impose nonnegativity and (optionally) smoothness constraints.

A more complete specification is roughly:

Y = A*X + U

dX/dt = B*X + E

where

  • X is a vector of system states (e.g., CO2 and temperature)
  • Y is a vector of measurements (observed CO2 and temperature)
  • A and B are matrices of coefficients (this is a linear view of the system, but could easily be generalized to nonlinear functions)
  • E is driving noise perturbing the state, and therefore integrated into it
  • U is measurement error

My notation could be improved to consider covariance and state-dependent noise, though it’s not really necessary here. Fred Schweppe wrote all this out decades ago in Uncertain Dynamic Systems, and you can now find it in many texts like Stengel’s Optimal Control and Estimation. Dixit and Pindyck transplanted it to economics and David Peterson brought it to SD where it found its way into Vensim as the combination of Kalman filtering and optimization.

How does this avoid the pitfalls of the Koutsoyiannis et al. approach?

  • An element of X can integrate any other element of X, including itself.
  • There are no arbitrary restrictions (like nonnegativity) on the impulse response function.
  • The system model (A, B, and any nonlinear elements augmenting the framework) can incorporate a priori structural knowledge (e.g., physics).
  • Driving noise and measurement error are recognized and can be estimated along with everything else.

Does the difference matter? I’ll leave that for a second post with some examples.


Future Climate of the Bridgers

Ten years ago, I explored future climate analogs for my location in Montana:

When things really warm up, to +9 degrees F (not at all implausible in the long run), 16 of the top 20 analogs are in CO and UT, …

Looking at a lot of these future climate analogs on Google Earth, their common denominator appears to be rattlesnakes. I’m sure they’re all nice places in their own way, but I’m worried about my trees. I’ll continue to hope that my back-of-the-envelope analysis is wrong, but in the meantime I’m going to hedge by managing the forest to prepare for change.

I think there’s a lot more to worry about than trees. Fire, wildlife, orchids, snowpack, water availability, …

Recently I decided to take another look, partly inspired by the Bureau of Reclamation’s publication of downscaled data. This solves some of the bias correction issues I had in 2008. I grabbed the model output (36 runs from CMIP5) and observations for the 1/8 degree gridpoint containing Bridger Bowl:

Then I used Vensim to do a little data processing, converting the daily time series (which are extremely noisy weather) into 10-year moving averages (i.e., climate). Continue reading “Future Climate of the Bridgers”

Does statistics trump physics?

My dissertation was a critique and reconstruction of William Nordhaus’ DICE model for climate-economy policy (plus a look at a few other models). I discovered a lot of issues, for example that having a carbon cycle that didn’t conserve carbon led to a low bias in CO2 projections, especially in high-emissions scenarios.

There was one sector I didn’t critique: the climate itself. That’s because Nordhaus used an established model, from climatologists Schneider & Thompson (1981). It turns out that I missed something important: Nordhaus reestimated the parameters of the model from time series temperature and forcing data.

Nordhaus’ estimation focused on a parameter representing the thermal inertia of the atmosphere/surface ocean system. The resulting value was about 3x higher than Schneider & Thompson’s physically-based parameter choice. That delays the effects of GHG emissions by about 15 years. Since the interest rate in the model is about 5%, that lag substantially diminishes the social cost of carbon and the incentive for mitigation.

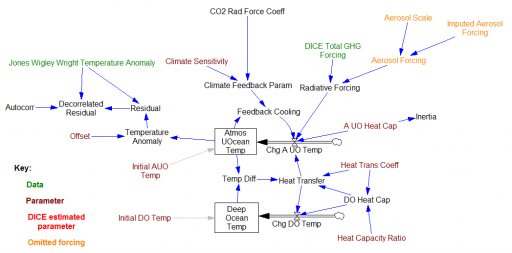
DICE Climate Sector
The climate subsystem of the DICE model, implemented in Vensim

So … should an economist’s measurement of a property of the climate, from statistical methods, overrule a climatologist’s parameter choice, based on physics and direct observations of structure at other scales?

I think the answer could be yes, IF the statistics are strong and reconcilable with physics or the physics is weak and irreconcilable with observations. So, was that the case?

Continue reading “Does statistics trump physics?”

DICE

This is a replication of William Nordhaus’ original DICE model, as described in Managing the Global Commons and a 1992 Science article and Cowles Foundation working paper that preceded it.

There are many good things about this model, but also some bad. If you are thinking of using it as a platform for expansion, read my dissertation first.

Units balance.

I provide several versions:

  1. Model with simple heuristics replacing the time-vector decisions in the original; runs in Vensim PLE
  2. Full model, with decisions implemented as vectors of points over time; requires Vensim Pro or DSS
  3. Same as #2, but with VECTOR LOOKUP replaced with VECTOR ELM MAP; supports earlier versions of Pro or DSS
    • DICE-vec-6-elm.mdl (you’ll also want a copy of DICE-vec-6.vpm above, so that you can extract the supporting optimization control files)

Note that there may be minor variances from the published versions, e.g. that transversality coefficients for the state variables (i.e. terminal values of the states for optimization) are not included. The optimizations use fewer time decision points than the original GAMS equivalents. These do not have any significant effect on the outcome.

Workshop on Modularity and Integration of Climate Models

The MIT Center for Collective Intelligence is organizing a workshop at this year’s Conference on Computational Sustainability entitled “Modularity and Integration of Climate Models.” Check out the  Agenda.

Traditionally, computational models designed to simulate climate change and its associated impacts (climate science models, integrated assessment models, and climate economics models) have been developed as standalone entities. This limits possibilities for collaboration between independent researchers focused on sub-­?problems, and is a barrier to more rapid advances in climate modeling science because work is not distributed effectively across the community. The architecture of these models also precludes running a model with modular sub -­? components located on different physical hardware across a network.

In this workshop, we hope to examine the possibility for widespread development of climate model components that may be developed independently and coupled together at runtime in a “plug and play” fashion. Work on climate models and modeling frameworks that are more modular has begun, (e.g. Kim, et al., 2006) and substantial progress has been made in creating open data standards for climate science models, but many challenges remain.

A goal of this workshop is to characterize issues like these more precisely, and to brainstorm about approaches to addressing them. Another desirable outcome of this workshop is the creation of an informal working group that is interested in promoting more modular climate model development.

C-ROADS & climate leadership workshop

In Boston, Oct. 18-20, Climate Interactive and Seed Systems will be running a workshop on C-ROADS and climate leadership.

Attend to develop your capacities in:

  • Systems thinking: Causal loop and stock-flow diagramming.
  • Leadership and learning: Vision, reflective conversation, consensus building.
  • Computer simulation: Using and leading policy-testing with the C-ROADS/C-Learn simulation.
  • Policy savvy:  Attendees will play the “World Climate” exercise.
  • Climate, energy, and sustainability strategy: Reflections and insights from international experts.
  • Business success stories: What’s working in the new low Carbon Economy and implications for you.
  • Build your network of people sharing your aspirations for Climate progress.

Save the date.

EPA gets the bathtub

Eli Rabett has been posting the comment/response section of the EPA endangerment finding. For the most part the comments are a quagmire of tinfoil-hat pseudoscience; I’m astonished that the EPA could find some real scientists who could stomach wading through and debunking it all – an important but thankless job.

Today’s installment tackles the atmospheric half life of CO2:

A common analogy used for CO2 concentrations is water in a bathtub. If the drain and the spigot are both large and perfectly balanced, then the time than any individual water molecule spends in the bathtub is short. But if a cup of water is added to the bathtub, the change in volume in the bathtub will persist even when all the water molecules originally from that cup have flowed out the drain. This is not a perfect analogy: in the case of CO2, there are several linked bathtubs, and the increased pressure of water in one bathtub from an extra cup will actually lead to a small increase in flow through the drain, so eventually the cup of water will be spread throughout the bathtubs leading to a small increase in each, but the point remains that the “residence time” of a molecule of water will be very different from the “adjustment time” of the bathtub as a whole.

Having tested a lot of low-order carbon cycle models, including I think all possible linear variants up to 3rd order, I agree with EPA – anyone who claims that the effective half life or time constant of CO2 uptake is 10 or 20 or even 50 years is bonkers.

States' role in climate policy

Jack Dirmann passed along an interesting paper arguing for a bigger role for states in setting federal climate policy.

This article explains why states and localities need to be full partners in a national climate change effort based on federal legislation or the existing Clean Air Act. A large share of reductions with the lowest cost and the greatest co-benefits (e.g., job creation, technology development, reduction of other pollutants) are in areas that a federal cap-and-trade program or other purely federal measures will not easily reach. These are also areas where the states have traditionally exercised their powers – including land use, building construction, transportation, and recycling. The economic recovery and expansion will require direct state and local management of climate and energy actions to reach full potential and efficiency.

This article also describes in detail a proposed state climate action planning process that would help make the states full partners. This state planning process – based on a proven template from actions taken by many states – provides an opportunity to achieve cheaper, faster, and greater emissions reductions than federal legislation or regulation alone would achieve. It would also realize macroeconomic benefits and non-economic co-benefits, and would mean that the national program is more economically and environmentally sustainable.

Continue reading “States' role in climate policy”

Climate Science, Climate Policy and Montana

Last night I gave a climate talk at the Museum of the Rockies here in Bozeman, organized by Cherilyn DeVries and sponsored by United Methodist. It was a lot of fun – we had a terrific discussion at the end, and the museum’s monster projector was addictive for running C-LEARN live. Thanks to everyone who helped to make it happen. My next challenge is to do this for young kids.

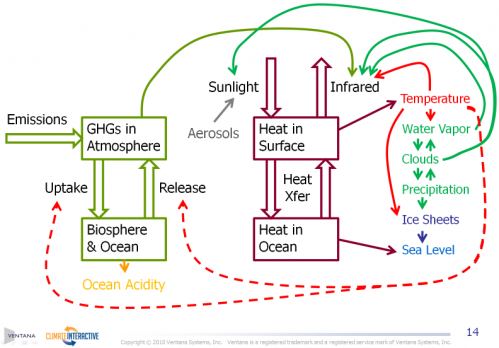
MT Climate Schematic

My slides are here as a PowerPoint show: Climate Science, Climate Policy & Montana (better because it includes some animated builds) or PDF: Climate Science, Climate Policy & Montana (PDF)

Some related resources:

Climate Interactive & the online C-LEARN model

Montana Climate Change Advisory Committee

Montana Climate Office

Montana emissions inventory & forecast visualization (click through the graphic):

Cb009aee-64f1-11df-8f87-000255111976 Blog_this_caption
Related posts:

Flying South

Montana’s Climate Future