I CAN HAS SYSTEM DYNAMICZ?

IM PRETTY SURE THIS IS THE FURST EVAH SYSTEM DYNAMICZ SIMULASHUN MODEL WRITTEN IN LOLCODE.

HAI 1.2
    VISIBLE "HAI, JWF!"
    
    OBTW
     ==========================================================================
     SYSTEM DYNAMICZ INVENTORY MODEL IN LOLCODE
     TOM FIDDAMAN, METASD.COM, 2021
     INSPIRED BY THE CLASSIC BEER GAME
     AND MODEL 3.10 OF MICHAEL GOODMAN'S 
     'STUDY NOTES IN SYSTEM DYNAMICS'
     ==========================================================================
    TLDR
    
    BTW FUNKTION 4 INTEGRATIN STOCKZ WITH NET FLOW INOUT
    HOW IZ I INTEGRATIN YR STOCK AN YR INOUT AN YR TIMESTEP
        FOUND YR SUM OF STOCK AN PRODUKT OF INOUT AN TIMESTEP
    IF U SAY SO
    
    BTW FUNKTION 4 CHARACTER PLOTZ
    HOW IZ I PLOTTIN YR X AN YR SYMBOL
        I HAS A STRING ITZ ""
        I HAS A COUNT ITZ 0
        IM IN YR XLOOP
            BOTH SAEM COUNT AN BIGGR OF COUNT AN X, O RLY?
                YA RLY, GTFO
                NO WAI, STRING R SMOOSH " " STRING MKAY
            OIC
            COUNT R SUM OF COUNT AN 1
        IM OUTTA YR XLOOP
        VISIBLE SMOOSH STRING SYMBOL MKAY
    IF U SAY SO
    
    BTW INISHUL TIME - DEKLARE SUM VARIABLZ AND INIT STOCKZ

    I HAS A INV ITZ 0.0         BTW INVENTORY (WIDGETS)
    I HAS A MAKIN               BTW PRODUCTION RATE (WIDGETS/WEEK)
    I HAS A SELLIN              BTW SALES RATE (WIDGETS/WEEK)
    I HAS A TIME ITZ 0.0        BTW LOL I WISH (WEEK)
    I HAS A TIMESTEP ITZ 1.0    BTW SIMULATION TIME STEP (WEEK)
    I HAS A ZEND ITZ 50.0       BTW FINAL TIME OF THE SIM (WEEK)
    I HAS A TARGET ITZ 20.0     BTW DESIRED INVENTORY (WIDGETS)
    I HAS A ADJTIME ITZ 4.0     BTW INVENTORY ADJUSTMENT TIME (WEEK)
    I HAS A ORDERIN             BTW ORDER RATE (WIDGETS/WEEK)
    I HAS A INIORDERS ITZ 10.0  BTW INITIAL ORDER RATE (WIDGETS/WEEK)
    I HAS A STEPTIME ITZ 30.0   BTW TIME OF STEP IN ORDERS (WEEK)
    I HAS A STEPSIZE ITZ 5.0    BTW SIZE OF STEP IN ORDERS (WIDGETS/WEEK)
    I HAS A INVADJ              BTW INVENTORY ADJUSTMENT NEEDED (WIDGETS)
    I HAS A WIP ITZ 0.0         BTW WORK IN PROGRESS INVENTORY (WIDGETS)
    I HAS A SHIPPIN             BTW DELIVERIES FROM WIP (WIDGETS/WEEK)
    I HAS A PRODTIME ITZ 4.0    BTW TIME TO PRODUCE (WEEK)
    
    VISIBLE "SHOWIN RESULTZ FOR PRODUKSHUN"
    
    IM IN YR SIMLOOP        BTW MAIN SIMULASHUN LOOP
        
        BTW CALCULATE RATES AND AUXILIARIES
        
        BTW STEP IN CUSTOMER ORDERS
        BOTH SAEM TIME AN BIGGR OF TIME AN STEPTIME, O RLY?
            YA RLY, ORDERIN R SUM OF INIORDERS AN STEPSIZE
            NO WAI, ORDERIN R INIORDERS
        OIC
        
        SELLIN R SMALLR OF ORDERIN AN QUOSHUNT OF INV AN TIMESTEP
        INVADJ R DIFF OF TARGET AN INV
        MAKIN R SUM OF SELLIN AN QUOSHUNT OF INVADJ AN ADJTIME
        MAKIN R BIGGR OF MAKIN AN 0.0
        SHIPPIN R QUOSHUNT OF WIP AN PRODTIME
        
        BTW PLOT
        VISIBLE SMOOSH TIME " " MAKIN MKAY
        BTW PRODUKT WITH SCALE FACTOR FOR SIZING
        I IZ PLOTTIN YR PRODUKT OF MAKIN AN 4.0 AN YR "+" MKAY
                
        BTW INTEGRATE STOCKS
        
        TIME R I IZ INTEGRATIN YR TIME AN YR 1.0 AN YR TIMESTEP MKAY
        INV R I IZ INTEGRATIN YR INV AN YR DIFF OF SHIPPIN AN SELLIN AN YR TIMESTEP MKAY
        WIP R I IZ INTEGRATIN YR WIP AN YR DIFF OF MAKIN AN SHIPPIN AN YR TIMESTEP MKAY
        
        BTW CHECK STOPPING CONDISHUN
        BOTH SAEM TIME AN BIGGR OF TIME AN SUM OF ZEND AN TIMESTEP, O RLY?
            YA RLY, GTFO
        OIC
        
    IM OUTTA YR SIMLOOP
    
    
KTHXBYE

YOU CAN RUN IT IN THE TUTORIALSPOINT ONLINE INTERPRETER, OR GET JUSTIN MEZA’S DESKTOP LCI.

SD INVENTORY LOLCODE.TXT

$lci main.lo
HAI, JWF!
SHOWIN RESULTZ FOR PRODUKSHUN
0.00 5.00
                    +
1.00 5.00
                    +
2.00 5.93
                        +
3.00 6.64
                           +
4.00 7.34
                              +
5.00 8.00
                                 +
6.00 8.62
                                   +
7.00 9.22
                                     +
8.00 9.78
                                        +
9.00 10.31
                                          +
10.00 10.82
                                            +
11.00 11.30
                                              +
12.00 11.75
                                                +
13.00 12.18
                                                 +
14.00 12.46
                                                  +
15.00 12.30
                                                  +
16.00 12.03
                                                 +
17.00 11.68
                                               +
18.00 11.29
                                              +
19.00 10.89
                                            +
20.00 10.51
                                           +
21.00 10.17
                                         +
22.00 9.89
                                        +
23.00 9.66
                                       +
24.00 9.49
                                      +
25.00 9.39
                                      +
26.00 9.35
                                      +
27.00 9.35
                                      +
28.00 9.40
                                      +
29.00 9.47
                                      +
30.00 14.56
                                                           +
31.00 15.91
                                                                +
32.00 14.12
                                                         +
33.00 14.07
                                                         +
34.00 14.45
                                                          +
35.00 14.73
                                                           +
36.00 15.01
                                                             +
37.00 15.27
                                                              +
38.00 15.51
                                                               +
39.00 15.75
                                                                +
40.00 15.97

I THINK THIS SHOULD BE A PART OF EVERY SYSTEM THINKERZ LITTERBOX TOOLBOX.

Limits and Markets

Almost fifty years ago, economists claimed that markets would save us from Limits to Growth. Here’s William Nordhaus, writing about World Dynamics in Measurement without Data (1973):

How’s that working out? I would argue, not well.

Certainly there are functional markets for commodities like oil and gas, but even then a substantial share of the resources are allocated by myopic regulators captive to industry interests.

But for practically everything else, the markets that would in theory allocate across resources, time and space simply don’t exist, even today.

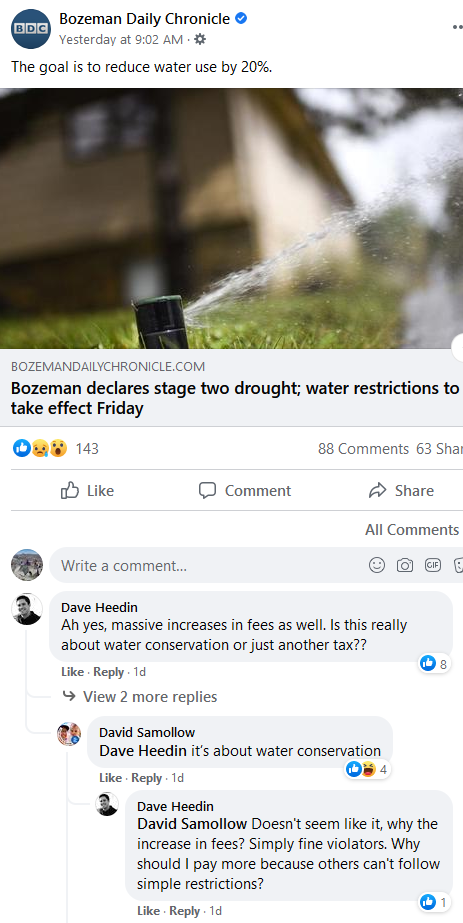
Water markets haven’t prevented the decline of Lake Mead, and they’re resisted widely, including here in Bozeman:

Joseph Stiglitz explained in the WSJ:

A similar pattern could unfold again. But economic forces alone may not be able to fix the problems this time around. Societies as different as the U.S. and China face stiff political resistance to boosting water prices to encourage efficient use, particularly from farmers. …

This troubles some economists who used to be skeptical of the premise of “The Limits to Growth.” As a young economist 30 years ago, Joseph Stiglitz said flatly: “There is not a persuasive case to be made that we face a problem from the exhaustion of our resources in the short or medium run.”

Today, the Nobel laureate is concerned that oil is underpriced relative to the cost of carbon emissions, and that key resources such as water are often provided free. “In the absence of market signals, there’s no way the market will solve these problems,” he says. “How do we make people who have gotten something for free start paying for it? That’s really hard. If our patterns of living, our patterns of consumption are imitated, as others are striving to do, the world probably is not viable.”

What is the price of declining rainforests, reefs or insects? What would markets quote for killing a bird with neonicotinoids, or a wind turbine, or for your Italian songbird pan-fry? What do gravel pits pay for dust and noise emissions, and what will autonomous EVs pay for increased congestion? The answer is almost universally zero. Even things that have received much attention, like emissions of greenhouse gases and criteria air pollutants, are free in most places.

These public goods aren’t free because they’re abundant or unimportant. They’re free because there are no property rights for them, and people resist creating the market mechanisms needed. Everyone loves the free market, until it applies to them. This might be OK if other negative feedback mechanisms picked up the slack, but those clearly aren’t functioning sufficiently either.

Lytton Burning

By luck and a contorted Jet Stream, Montana more or less escaped the horrific heat that gripped the Northwest at the end of June. You probably heard, but this culminated in temperatures in Lytton BC breaking all-time records for Canada and the globe north of latitude 50 by huge margins. The next day, the town burned to the ground.

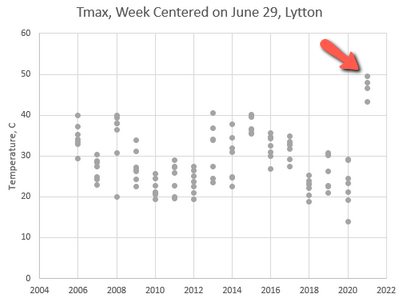
I wondered just how big this was, so when GHCN temperature records from KNMI became available, I pulled the data for a quick and dirty analysis. Here’s the daily Tmax for Lytton:

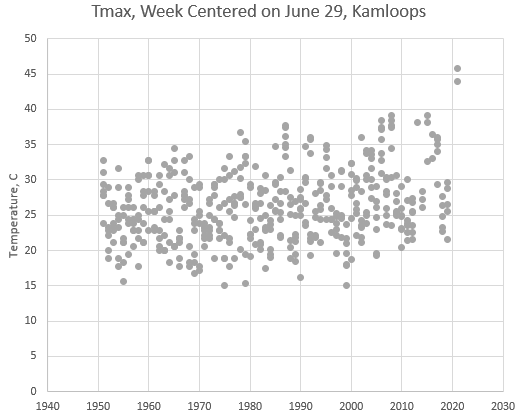
That’s about 3.5 standard deviations above the recent mean. Lytton’s records are short and fragmented, so I also pulled Kamloops (the closest station with a long record):

You can see how bizarre the recent event was, even in a long term context. In Kamloops, it’s a +4 standard deviation event, which means a likelihood of 1 in 16,000 if this were simply random. Even if you start adjusting for selection and correlations, it still looks exceedingly rare – perhaps a 1000-year event in a 70-year record.

Clearly it’s not simply random. For one thing, there’s a pretty obvious long term trend in the Kamloops record. But a key question is, what will happen to the variance of temperature in the future? The simplest thermodynamic argument is that energy in partitions of a system has a Boltzmann distribution and therefore that variance should go up with the mean. However, feedback might alter this.

This paper argues that variance goes up:

Extreme summertime temperatures are a focal point for the impacts of climate change. Climate models driven by increasing CO2 emissions project increasing summertime temperature variability by the end of the 21st century. If credible, these increases imply that extreme summertime temperatures will become even more frequent than a simple shift in the contemporary probability distribution would suggest. Given the impacts of extreme temperatures on public health, food security, and the global economy, it is of great interest to understand whether the projections of increased temperature variance are credible. In this study, we use a theoretical model of the land surface to demonstrate that the large increases in summertime temperature variance projected by climate models are credible, predictable from first principles, and driven by the effects of warmer temperatures on evapotranspiration. We also find that the response of plants to increased CO2 and mean warming is important to the projections of increased temperature variability.

But Zeke Housfather argues for stable variance:

summer variability, where extreme heat events are more of a concern, has been essentially flat. These results are similar to those found in a paper last fall by Huntingford et al published in the journal Nature. Huntingford and colleagues looked at both land and ocean temperature records and found no evidence of increasing variability. They also analyzed the outputs of global climate models, and reported that most climate models actually predict a slight decline in temperature variability over the next century as the world warms. The figure below, from Huntingford, shows the mean and spread of variability (in standard deviations) for the models used in the latest IPCC report (the CMIP5 models).

This is good news overall; increasing mean temperatures and variability together would lead to even more extreme heat events. But “good news” is relative, and the projected declines in variability are modest, so rising mean temperatures by the end of this century will still push the overall temperature distribution well outside of what society has experienced in the last 12,000 years.

If he’s right, stable variance implies that the mean temperature of scenarios is representative of what we’ll experience – nothing further to worry about. I hope this is true, but I also hope it takes a long time to find out, because I really don’t want to experience what Lytton just did.

Lake Mead and incentives

Since I wrote about Lake Mead ten years ago (1 2 3), things have not improved. It’s down to 1068 feet, holding fairly steady after a brief boost in the wet year 2011-12. The Reclamation outlook has it losing another 60 feet in the next two years.

The stabilization has a lot to do with successful conservation. In Phoenix, for example, water use is down even though population is up. Some of this is technology and habits, and some of it is banishment of “useless grass” and other wasteful practices. MJ describes water cops in Las Vegas:

Investigator Perry Kaye jammed the brakes of his government-issued vehicle to survey the offense. “Uh oh this doesn’t look too good. Let’s take a peek,” he said, exiting the car to handle what has become one of the most existential violations in drought-stricken Las Vegas—a faulty sprinkler.

“These sprinklers haven’t popped up properly, they are just oozing everywhere,” muttered Kaye. He has been policing water waste for the past 16 years, issuing countless fines in that time. “I had hoped I would’ve worked myself out of a job by now. But it looks like I will retire first.”

Enforcement undoubtedly helps, but it strikes me as a band-aid where a tourniquet is needed. While the city is out checking sprinklers, people are free to waste water in a hundred less-conspicuous ways. That’s because standards say “conserve” but the market says “consume” – water is still cheap. As long as that’s true, technology improvements are offset by rebound effects.

Often, cheap water is justified as an equity issue: the poor need low-cost water. But there’s nothing equitable about water rates. The symptom is in the behavior of the top users:

Total and per-capita water use in Southern Nevada has declined over the last decade, even as the region’s population has increased by 14%. But water use among the biggest water users — some of the valley’s wealthiest, most prominent residents — has held steady.

The top 100 residential water users serviced by the Las Vegas Valley Water District used more than 284 million gallons of water in 2018 — over 11 million gallons more than the top 100 users of 2008 consumed at the time, records show. …

Properties that made the top 100 “lists” — which the Henderson and Las Vegas water districts do not regularly track, but compiled in response to records requests — consumed between 1.39 million gallons and 12.4 million gallons. By comparison, the median annual water consumption for a Las Vegas water district household was 100,920 gallons in 2018.

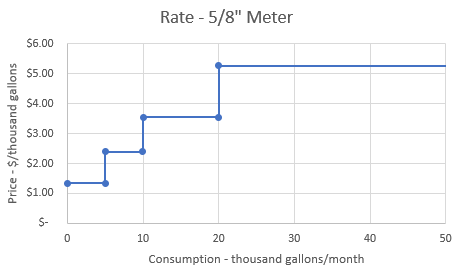
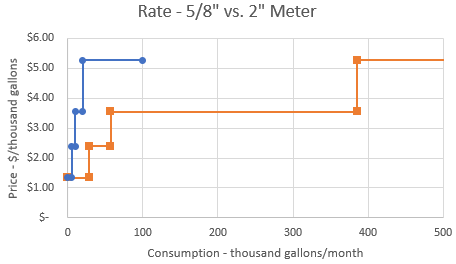
In part, I’m sure the top 100 users consume 10 to 100x as much water as the median user because they have 10 to 100x as much money (or more). But this behavior is also baked into the rate structure. At first glance, it’s nicely progressive, like the price tiers for a 5/8″ meter:

A top user (>20k gallons a month) pays almost 4x as much as a first-tier user (up to 5k gallons a month). But … not so fast. There’s a huge loophole. High users can buy down the rate by installing a bigger meter. That means the real rate structure looks like this:

A high user can consume 20x as much water with a 2″ meter before hitting the top rate tier. There’s really no economic justification for this – transaction costs and economies of scale are surely tiny compared to these discounts. The seller (the water district) certainly isn’t trying to push more sales to high-volume users to make a profit.

To me, this looks a lot like CAFE, which allocates more fuel consumption rights to vehicles with larger footprints, and Energy Star, which sets a lower bar for larger refrigerators. It’s no wonder that these policies have achieved only modest gains over multiple decades, while equity has worsened. Until we’re willing to align economic incentives with standards, financing and other measures, I fear that we’re just not serious enough to solve water or energy problems. Meanwhile, exhorting virtue is just a way to exhaust altruism.