Held v Montana

The Montana climate case, Held vs. State of Montana, has just turned in a win for youth.

The decision looks pretty strong. I think the bottom line is that the legislature’s MEPA exclusions preventing consideration of climate in state regulation are a limitation of the MT constitutional environmental rights, and therefore require strict scrutiny. The state failed to show that the MEPA Limitation serves a compelling government interest.

Not to diminish the accomplishments of the plaintiffs, but the state put forth a very weak case. The Montana Supreme Court tossed out AG Knudsen’s untimely efforts to send the case back to the drawing board. The state’s own attorney, Thane Johnson, couldn’t get acronyms right for the IPCC and RCPs. That’s perhaps not surprising, given that the Director of Montana’s alleged environmental agency admitted unfamiliarity with the largest scientific body related to climate,

Montana’s top witnesses — state employees who are responsible for permitting fossil fuel projects — however, acknowledged they are not well-versed in climate science and at times struggled with the many acronyms used in the case.

Chris Dorrington, director of the Montana Department of Environmental Quality, told an attorney for the youth that he had been unaware of the U.N. Intergovernmental Panel on Climate Change (IPCC) — which has issued increasingly dire assessments since it was established more than 30 years ago to synthesize global climate data.

“I attended this trial last week, when there was testimony relevant to IPCC,” Dorrington said. “Prior to that, I wasn’t familiar, and certainly not deeply familiar with its role or its work.”

As noted by Judge Seeley, the state left much of the plaintiffs’ evidence uncontested. They also declined to call their start witness on climate science, Judith Curry, who reflects:

MT’s lawyers were totally unprepared for direct and cross examination of climate science witnesses. This was not surprising, since this is a very complex issue that they apparently had not previously encountered. One lawyer who was cross-examining the Plaintiffs’ witnesses kept getting confused by ICP (IPCC) and RPC (RCP). The Plaintiffs were very enthusiastic about keeping witnesses in reserve to rebut my testimony, with several of the Plaintiffs’ witnesses who were leaving on travel presenting pre-buttals to my anticipated testimony during their direct questioning – all of this totally misrepresented what was in my written testimony, and can now be deleted from the court record since I didn’t testify. I can see that all of this would have turned the Hearing into a 3-ring climate circus, and at the end of all that I might not have managed to get my important points across, since I am only allowed to respond to questions.

On Thurs eve, I received a call from the lead Montana lawyer telling me that they were “letting me off the hook.” I was relieved to be able to stay home and recapture those 4 days I had scheduled for travel to and from MT.

The state’s team sounds pretty dysfunctional:

Montana’s approach to the case has evolved since 2020, has evolved rapidly in the last 6 months since a new legal team was brought in, and even evolved rapidly during the course of the trial.  The lawyers I spoke to in Sept 2022 were gone by the end of Oct, with an interim team brought in from the private sector, and then a new team that was hired for the Montana’s State Attorney’s Office in Dec.

MT’s original expert witnesses were apparently tossed, and I and several other expert witnesses were brought on board in the 11th hour, around Sept 2022. Note:  instructions for preparing our written reports were received from lawyers two generations removed from the actual trial lawyers.  As per questioning during my Deposition, I gleaned that the state originally had a collection of witnesses that were pretty subpar (I don’t know who they were).  The new set of witnesses was apparently much better.

If the state has such a compelling case, why can’t they get their act together?

In any case, I find one argument in all of this really disturbing. Suppose we accept Curry’s math:

With regards to Montana’s CO2 emissions, based on 2019 estimates Montana produces 0.63% of U.S. emissions and 0.09% of global emissions.  For an anticipated warming of 2oC, Montana’s 0.09% of emissions would account for 0.0018oC of warming.  There are other ways to frame this calculation (and more recent numbers), but any way you slice it, you can’t come up with a significant amount of global warming that is caused by Montana’s emissions.

Never mind that MT is also only .0135% of global population. If you get granular enough, every region is a tiny fraction of the world in all things. So if we are to imagine that “my contribution is small” equates to “I don’t have to do anything about the problem,” then no one has to do anything about climate, or any other global problem for that matter. There’s no role for leadership, cooperation or enlightened self-interest. This is a circular firing squad for global civilization.
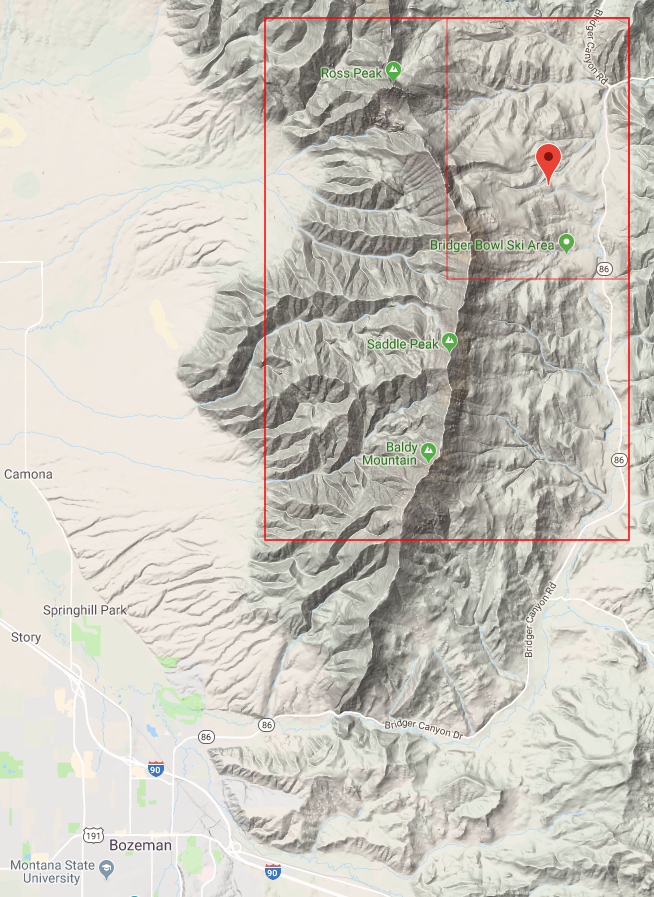
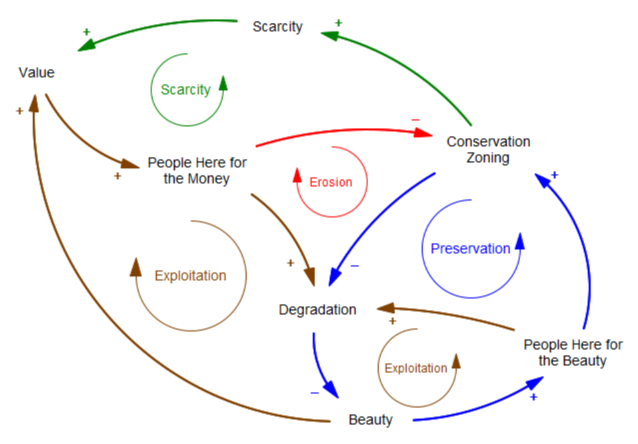
Lytton Burning

By luck and a contorted Jet Stream, Montana more or less escaped the horrific heat that gripped the Northwest at the end of June. You probably heard, but this culminated in temperatures in Lytton BC breaking all-time records for Canada and the globe north of latitude 50 by huge margins. The next day, the town burned to the ground.

I wondered just how big this was, so when GHCN temperature records from KNMI became available, I pulled the data for a quick and dirty analysis. Here’s the daily Tmax for Lytton:

That’s about 3.5 standard deviations above the recent mean. Lytton’s records are short and fragmented, so I also pulled Kamloops (the closest station with a long record):

You can see how bizarre the recent event was, even in a long term context. In Kamloops, it’s a +4 standard deviation event, which means a likelihood of 1 in 16,000 if this were simply random. Even if you start adjusting for selection and correlations, it still looks exceedingly rare – perhaps a 1000-year event in a 70-year record.

Clearly it’s not simply random. For one thing, there’s a pretty obvious long term trend in the Kamloops record. But a key question is, what will happen to the variance of temperature in the future? The simplest thermodynamic argument is that energy in partitions of a system has a Boltzmann distribution and therefore that variance should go up with the mean. However, feedback might alter this.

This paper argues that variance goes up:

Extreme summertime temperatures are a focal point for the impacts of climate change. Climate models driven by increasing CO2 emissions project increasing summertime temperature variability by the end of the 21st century. If credible, these increases imply that extreme summertime temperatures will become even more frequent than a simple shift in the contemporary probability distribution would suggest. Given the impacts of extreme temperatures on public health, food security, and the global economy, it is of great interest to understand whether the projections of increased temperature variance are credible. In this study, we use a theoretical model of the land surface to demonstrate that the large increases in summertime temperature variance projected by climate models are credible, predictable from first principles, and driven by the effects of warmer temperatures on evapotranspiration. We also find that the response of plants to increased CO2 and mean warming is important to the projections of increased temperature variability.

But Zeke Housfather argues for stable variance:

summer variability, where extreme heat events are more of a concern, has been essentially flat. These results are similar to those found in a paper last fall by Huntingford et al published in the journal Nature. Huntingford and colleagues looked at both land and ocean temperature records and found no evidence of increasing variability. They also analyzed the outputs of global climate models, and reported that most climate models actually predict a slight decline in temperature variability over the next century as the world warms. The figure below, from Huntingford, shows the mean and spread of variability (in standard deviations) for the models used in the latest IPCC report (the CMIP5 models).

This is good news overall; increasing mean temperatures and variability together would lead to even more extreme heat events. But “good news” is relative, and the projected declines in variability are modest, so rising mean temperatures by the end of this century will still push the overall temperature distribution well outside of what society has experienced in the last 12,000 years.

If he’s right, stable variance implies that the mean temperature of scenarios is representative of what we’ll experience – nothing further to worry about. I hope this is true, but I also hope it takes a long time to find out, because I really don’t want to experience what Lytton just did.

MSU Covid Evaluation

Well, my prediction of 10/9 covid cases at MSU, made on 10/6 using 10/2 data, was right on the money: I extrapolated 61 from cumulative cases, and the actual number was 60. (I must have made a typo or mental math error in reporting the expected cumulative cases, because 157+61 <> 207. The number I actually extrapolated was 157*e^.33 = 218 = 157 + 61.)

That’s pretty darn good, though I shouldn’t take too much credit, because my confidence bounds would have been wide, had I included them in the letter. Anyway, it was a fairly simpleminded exercise, far short of calibrating a real model.

Interestingly, the 10/16 release has 65 new cases, which is lower than the next simple extrapolation of 90 cases. However, Poisson noise in discrete events like this is large (the variance equals the mean, so this result is about two and a half standard deviations low), and we still don’t know how much testing is happening. I would still guess that case growth is positive, with R above 1, so it’s still an open question whether MSU will make it to finals with in-person classes.

Interestingly, the increased caseload in Gallatin County means that contact tracing and quarantine resources are now strained. This kicks off a positive feedback: increased caseload means that fewer contacts are traced and quarantined. That in turn means more transmission from infected people in the wild, further increasing caseload. MSU is relying on county resources for testing and tracing, so presumably the university is caught in this loop as well.


MSU Covid – what will tomorrow bring?

The following is a note I posted to a local listserv earlier in the week. It’s an example of back-of-the-envelope reasoning informed by experience with models, but without actually calibrating a model to verify the results. Often that turns out badly. I’m posting this to archive it for review and discussion later, after new data becomes available (as early as tomorrow, I expect).

I thought about responding to this thread two weeks ago, but at the time numbers were still very low, and data was scarce. However, as an MSU parent, I’ve been watching the reports closely. Now the picture is quite different.

If you haven’t discovered it, Gallatin County publishes MSU stats at the end of the weekly Surveillance Report, found here:

https://www.healthygallatin.org/about-us/press-releases/

For the weeks ending 9/10, 9/17, 9/24, and 10/2, MSU had 3, 7, 66, and 43 new cases. Reported active cases are slightly lower, which indicates that the active case duration is less than a week. That’s inconsistent with the two-week quarantine period normally recommended. It’s hard to see how this could happen, unless quarantine compliance is low or delays cause much of the infectious period to be missed (not good either way).

The huge jump two weeks ago is a concern. That’s growth of 32% per day, faster than the typical uncontrolled increase in the early days of the epidemic. That could happen from a superspreader event, but more likely reflects insufficient testing to detect a latent outbreak.

Unfortunately they still don’t publish the number of tests done at MSU, so it’s hard to interpret any of the data. We know the upper bound, which is the 2000 or so tests per week reported for all of Gallatin county. Even if all of those were dedicated to MSU, it still wouldn’t be enough to put a serious dent in infection through testing, tracing and isolation. Contrast this with Colby College, which tests everyone twice a week, which is a test density about 100x greater than Gallatin County+MSU.

In spite of the uncertainty, I think it’s wrong to pin Gallatin County’s increase in cases on MSU. First, COVID prevalence among incoming students was unlikely to be much higher than in the general population. Second, Gallatin County is much larger than MSU, and students interact largely among themselves, so it would be hard for them to infect the broad population. Third, the county has its own reasons for an increase, like reopening schools. Depending on when you start the clock, MSU cases are 18 to 28% of the county total, which is at worst 50% above per capita parity. Recently, there is one feature of concern – the age structure of cases (bottom of page 3 of the surveillance report). This shows that the current acceleration is driven by the 10-19 and 20-29 age groups.

As a wild guess, reported cases might understate the truth by a factor of 10. That would mean 420 active cases at MSU when you account for undetected asymptomatics and presymptomatic untested contacts. That’s out of a student/faculty population of 20,000, so it’s roughly 2% prevalence. A class of 10 would have a 1/5 chance of a positive student, and for 20 it would be 1/3. But those #s could easily be off by a factor of 2 or more.

Just extrapolating the growth rate (33%/week for cumulative cases), this Friday’s report would be for 61 new cases, 207 cumulative. If you keep going to finals, the cumulative would grow 10x – which basically means everyone gets it at some point, which won’t happen. I don’t know what quarantine capacity is, but suppose that MSU can handle a 300-case week (that’s where things fell apart at UNC). If so, the limit is reached in less than 5 weeks, just short of finals.

I’d say these numbers are discouraging. As a parent, I’m not yet concerned enough to pull my kids out, but they’re nonresidential so their exposure is low. Around classrooms on campus, compliance with masks, sanitizing and distancing is very good – certainly better than it is in town. My primary concern at present is that we don’t know what’s going on, because the published statistics are insufficient to make reliable judgments. Worse, I suspect that no one knows what’s going on, because there simply isn’t enough testing to tell. Tests are pretty cheap now, and the disruption from a surprise outbreak is enormous, so that seems penny wise and pound foolish. The next few weeks will reveal whether we are seeing random variation or the beginning of a large outbreak, but it would be far better to have enough surveillance and data transparency to know now.

A Community Coronavirus Model for Bozeman

This video explores a simple epidemic model for a community confronting coronavirus.

I built this to reflect my hometown, Bozeman MT and surrounding Gallatin County, with a population of 100,000 and no reported cases – yet. It shows the importance of an early, robust, multi-pronged approach to reducing infections. Because it’s simple, it can easily be adapted for other locations.

You can run the model using Vensim PLE or the Model Reader (or any higher version). Our getting started and running models videos provide a quick introduction to the software.

The model, in .mdl and .vpmx formats for any Vensim version:

community corona 7.zip

Update 3/12: community corona 8-mdl+vpmx.zip

There’s another copy at https://vensim.com/coronavirus/ along with links to the software.

Complexity should be the default assumption

Whether or not we can prove that a system experiences trophic cascades and other nonlinear side-effects, we should manage as if it does, because we know that these dynamics are common.

There’s been a long-running debate over whether wolf reintroduction led to a trophic cascade in Yellowstone. There’s a nice summary here:

Do Wolves Change Rivers?

Yesterday, June initiated an in depth discussion on the benefit of wolves in Yellowstone, in the form of trophic cascade with the video: How Wolves Change the River:

This was predicted by some, and has been studied by William Ripple, Robert Beschta Trophic Cascades in Yellowstone: The first fifteen years after wolf reintroduction http://www.cof.orst.edu/leopold/papers/RippleBeschtaYellowstone_BioConserv.pdf

Shannon, Roger, and Mike, voiced caution that the verdict was still out.

I would like to caution that many of the reported “positive” impacts wolves have had on the environment after coming back to Yellowstone remain unproven or are at least controversial. This is still a hotly debated topic in science but in the popular media the idea that wolves can create a Utopian environment all too often appears to be readily accepted. If anyone is interested, I think Dave Mech wrote a very interesting article about this (attached). As he puts it “the wolf is neither a saint nor a sinner except to those who want to make it so”.

Mech: Is Science in Danger of Sanctifying Wolves

Roger added

I see 2 points of caution regarding reports of wolves having “positive” impacts in Yellowstone. One is that understanding cause and effect is always hard, nigh onto impossible, when faced with changes that occur in one place at one time. We know that conditions along rivers and streams have changed in Yellowstone but how much “cause” can be attributed to wolves is impossible to determine.

Perhaps even more important is that evaluations of whether changes are “positive” or “negative” are completely human value judgements and have no basis in science, in this case in the science of ecology.

-Ely Field Naturalists

Of course, in a forum discussion, this becomes:

Wolves changed rivers.

Not they didn’t.

Yes they did.

(iterate ad nauseam)

Prove it.

… with “prove it” roughly understood to mean establishing that river = a + b*wolves, rejecting the null hypothesis that b=0 at some level of statistical significance.

I would submit that this is a poor framing of the problem. Given what we know about nonlinear dynamics in  networks like an ecosystem, it’s almost inconceivable that there would not be trophic cascades. Moreover, it’s well known that simple correlation would not be able to detect such cascades in many cases anyway.

A “no effect” default in other situations seems equally naive. Is it really plausible that a disturbance to a project would not have any knock-on effects? That stressing a person’s endocrine system would not cause a path-dependent response? I don’t think so. Somehow we need ordinary conversations to employ more sophisticated notions about models and evidence in complex systems. I think at least two ideas are useful:

  • The idea that macro behavior emerges from micro structure. The appropriate level of description of an ecosystem, or a project, is not a few time series for key populations, but an operational, physical description of how species reproduce and interact with one another, or how tasks get done.
  • A Bayesian approach to model selection, in which our belief in a particular representation of a system is proportional to the degree to which it explains the evidence, relative to various alternative formulations, not just a naive null hypothesis.

In both cases, it’s important to recognize that the formal, numerical data is not the only data applicable to the system. It’s also crucial to respect conservation laws, units of measure, extreme conditions tests and other Reality Checks that essentially constitute free data points in parts of the parameter space that are otherwise unexplored.

The way we think and talk about these systems guides the way we act. Whether or not we can prove in specific instances that Yellowstone had a trophic cascade, or the Chunnel project had unintended consequences, we need to manage these systems as if they could. Complexity needs to be the default assumption.

Future Climate of the Bridgers

Ten years ago, I explored future climate analogs for my location in Montana:

When things really warm up, to +9 degrees F (not at all implausible in the long run), 16 of the top 20 analogs are in CO and UT, …

Looking at a lot of these future climate analogs on Google Earth, their common denominator appears to be rattlesnakes. I’m sure they’re all nice places in their own way, but I’m worried about my trees. I’ll continue to hope that my back-of-the-envelope analysis is wrong, but in the meantime I’m going to hedge by managing the forest to prepare for change.

I think there’s a lot more to worry about than trees. Fire, wildlife, orchids, snowpack, water availability, …

Recently I decided to take another look, partly inspired by the Bureau of Reclamation’s publication of downscaled data. This solves some of the bias correction issues I had in 2008. I grabbed the model output (36 runs from CMIP5) and observations for the 1/8 degree gridpoint containing Bridger Bowl:

Then I used Vensim to do a little data processing, converting the daily time series (which are extremely noisy weather) into 10-year moving averages (i.e., climate). Continue reading “Future Climate of the Bridgers”

Snow is Normal in Montana

In this case, I think it’s quite literally Normal a.k.a. Gaussian:

Normally distributed snow

Here’s what I think is happening. On windless days with powder, the snow dribbles off the edge of the roof (just above the center of the hump). Flakes drift down in a random walk. The railing terminates the walk after about four feet, by which time the distribution of flake positions has already reached the Normal you’d expect from the Central Limit Theorem.

Enough of the geek stuff; I think I’ll go ski the field.