A model of COVID-19 in the US with endogenous testing, containment measures, and social distancing

Here’s another COVID-19 model. This one’s from Jack Homer of Homer Consulting. Jack is a very creative modeler, the author of some SD classics like the worker burnout model, an SD blogger, and plays a central role in important projects like Rethink Health.

The core of the model is an SEIR chain, similar to my model. This adds some nice features, including endogenous testing and a feedback decision rule for control measures. It’s parameterized for the US.
I haven’t spent significant time with the model yet, so I can’t really comment. An alarming feature of this disease is that doublings occur on the same time scale as thinking through an iteration of a model, especially if coronavirus is not your day job. I hope to add some further thoughts when I’ve thinned my backlog a bit.

From the slide deck:

Conclusions

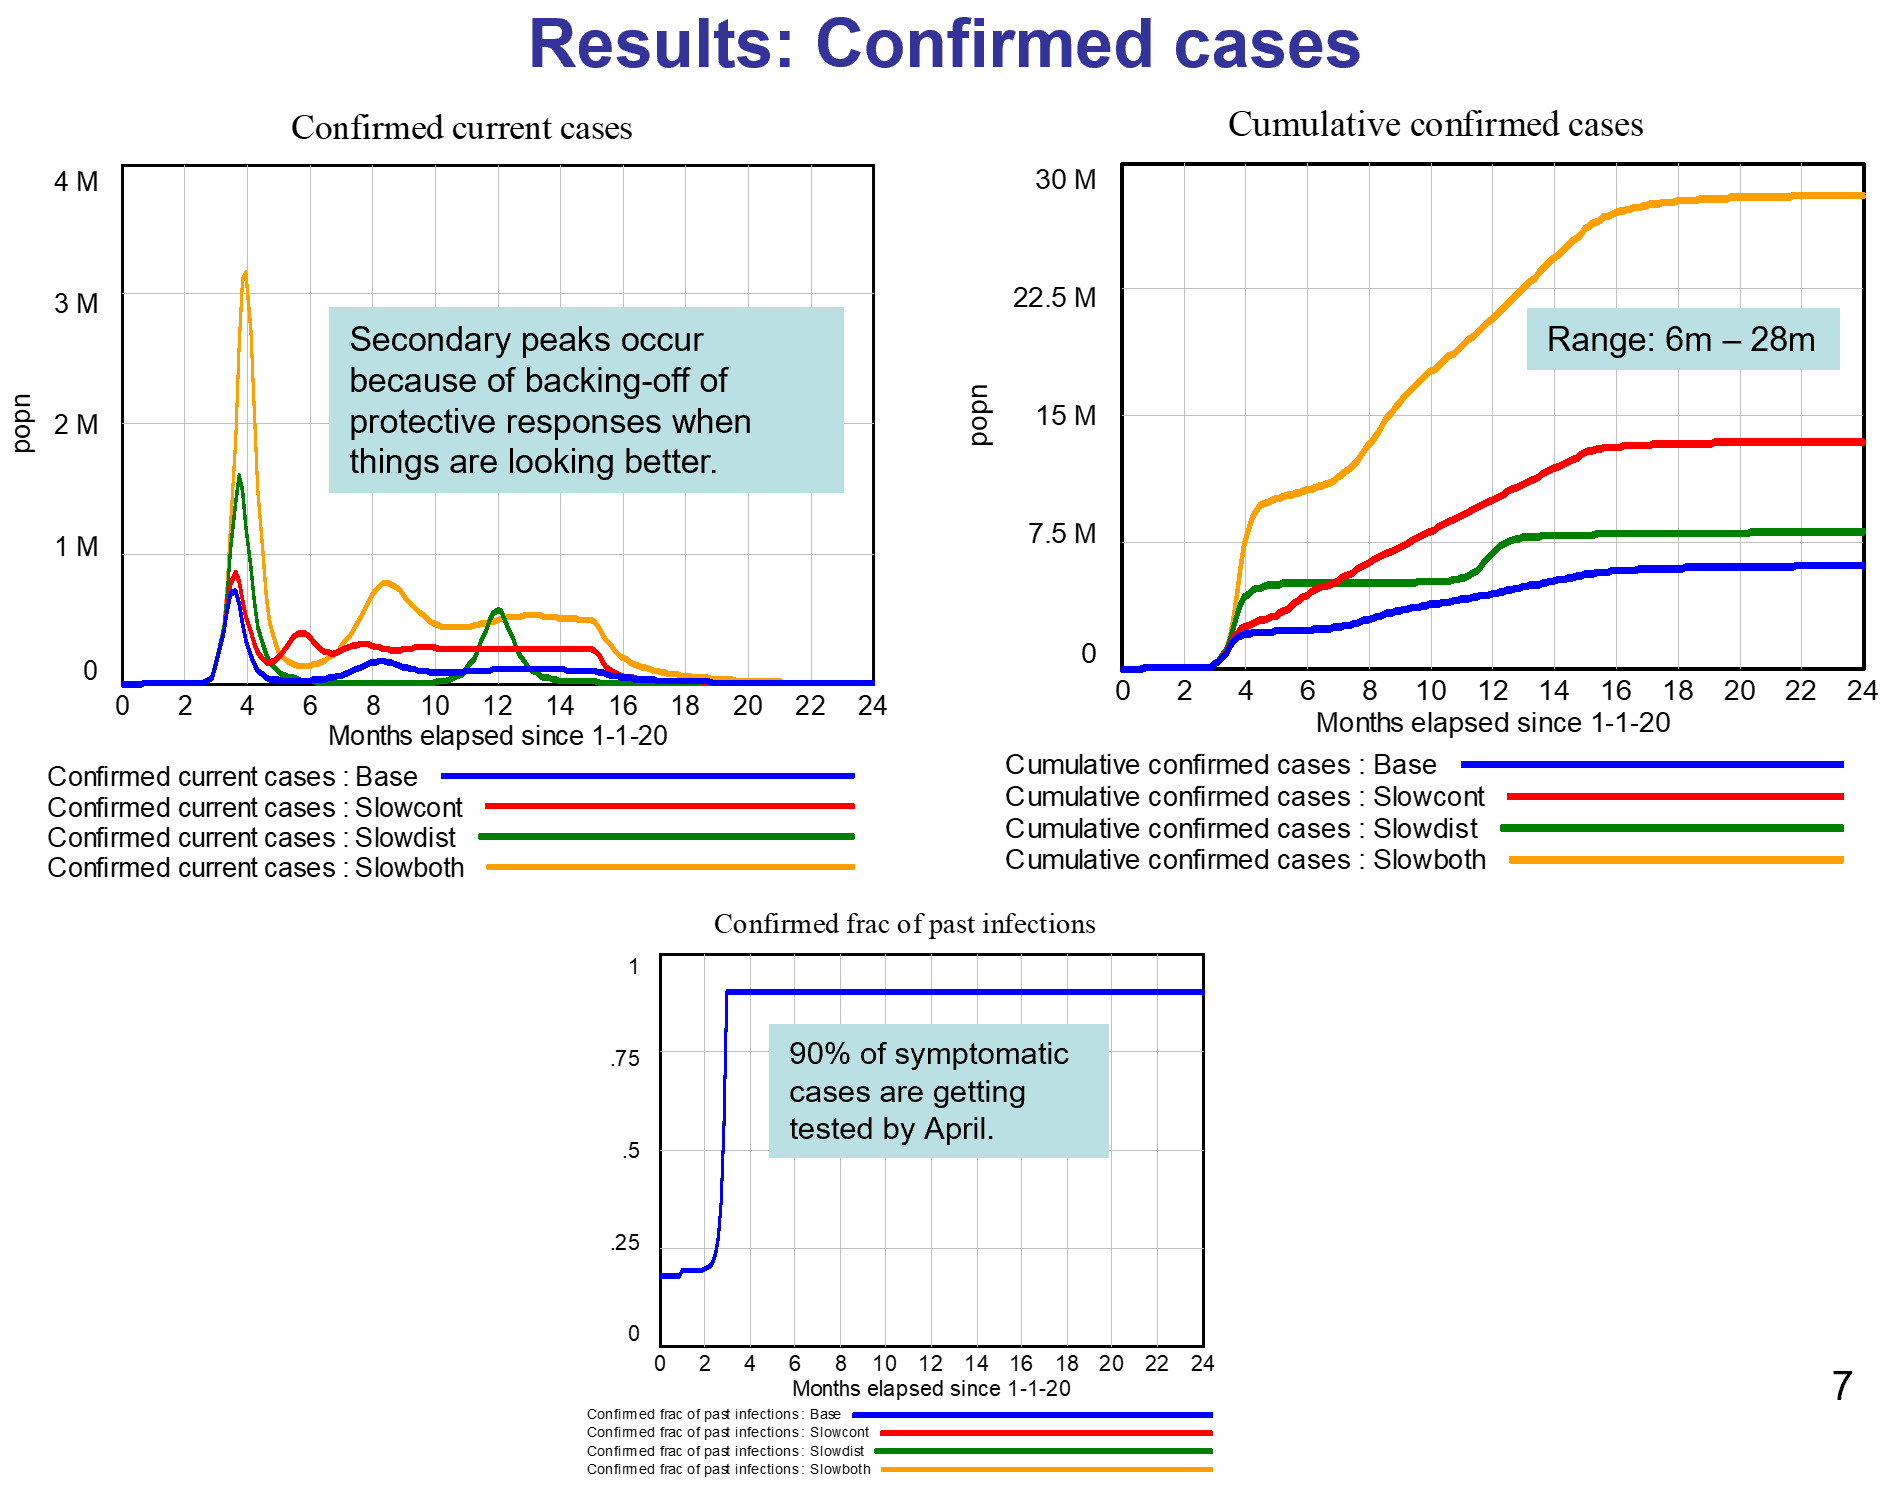
  • The results here come from a model with several key numerical assumptions, especially around behavioral responses. As the 4 runs illustrate, if the assumptions are modified, the overall results change over some range of possibility.
  • My assumptions about the behavioral responses were informed by what we been seeing recently in the US: a good response, even in regions not yet hard-hit. The message is out, and it is having an effect.
  • Because of the responses, and despite the absence of a vaccine, I conclude this epidemic will not infect a third or half of the population as some have predicted. Rather, we are likely to see 6m-28m cases in the US in total, resulting in 100k-500k deaths. This projection assumes a vaccine available by next April.
  • I also conclude that our hospital system overall has enough bed capacity to handle the peak load late April/early May; and enough ventilator capacity except during those 3 weeks in the more pessimistic Slowboth scenario. We would need 180k ventilators (rather than the assumed 120k) to avoid this shortage in the pessimistic scenario.
  • I have not addressed here the impact of containment measures and social distancing on the economy, including the supply of food and other necessities. This supply is important, affecting our ability to maintain strong containment and distancing.

This archive contains the Vensim model in mdl and vpmx format, a custom graph set (already loaded in the model), and some runs:

homerCOVID19v2.zip

A nice slide deck documenting the results:

Covid19US model jh v2.pdf

This uses data via GET XLS so it won’t work with PLE; the Model Reader will work.

Update, 3/24/2020: This version refines the model. I’ve added a copy with the data variables deleted, that should work with PLE.

Covid19US-model-jh-v2c.zip

Update, 4/27/2020:

homer v8.zip

A Community Coronavirus Model for Bozeman

This video explores a simple epidemic model for a community confronting coronavirus.

I built this to reflect my hometown, Bozeman MT and surrounding Gallatin County, with a population of 100,000 and no reported cases – yet. It shows the importance of an early, robust, multi-pronged approach to reducing infections. Because it’s simple, it can easily be adapted for other locations.

You can run the model using Vensim PLE or the Model Reader (or any higher version). Our getting started and running models videos provide a quick introduction to the software.

The model, in .mdl and .vpmx formats for any Vensim version:

community corona 7.zip

Update 3/12: community corona 8-mdl+vpmx.zip

There’s another copy at https://vensim.com/coronavirus/ along with links to the software.

4 Faces of Medical Modeling

I enjoyed the biomedical modeling plenary at #ISDC2019 more than most. I was struck by the continuum of behavior involved in the system:

  • True biomedical modeling is a bit funny, because it’s not typical System Dynamics, in the sense that it’s nonlinear dynamic simulation, but it’s not behavioral, so it’s missing one of the cornerstones of SD. Nevertheless, I think the way we think about complex systems is a useful complement to other approaches coming more from biology and mathematics (nonlinear dynamics).
  • Behavior enters one level “up”, in problems like Jim Rogers & Ed Gallaher’s work on dose titration in anemia. This is a classic case of smart people having trouble managing a system with fairly simple dynamics – essentially a single pipeline delay in the case of anemia. There may be many similar cases, where large performance improvements are available from simple models (but complicated people management).
  • Next, there are problems that combine behavioral dynamics and misperceptions of feedback with an underlying system that is also quite complex. Gizem Aktas’ work on stress and hormonal regulation is an example, as are diabetes and mental health models.
  • At the far end of the scale, there are health system models, like ReThink Health, which abstract away from the biomedical details of any particular disease. In its place, there’s an extremely complex network of human resources, incentives and decisions.

I think the opportunities are large in all of these areas. Once challenge for the field is that each requires a different interface to other researchers, health practitioners and managers. That’s a lot for relatively few modelers to manage. How can we team up to be more effective?

Confronting the dreaded blank canvas

Donella Meadows walks a class through the model conceptualization process in Creating Models from Scratch:

One interesting thing here is that she starts with a causal loop diagram. This is a case where there are some clear physical quantities of interest (people and mosquitoes), so I would probably have started with stocks and flows. (Or, I like to think I would.) But you never know how things are going to go – I can think of other situations where CLDs worked out better. The key is to stay flexible and switch methods as needed, and as the audience requires (see around 30:00 for the stock-flow implementation).

Biological Dynamics of Stress Response

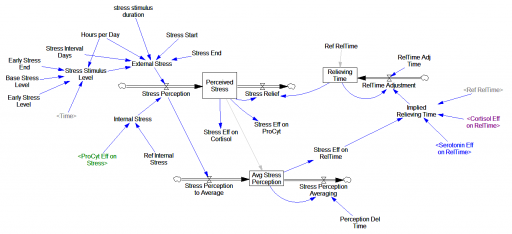
At ISDC 2018, we gave the Dana Meadows Award for best student paper to Gizem Aktas, for Modeling the Biological Mechanisms that Determine the Dynamics of Stress Response of the Human Body (with Yaman Barlas)This is a very interesting paper that elegantly synthesizes literature on stress, mood, and hormone interactions. I plan to write more about it later, but for the moment, here’s the model for your exploration.

The dynamic stress response of the human body to stressors is produced by nonlinear interactions among its physiological sub-systems. The evolutionary function of the response is to enable the body to cope with stress. However, depending on the intensity and frequency of the stressors, the mechanism may lose its function and the body can go into a pathological state. Three subsystems of the body play the most essential role in the stress response: endocrine, immune and neural systems. We constructed a simulation model of these three systems to imitate the stress response under different types of stress stimuli. Cortisol, glucocorticoid receptors, proinflammatory cytokines, serotonin, and serotonin receptors are the main variables of the model. Using both qualitative and quantitative physiological data, the model is structurally and behaviorally well-validated. In subsequent scenario runs, we have successfully replicated the development of major depression in the body. More interestingly, the model can present quantitative representation of some very well acknowledged qualitative hypotheses about the stress response of the body. This is a novel quantitative step towards the comprehension of stress response in relation with other disorders, and it provides us with a tool to design and test treatment methods.

The original is a STELLA model; here I’ve translated it to Vensim and made some convenience upgrades. I used the forthcoming XMILE translation in Vensim to open the model. You get an ugly diagram (due to platform differences and XMILE’s lack of support for flow-clouds), but it’s functional enough to browse. I cleaned up the diagrams and moved them into multiple views to take better advantage of Vensim’s visual approach.

Continue reading “Biological Dynamics of Stress Response”

Prediction, in context

I’m increasingly running into machine learning approaches to prediction in health care. A common application is identification of risks for (expensive) infections or readmission. The basic idea is to treat patients like a function approximation problem.

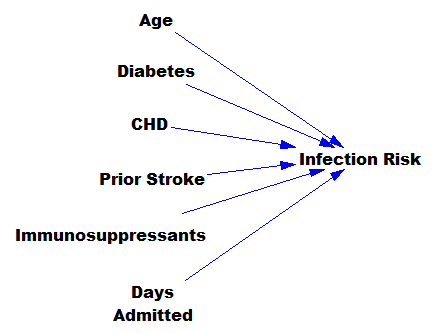
The hospital compiles a big dataset on patient demographics, health status, exposure to procedures, and infection outcomes. A vendor slurps this up and turns some algorithm loose on the data, seeking the risk factors associated with the infection. It might look like this:

… except that there might be 200 predictors, not six – more than you can handle by eyeballing scatter plots or control charts. Once you have a risk model, you know which patients to target for mitigation, and maybe also which associated factors to pursue further.

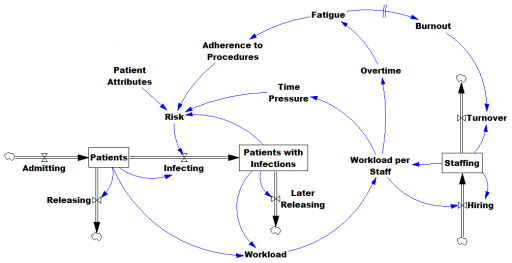
However, this is only half the battle. Systems thinkers will recognize this model as a dead buffalo: a laundry list with unidirectional causality. The real situation is rich in feedback, including a lot of things that probably don’t get measured, and therefore don’t end up in the data for consideration by the algorithm. For example:

Infections aren’t just a random event for the patient; they happen for reasons that are larger than the patient. Even worse, there are positive feedbacks that can make prevention of infections, and errors more generally, hard to manage. For example, as the number of patients with infections rises, workload goes up, which creates time pressure and fatigue. That induces shortcuts and errors that create risk for patients, leading to more infections. Infections spread to other patients. Fatigued staff burn out and turn over faster, which dilutes the staff experience that might otherwise mitigate risk. (Experience, like many other dynamics, is not shown above.)

An algorithm that predicts risk in this context is certainly useful, because anything that reduces risk helps to diminish the gain of the vicious cycles. But it’s no longer so clear what to do with the patient assessments. Time spent on staff education and action for risk mitigation has to come from somewhere, and therefore might have unintended consequences that aren’t assessed by the algorithm. The algorithm is actually blind in two ways: it can’t respond to any input (like staff fatigue or skill) that isn’t in the data, and it probably  isn’t statistically smart enough to deal with the separation of cause and effect in time and space that arises in a feedback system.

Deep learning systems like Alpha Go Zero might learn to deal with dynamics. But so far, high performance requires very large numbers of exemplars for reinforcement learning, and that’s never going to happen in a community hospital dataset. Then again, we humans aren’t too good at managing dynamic complexity either. But until the machines take over, we can build dynamic models to sort these problems out. By taking an endogenous point of view, we can put machine learning in context, refine our understanding of leverage points, and redesign systems for greater performance.

The Ryan health care proposal

The Ryan budget proposal achieves the bulk of its savings by cutting health care outlays, particularly Medicare and Medicaid. The mechanism sounds a lot like a firm’s transition from a defined benefits pension plan to a defined contribution scheme. Medicaid becomes a system of block grants to states, and Medicare becomes a system of flat-rate vouchers. Along the way, it has some useful aspirations: to separate health insurance from employment and eliminate health’s favored tax status.

Reading some of the finer print, though, I don’t think it really fixes the fundamental flaws of the current system. It’s billed as “universal access” but that’s a misnomer. It guarantees universal access to a tax credit or voucher that can be used to purchase coverage, but not universal access to coverage. That’s because it doesn’t solve the adverse selection problem. As a result, any provider that doesn’t play the usual game of excluding anyone who’s really sick from coverage (using preexisting conditions and rotating plan changes) will suffer a variant of the utility death spiral: increasing costs drive the healthy out of the plan, leaving it to serve a diminishing set of members who had the misfortune to get sick, at an escalating cost.

Universal access to coverage is left to the states, who can create assigned risk pools or other methods to cover the uncoverable. Leaving things to the states strikes me as a reasonable strategy, because the health system is so complex that evolutionary learning is likely to beat the kind of deliberate design we’ll get out of congress. But it’s not clear to me that the proposal creates any real authority to raise money to support these assigned risk pools; without money, the state mechanisms will be rather perfunctory.

The real challenge seems to me to be to address three features of health:

  • Prevention beats cure by a long shot, in terms of both cost and quality of life. In the current system, patient churn through providers eliminates most of the provider-side incentive to address this. Patients have contributed by abdicating responsibility for their own health, and insurance exacerbates the problem by obscuring the costs of the quadruple bypass that follows from a life of Big Macs.
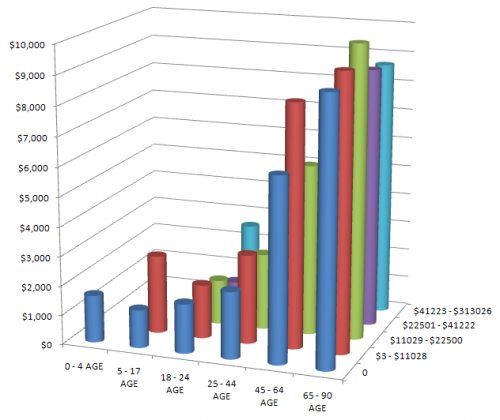
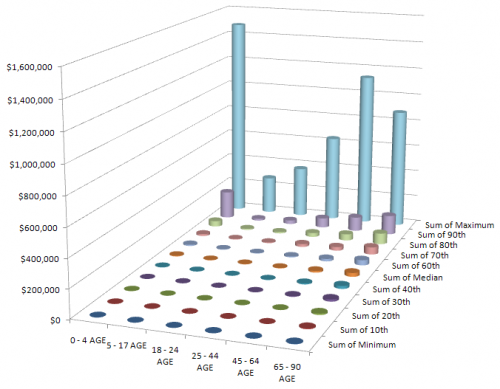
  • Health care expenditures are extremely skewed over one’s lifetime and within age cohorts. Good behavior can’t mitigate all risk, particularly the risk of getting old. (See below for a peek at the data.)
  • In some circumstances, the health care system is capable of expending an extremely large amount of resources on a person – sometimes for a miraculous outcome, and sometimes for rather marginal end-of-life extension.

What’s needed is a distributed way to share risk (which is why it’s called insurance), while preserving incentives for good behavior and matching total expenditures to resources. That’s a tall order. It’s not clear to me that the Ryan proposal tackles it in any serious way; it just extends the flaws of the current system to Medicare patients.

healthExpendAgeIncomeMEPSPer capita annual medical expenditures from the MEPS panel, by age and income. There’s surprisingly little variation by income, but a lot by age. The bill terminates the agency that collects this data.

healthExpendAgeDecileMEPSHealth expenditures by age and decile of cohort, showing the extreme concentration of expenditures at all ages.

The really fine print, the text of the bill itself, is daunting – 629 pages. This strikes me as simply unmanageable (like the deceased cap and trade legislation). There are simply too many opportunities for unintended consequences, and hidden agendas, in such a multifaceted approach, especially with the opaque analytic support available. Surely this could be tackled in a series of smaller bites – health, revenue, other expenditures. It calls to mind the criticism of the FAA’s repeated failure to redesign the air traffic control system, “you can’t design a system that evolved.” Well, maybe you can, but not with the kind of tools and discourse that now prevail.

Interactive diagrams – obesity dynamics

Food-nutrition-health-exercise-energy interactions are an amazing nest of positive feedbacks, with many win-win opportunities, but more on that another time.

Instead, I’m hoisting an interesting influence diagram about obesity from the comments. At first glance, it’s just another plate of spaghetti.

ForesightObesity

But when you follow the link (do it now), there’s an interesting innovation: the diagram is interactive. You can zoom, scroll, and highlight particular sectors and dynamics. There’s some narrative here and here. (Update: the interactive link seems to be down, but the diagram is still here: https://assets.publishing.service.gov.uk/government/uploads/system/uploads/attachment_data/file/295153/07-1177-obesity-system-atlas.pdf)

It took me a while to decide whether I’d call this a causal loop diagram or not. I think the primary distinction between a CLD and other kinds of mindmaps or process diagrams is the use of variables. On a CLD, each label represents a quantity that can vary, with a definite direction – TV Watching, Stress, Use of Medicines. Items on other kinds of diagrams might represent events or fuzzier constellations of concepts. This diagram doesn’t have link polarities (too bad) or loop polarities (which would be pretty incomprehensible anyway), but many other CLDs also avoid such labels for simplicity.

I think there’s a lot of potential for further exploration of this idea. There’s a lot you could do to relate structure to behavior, or at least to explain the rationale for structure (both shortcomings of the diagram). Each link, for example, could have its tale revealed when clicked, and key loops could be animated individually, with stories told. Drill-down could be extended to provide links between top-level subsystem relationships and more microscopic views.

I think huge diagrams like the one above are always going to be overwhelming to a layperson. Also, it’s hard to make even a small CLD good, so making a big one really accurate is tough. Therefore, I’d rather see advanced CLD presentations used to improve the communication of simpler stories, with a few loops. However, big or small, there might be many common technological benefits from dedicated diagramming software.

John Sterman on solving our biggest problems


The key message is that climate, health, and other big messy problems don’t have purely technical fixes. Therefore Manhattan Project approaches to solving them won’t work. Creating and deploying solutions to these problems requires public involvement and widespread change with distributed leadership. The challenge is to get public understanding of climate to carry the same sense of urgency that drove the civil rights movement. From a series at the IBM Almaden Institute conference.

Ultradian Oscillations of Insulin and Glucose

Citation: Jeppe Sturis, Kenneth S. Polonsky, Erik Mokilde, and Eve van Cauter. Computer Model for Mechanisms Underlying Ultradian Oscillations of Insulin and Glucose. Am. J. Physiol. 260 (Endocrinol. Metab. 23): E801-E809, 1991.

Source: Replicated by Hank Taylor

Units: No Yes!

Format: Vensim

Ultradian Oscillations of Insulin and Glucose (Vensim .vpm)

Update, 10/2017:

Refreshed, with units defined (mathematically the same as before): ultradia2.vpm ultradia2.mdl

Further refined, for initialization in equilibrium (insulin by analytic expression; glucose by parameter). Glucose infusion turned on by default. Graphs added.

ultradia-enhanced-3.mdl ultradia-enhanced-3.vpm