Why is national modeling hard?

If you’ve followed the work on the System Dynamics National Model, you know that it came to an end uncompleted. Yet, there is a vast amount of interesting structure in the model, and there have been many productive spinoffs from the work. How can this be?

I think there are several explanations. One is that the problem is intrinsically hard. Economies are big, and they operate at many scales. There are micro processes (firms investing in capacity and choosing technologies) but also evolutionary processes (firms getting it wrong die).

This means there’s no one to ask when you want to understand how things work. You can’t ask someone about their car fuel purchase habits and aggregate up to national energy intensity, because their understanding encompasses Ford vs. Chevy, not all the untried and future contingencies in the economic network beyond their limited sphere of influence.

You can’t ask the data. Data must always be interpreted through the lens of a model, and model structure is what we lack. If we had a lot more data, we might be able to infer more about the constraints on plausible structures, but economic data is pretty sparse compared to the number of constructs we need to understand.

In spite of this, dynamic general equilibrium models have managed to model whole economies anyway. Why have they succeeded? I think there are two answers. First, they cheat. They reduce all behavior to an optimization algorithm. That’s guaranteed to yield an answer, but whether that answer has any relevance to the real world is debatable. Second, they give answers that people who fund economic models like: the world is just fine as it is, externalities don’t exist, and all policy interventions are costly.

All this is not to say that we’ll never have useful national models; indeed we already have many models (including the DGEs) that are useful for some purposes. But we still have a long way to go before we have solid macrobehavior from microfoundations to inform policy broadly.


Opiod Epidemic Dynamics

I ran across an interesting dynamic model of the opioid epidemic that makes a good target for replication and critique:

Prevention of Prescription Opioid Misuse and Projected Overdose Deaths in the United States

Qiushi Chen; Marc R. Larochelle; Davis T. Weaver; et al.

Importance  Deaths due to opioid overdose have tripled in the last decade. Efforts to curb this trend have focused on restricting the prescription opioid supply; however, the near-term effects of such efforts are unknown.

Objective  To project effects of interventions to lower prescription opioid misuse on opioid overdose deaths from 2016 to 2025.

Design, Setting, and Participants  This system dynamics (mathematical) model of the US opioid epidemic projected outcomes of simulated individuals who engage in nonmedical prescription or illicit opioid use from 2016 to 2025. The analysis was performed in 2018 by retrospectively calibrating the model from 2002 to 2015 data from the National Survey on Drug Use and Health and the Centers for Disease Control and Prevention.

Conclusions and Relevance  This study’s findings suggest that interventions targeting prescription opioid misuse such as prescription monitoring programs may have a modest effect, at best, on the number of opioid overdose deaths in the near future. Additional policy interventions are urgently needed to change the course of the epidemic.

The model is fully described in supplementary content, but unfortunately it’s implemented in R and described in Greek letters, so it can’t be run directly:

That’s actually OK with me, because I think I learn more from implementing the equations myself than I do if someone hands me a working model.

While R gives you access to tremendous tools, I think it’s not a good environment for designing and testing dynamic models of significant size. You can’t easily inspect everything that’s going on, and there’s no easy facility for interactive testing. So, I was curious whether that would prove problematic in this case, because the model is small.

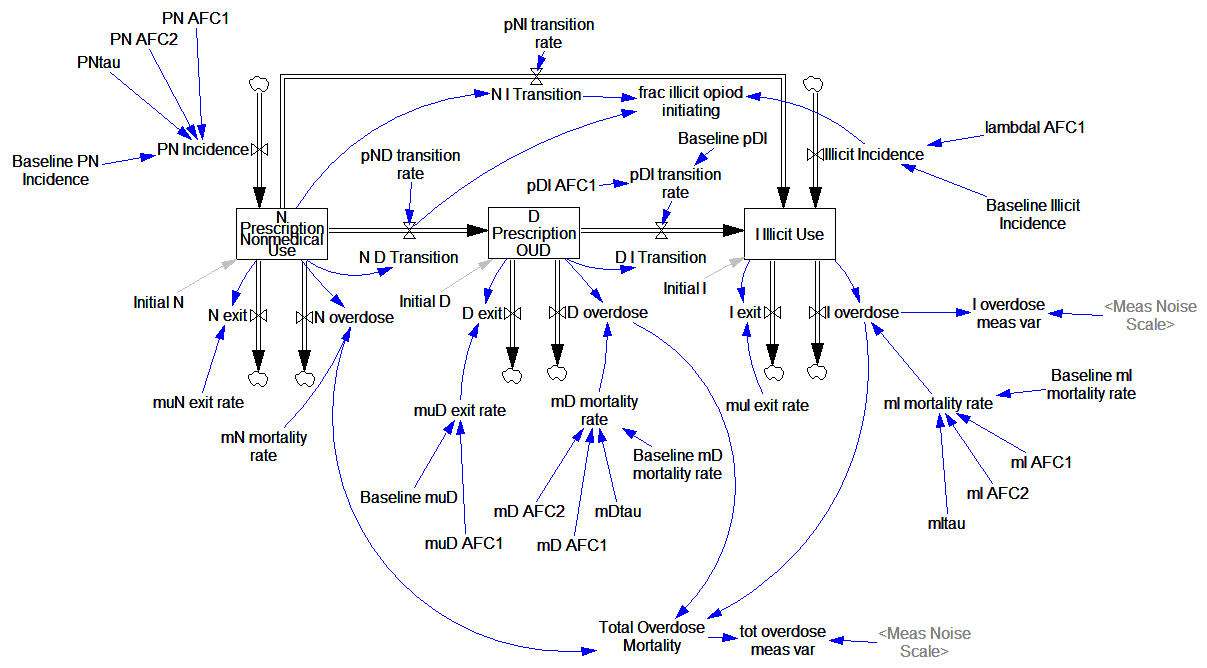
Here’s what it looks like, replicated in Vensim:

It looks complicated, but it’s not complex. It’s basically a cascade of first-order delay processes: the outflow from each stock is simply a fraction per time. There are no large-scale feedback loops. Continue reading “Opiod Epidemic Dynamics”

Challenges Sourcing Parameters for Dynamic Models

A colleague recently pointed me to this survey:

Estimating the price elasticity of fuel demand with stated preferences derived from a situational approach

It starts with a review of a variety of studies:

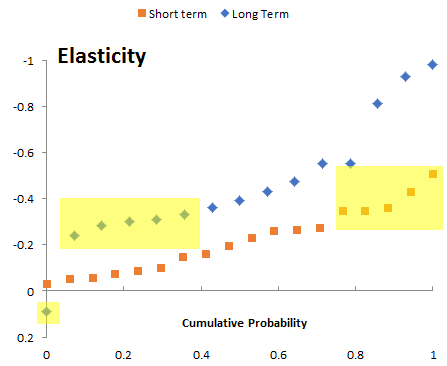
Table 1. Price elasticities of fuel demand reported in the literature, by average year of observation.

This is similar to other meta-analyses and surveys I’ve seen in the past. That means using it directly is potentially problematic. In a model, you’d typically plug the elasticity into something like the following:

Indicated fuel demand 
   = reference fuel demand * (price/reference price) ^ elasticity

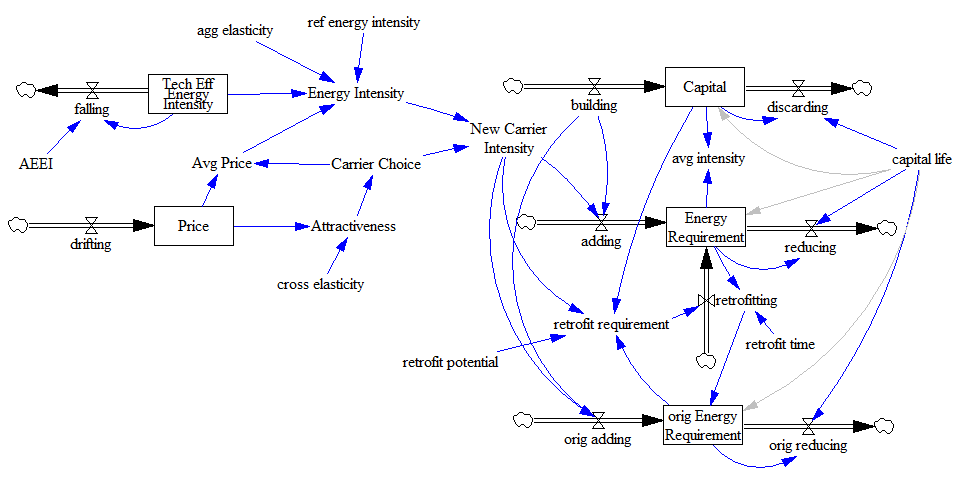
You’d probably have the expression above embedded in a larger structure, with energy requirements embodied in the capital stock, and various market-clearing feedback loops (as below). The problem is that plugging the elasticities from the literature into a dynamic model involves several treacherous leaps.

First, do the parameter values even make sense? Notice in the results above that 33% of the long term estimates have magnitude < .3, overlapping the top 25% of the short term estimates. That’s a big red flag. Do they have conflicting definitions of “short” and “long”? Are there systematic methods problems?

Second, are they robust as you plan to use them? Many of the short term estimates have magnitude <<.1, meaning that a modest supply shock would cause fuel expenditures to exceed GDP. This is primarily problem with the equation above (but that’s likely similar to what was estimated). A better formulation would consider non-constant elasticity, but most likely the data is not informative about the extremes. One of the long term estimates is even positive – I’d be interested to see the rationale for that. Perhaps fuel is a luxury good?

Third, are the parameters any good? My guess is that some of these estimates are simply violating good practice for estimating dynamic systems. The real long term response involves a lot of lags on varying time scales, from annual (perceptions of prices and behavior change) to decadal (fleet turnover, moving, mode-switching) to longer (infrastructure and urban development). Almost certainly some of this is ignored in the estimate, meaning that the true magnitude of the long term response is understated.

Stated preference estimates avoid some problems, but create others. In the short run, people have a good sense of their options and responses. But in the long term, likely not: you’re essentially asking them to mentally simulate a complex system, evaluating options that may not even exist at present. Expert judgments are subject to some of the same limitations.

I think this explains why it’s possible to build a model that’s backed up with a lot of expertise and literature at every equation, that fails to reproduce the aggregate behavior of the system. Until you’ve spend time integrating components, reconciling conflicting definitions across domains, and revisiting open-loop estimates in a closed-loop context, you don’t have an internally consistent story. Getting to that is a big part of the value of dynamic modeling.

Happy Pi Day

I like e day better, but I think I’m in the minority. Pi still makes many appearances in the analysis of dynamic systems. Anyway, here’s a cool video that links the two, avoiding the usual infinite series of Euler’s formula.

An older, shorter version is here.

Notice that the definition of e^x as a function satisfying f(x+y)=f(x)f(y) is much like reasoning from Reality Checks. The same logic gives rise to the Boltzmann distribution in the concept of temperature in partitions of thermodynamic systems.

Climate Bathtub Chartjunk

I just ran across Twist and Shout: Images and Graphs in Skeptical Climate Media, a compendium of cherry picking and other chartjunk abuses.

I think it misses a large class of (often willful) errors: ignoring the climate bathtub. Such charts typically plot CO2 emissions or concentration against temperature, with the implication that any lack of correlation indicates a problem with the science. But this engages in a combination of a pattern matching fallacy and fallacy of the single cause. Sometimes these things make it into the literature, but most live on swampy skeptic sites.

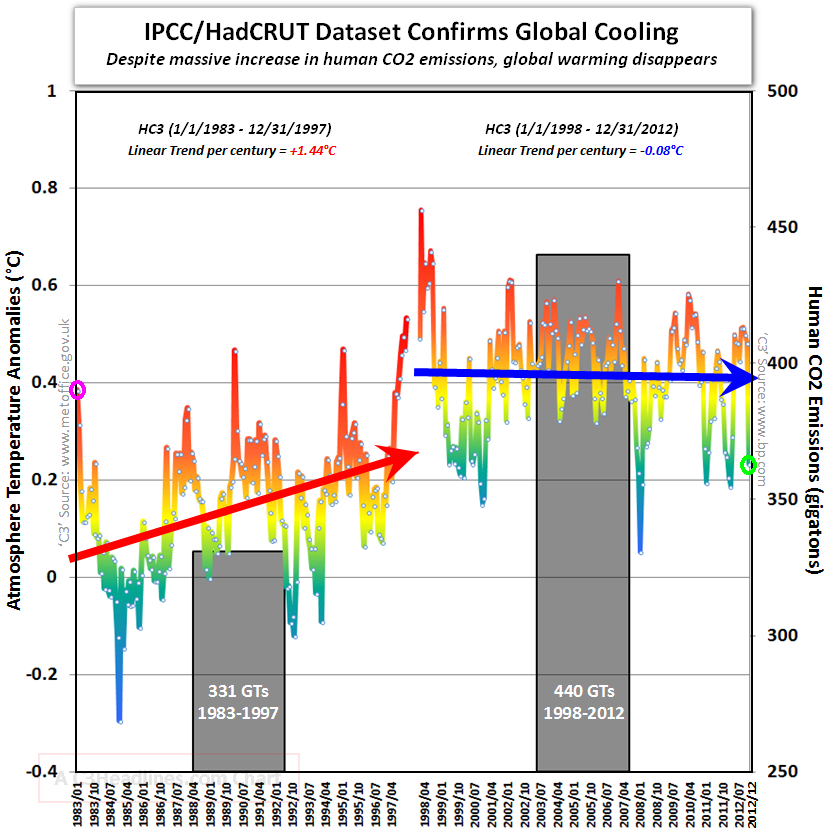
An example, reportedly from John Christy, who should know better:

Notice how we’re supposed to make a visual correlation between emissions and temperature (even though two integrations separate them, and multiple forcings and noise influence temperature). Also notice how the nonzero minimum axis crossing for CO2 exaggerates the effect. That’s in addition to the usual tricks of inserting an artificial trend break at the 1998 El Nino and truncating the rest of history.

Towards Principles for Subscripting in Models

For many aspects of models, we have well-accepted rules that define good practice. All physical stocks must have first-order negative feedback on the outflow. Normalize your lookup tables. Thou shalt balance units.

In some areas, the rules haven’t been written down. Subscripts (arrays) are the poor stepchild of dynamic models. They simply didn’t exist when simulation languages emerged, and no one really thinks about them much. They’re treated as a utility, like memory allocation in C, rather than as a key part of the model architecture. I think that needs to change, so this post is attempt to write down some guidance. Consider it a work in progress; I’d be interested in your thoughts.

What’s the Question?

There are really two kinds of questions:

  • How much detail do you want in your model? This is just the age-old problem of aggregation, which I won’t rehash in this post.
  • How do the subscripts you’re using contribute to a transparent, operational description of the system?

It’s the latter I’m concerned with. In essence: how do you implement a given level of detail so that the array structure makes sense? Continue reading “Towards Principles for Subscripting in Models”

Modeling Investigations

538 had this cool visualization of the Russia investigation in the context of Watergate, Whitewater, and other historic investigations.

The original is fun to watch, but I found it hard to understand the time dynamics from the animation. For its maturity (660 days and counting), has the Russia investigation yielded more or fewer indictments than Watergate (1492 days total)? Are the indictments petering out, or accelerating?

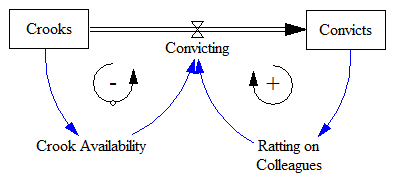
A simplified version of the problem looks a lot like an infection model (a.k.a. logistic growth or Bass diffusion):

So, the interesting question is whether we can – from partway through the history of the system – estimate the ultimate number of indictments and convictions it will yield. This is fraught with danger, especially when you have no independent information about the “physics” of the system, especially the population of potential crooks to be caught. Continue reading “Modeling Investigations”

Who cares if your model is rubbish?

All models are wrong, so does it matter if your model is more wrong than necessary?

If you’re thinking “no,” you’re not alone (but you won’t like this blog). Some models are used successfully for pure propaganda. Like the Matrix, they can be convincing for those who don’t get too curious about what lies beneath. However, if that’s all we learn to do with models, we’re doomed. The real potential of models is for improving control, by making good contingent predictions of “what might happen if we do X.”

Doing the best possible job of that involves tradeoffs among scope, depth and quality, between formal and informal methods, and between time spent modeling and time spent on everything else – data collection, group process, and execution. It’s difficult to identify the best choices for a given messy situation.

You can hide ugly aspects of a model by embedding it in a fancy interface, or by showing confidence bounds on simulations without examining individual trajectories. But if you take the low (quality) road, you’re cheating yourself, your clients and the world out of a lot of good insight.

Specifically:

  • You’ll make bad decisions.
  • You won’t learn much, or at least you won’t learn much that’s right.
  • You’ll get into trouble when you attempt to reuse or extend the model later.
  • People will find out. Maybe. (Sadly, if the situation is complex enough, they won’t.) Eventually, this may affect your credibility.
  • You will get less recognition for your work. (Models that are too large, and insufficiently robust, are the primary failure mode in the papers I review.)
  • The process will destroy your soul, or at least your brain.

That last point is the dealbreaker for me. I’m into modeling for the occasional glimpses of truth and beauty. Without that, it’s no fun. Continue reading “Who cares if your model is rubbish?”