Writing a good system dynamics paper II

It’s SD conference paper review time again. Last year I took notes while reviewing, in an attempt to capture the attributes of a good paper. A few additional thoughts:

  • No model is perfect, but it pays to ask yourself, will your model stand up to critique?
  • Model-data comparison is extremely valuable and too seldom done, but trivial tests are not interesting. Fit to data is a weak test of model validity; it’s often necessary, but never sufficient as a measure of quality. I’d much rather see the response of a model to a step input or an extreme conditions test than a model-data comparison. It’s too easy to match the model to the data with exogenous inputs, so unless I see a discussion of a multi-faceted approach to validation, I get suspicious. You might consider how your model meets the following criteria:
    • Do decision rules use information actually available to real agents in the system?
    • Would real decision makers agree with the decision rules attributed to them?
    • Does the model conserve energy, mass, people, money, and other physical quantities?
    • What happens to the behavior in extreme conditions?
    • Do physical quantities always have nonnegative values?
    • Do units balance?
  • If you have time series output, show it with graphs – it takes a lot of work to “see” the behavior in tables. On the other hand, tables can be great for other comparisons of outcomes.
  • If all of your graphs show constant values, linear increases (ramps), or exponentials, my eyes glaze over, unless you can make a compelling case that your model world is really that simple, or that people fail to appreciate the implications of those behaviors.
  • Relate behavior to structure. I don’t care what happens in scenarios unless I know why it happens. One effective way to do this is to run tests with and without certain feedback loops or sectors of the model active.
  • Discuss what lies beyond the boundary of your model. What did you leave out and why? How does this limit the applicability of the results?
  • If you explore a variety of scenarios with your model (as you should), introduce the discussion with some motivation, i.e. why are the particular scenarios tested important, realistic, etc.?
  • Take some time to clean up your model diagrams. Eliminate arrows that cross unnecessarily. Hide unimportant parameters. Use clear variable names.
  • It’s easiest to understand behavior in deterministic experiments, so I like to see those. But the real world is noisy and uncertain, so it’s also nice to see experiments with stochastic variation or Monte Carlo exploration of the parameter space. For example, there are typically many papers on water policy in the ENV thread. Water availability is contingent on precipitation, which is variable on many time scales. A system’s response to variation or extremes of precipitation is at least as important as its mean behavior.
  • Modeling aids understanding, which is intrinsically valuable, but usually the real endpoint of a modeling exercise is a decision or policy change. Sometimes, it’s enough to use the model to characterize a problem, after which the solution is obvious. More often, though, the model should be used to develop and test decision rules that solve the problem you set out to conquer. Show me some alternative strategies, discuss their limitations and advantages, and describe how they might be implemented in the real world.
  • If you say that an SD model can’t predict or forecast, be very careful. SD practitioners recognized early on that forecasting was often a fool’s errand, and that insight into behavior modes for design of robust policies was a worthier goal. However, SD is generally about building good dynamic models with appropriate representations of behavior and so forth, and good models are a prerequisite to good predictions. An SD model that’s well calibrated can forecast as well as any other method, and will likely perform better out of sample than pure statistical approaches. More importantly, experimentation with the model will reveal the limits of prediction.
  • It never hurts to look at your paper the way a reviewer will look at it.

NUMMI – an innovation killed by its host's immune system?

This American Life had a great show on the NUMMI car plant, a remarkable joint venture between Toyota and GM. It sheds light on many of the reasons for the decline of GM and the American labor movement. More generally, it’s a story of a successful innovation that failed to spread, due to policy resistance, inability to confront worse-before-better behavior and other dynamics.

I noticed elements of a lot of system dynamics work in manufacturing. Here’s a brief reading list:

Fun with Processing

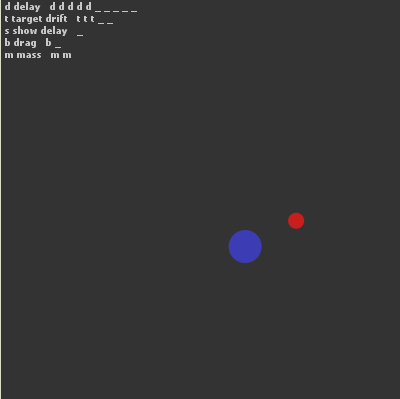
Processing is a very clean, Java-based environment targeted at information visualization and art. I got curious about it, so I built a simple interactive game that demonstrates how dynamic complexity makes system control difficult. Click through to play:

dragdot

I think there’s a lot of potential for elegant presentation with Processing. There are several physics libraries and many simulations with a physical, chemical, or mathematical basis at OpenProcessing.org:

OpenProcessing

If you like code, it’s definitely worth a look.

Dynamics of … er … flatulence

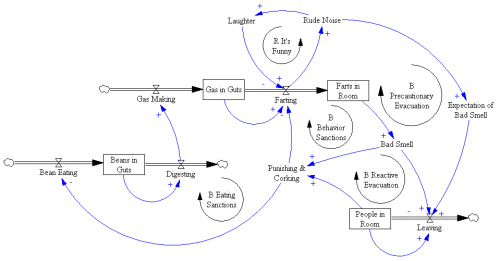
I sat down over lunch to develop a stock-flow diagram with my kids. This is what happens when you teach system dynamics to young boys:

dynamics of flatulence

Notice that there’s no outflow for the unpleasantries, because they couldn’t agree on whether the uptake mechanism was chemical reaction or physical transport.

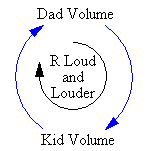
Along the way, we made a process observation. We started off quiet, but gradually talked louder and louder until we were practically shouting at each other. The boys were quick to identify the dynamic:

loud & louder

Jay Forrester always advocates tackling the biggest problems, because they’re no harder to solve than trivial ones, but sometimes it’s refreshing to lighten up and take on systems of limited importance.

Fit to data, good or evil?

The following is another extended excerpt from Jim Thompson and Jim Hines’ work on financial guarantee programs. The motivation was a client request for comparison of modeling results to data. The report pushes back a little, explaining some important limitations of model-data comparisons (though it ultimately also fulfills the request). I have a slightly different perspective, which I’ll try to indicate with some comments, but on the whole I find this to be an insightful and provocative essay.

First and Foremost, we do not want to give credence to the erroneous belief that good models match historical time series and bad models don’t. Second, we do not want to over-emphasize the importance of modeling to the process which we have undertaken, nor to imply that modeling is an end-product.

In this report we indicate why a good match between simulated and historical time series is not always important or interesting and how it can be misleading Note we are talking about comparing model output and historical time series. We do not address the separate issue of the use of data in creating computer model. In fact, we made heavy use of data in constructing our model and interpreting the output — including first hand experience, interviews, written descriptions, and time series.

This is a key point. Models that don’t report fit to data are often accused of not using any. In fact, fit to numerical data is only one of a number of tests of model quality that can be performed. Alone, it’s rather weak. In a consulting engagement, I once ran across a marketing science model that yielded a spectacular fit of sales volume against data, given advertising, price, holidays, and other inputs – R^2 of .95 or so. It turns out that the model was a linear regression, with a “seasonality” parameter for every week. Because there were only 3 years of data, those 52 parameters were largely responsible for the good fit (R^2 fell to < .7 if they were omitted). The underlying model was a linear regression that failed all kinds of reality checks.

Continue reading “Fit to data, good or evil?”

Dynamics of financial guarantee programs

Ever since the housing market fell apart, I’ve been meaning to write about some excellent work on federal financial guarantee programs, by colleagues Jim Hines (of TUI fame) and Jim Thompson.

Designing Programs that Work.

This document is part of a series reporting on a study of tederal financial guarantee programs. The study is concerned with how to design future guarantee programs so that they will be more robust, less prone to problems. Our focus has been on internal (that is. endogenous) weaknesses that might inadvertently be designed into new programs. Such weaknesses may be described in terms of causal loops. Consequently, the study is concerned with (a) identifying the causal loops that can give rise to problematic behavior patterns over time, and (b) considering how those loops might be better controlled.

Their research dates back to 1993, when I was a naive first-year PhD student, but it’s not a bit dated. Rather, it’s prescient. It considers a series of design issues that arise with the creation of government-backed entities (GBEs). From today’s perspective, many of the features identified were the seeds of the current crisis. Jim^2 identify a number of structural innovations that control the undesirable behaviors of the system. It’s evident that many of these were not implemented, and from what I can see won’t be this time around either.

There’s a sophisticated model beneath all of this work, but the presentation is a nice example of a nontechnical narrative. The story, in text and pictures, is compelling because the modeling provided internal consistency and insights that would not have been available through debate or navel rumination alone.

I don’t have time to comment too deeply, so I’ll just provide some juicy excerpts, and you can read the report for details:

The profit-lending-default spiral

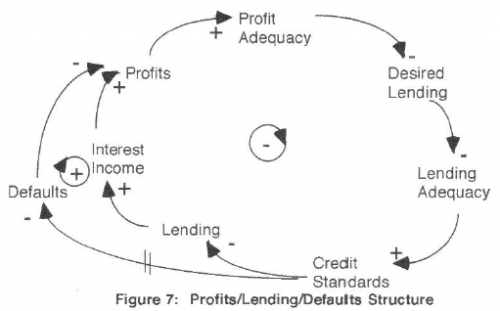
The situation described here is one in which an intended corrective process is weakened or reversed by an unintended self-reinforcing process. The corrective process is one in which inadequate profits are corrected by rising income on an increasing portfolio. The unintended self-reinforcing process is one in which inadequate profits are met with reduced credit standards which cause higher defaults and a further deterioration in profits. Because the fee and interest income lrom a loan begins to be received immediately, it may appear at first that the corrective process dominates, even if the self-reinforcing is actually dominant. Managers or regulators initially may be encouraged by the results of credit loosening and portfolio building, only to be surprised later by a rising tide of bad news.

Figure 7 - profit-lending-default spiral

As is typical, some well-intentioned policies that could mitigate the problem behavior have unpleasant side-effects. For example, adding risk-based premiums for guarantees worsens the short-term pressure on profits when standards erode, creating a positive loop that could further drive erosion.

Continue reading “Dynamics of financial guarantee programs”

Good modeling practices

Some thoughts I’ve been collecting, primarily oriented toward system dynamics modeling in Vensim, but relevant to any modeling endeavor:

  • Know why you’re building the model.
    • If you’re targeting a presentation or paper, write the skeleton first, so you know how the model will fill in the answers as you go.
  • Organize your data first.
    • No data? No problem. But surely you have some reference mode in mind, and some constraints on behavior, at least in extreme conditions.
    • In Vensim, dump it all into a spreadsheet, database, or text file and import it into a data model, using the Model>Import data… feature, GET XLS DATA functions, or ODBC.
    • Don’t put data in lookups (table functions) unless you must for some technical reason; they’re a hassle to edit and update, and lousy at distinguishing real data points from interpolation.
  • Keep a lab notebook. An open word processor while you work is useful. Write down hypotheses before you run, so that you won’t rationalize surprises. Continue reading “Good modeling practices”

Setting Up Vensim

I’m trying to adapt to the new tabbed interface in Office 2007. So far, all those pretty buttons seem like a hindrance. Vensim, on the other hand, is a bit too austere. I’ve just installed version 5.9 (check it out, and while you’re at it see the new Ventana site); my setup follows. Note that this only applies to advanced versions of Vensim.

First, I allow the equation editor to “accept enter” – I like to be able to add line breaks to equations (and hate accidentally dismissing the editor with an <enter>). You can do this anyway with <ctl><enter>, but I prefer it this way.

vensim1.png

Continue reading “Setting Up Vensim”

Writing an SD Conference Paper

It’s review time for SD conference papers again. As usual, there’s a lot of variance in quality: really good stuff, stuff that isn’t SD, and good ideas imprisoned in a bad presentation. A few thoughts on how to write a good conference paper, in no particular order:

  • Read a bunch of good SD papers, by browsing the SD Review, Dynamica, Desert Island Dynamics, or past conference plenary papers. You could do a lot worse than picking one as a model for your paper.
  • Start with: What’s the question? Why do we care? Who’s the audience? How will they be influenced? What is their prevailing mental model, and how must it change for things to improve? (If your paper is a methods paper, not a model paper, perhaps the relevant questions are different, but it’s still nice to know why I’m reading something up front.)
  • If you have a model,
    • Make sure units balance, stocks and flows are conserved, structure is robust in extreme conditions, and other good practices are followed. When in doubt, refer to Industrial Dynamics or Business Dynamics.
    • Provide a high-level diagram.
    • Describe what’s endogenous, what’s exogenous, and what’s excluded.
    • Provide some basic stats – What’s the time horizon? How many state variables are there?
    • Provide some data on the phenomena in question, or at least reference modes and a dynamic hypothesis.
    • Discuss validation – how do we know your model is any good?
    • Discuss “Which Policy Run is Best, and Who Says So?” (See DID for the reference).
    • Provide the model in supplementary material, if at all possible.
    • Use intelligible and directional variable names.
    • Clearly identify the parameter changes used to generate each run.
    • Change only one thing at a time in your simulation experiments (or more generally, use scientific method).
    • Explore uncertainty.
    • If your output shows interesting dynamics (or weird discontinuities and other artifacts), please explain.
    • Most importantly, clearly explain why things are happening by relating behavior to structure. Black-box output is boring. Causal loop diagrams or simplified stock-flow schematics may be helpful for explaining the structure of interest.
  • If you use CLDs, Read Problems with Causal Loop Diagrams and Guidelines for Drawing Causal Loop Diagrams and Chapter 5 of Business Dynamics.
  • Archetypes are a compact way to communicate a story, but don’t assume that everyone knows them all. Don’t shoehorn your problem into an archetype; if it doesn’t fit, describe the structure/behavior in its own right.
  • If you present graphs, label axes with units, clearly identify each series, etc. Follow general good practice for statistical graphics. I like lots of graphs because they’re information-rich, but each one should have a clear purpose and association with the text. Screenshots straight out of some modeling packages are not presentation-quality in my opinion.
  • I don’t think it’s always necessary to follow the standard scientific journal article format, it could even be boring, but when in doubt it’s not a bad start.
  • If your English is not the best (perhaps even if it is), at least seek help editing your abstract, so that it’s clear and succinct.
  • Ask yourself whether your paper is really about system dynamics. If you have a model, is it dynamic? Is it behavioral? Does it employ an operational description of the system under consideration? If you’re describing a method, is it applicable to (possibly nonlinear) dynamic systems? If you’re describing a process (group modeling, for example), does it involve decision making or inquiry into a dynamic system? I welcome cross-disciplinary papers, but I think pure OR papers (say, optimizing a shop-floor layout) belong at OR conferences.
  • Do a literature search, especially of the SD Review and SD bibliography, but also of literature outside the field, so that you can explain how the model/method relates to past work in SD and to different perspectives elsewhere. Usually it’s not necessary to report all the gory details of other papers though.
  • Can’t think of a topic? Replicate a classic SD model or a model from another field and critique it. See Christian Erik Kampmann, “Replication and revision of a classic system dynamics model: Critique of ‘Population Control Mechanisms’ System Dynamics Review 7(2), 1991. Or try this.
  • Rejected anyway? Don’t feel bad. Try again next year!

SD on Long Waves, Boom & Bust

Two relevant conversations from the SD email list archive:

Where are we in the long wave?

Bill Harris asks, in 2003,

… should a reasonable person think we are now in the down side of a long wave? That the tough economic times we’ve seen for the past few years will need years to work through, as levels adjust? That simple, short-term economic fixes wont work as they may have in the past? That the concerns we’ve heard about deflation should be seen in a longer context of an entire cycle, not as an isolated event to be overcome? Is there a commonly accepted date for the start of this decline?

Was Bill 5 years ahead of schedule?

Preventing the next boom and bust

Kim Warren asks, in 2001,

This is a puzzle – we take a large fraction of the very brightest and best educated people in the world, put them through 2 years of further intensive education in how business, finance and economics are supposed to work, set them to work in big consulting firms, VCs, and investment banks, pay them highly and supervise them with very experienced and equally bright managers. Yet still we manage to invent quite implausible business ideas, project unsustainable earnings and market performance, and divert huge sums of money and talented people from useful activity into a collective fantasy. Some important questions remain unanswered, like who they are, what they did, how they got away with it, and why the rest of us meekly went along with them? So the challenge to SDers in business is … where is the next bubble coming from, what will it look like, and how can we stop it?

Clearly this is one nut we haven’t cracked.