Aging Chains and the Erlang Distribution

My Delay Sandbox model illustrates the correspondence between Nth-order delays and the Erlang distribution (among other things).

Delay Sandbox

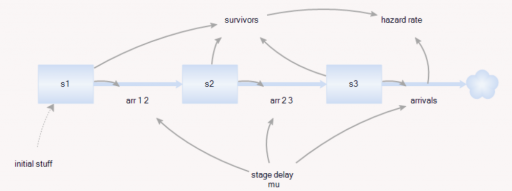
This model provides some similar insights – this time in Ventity. It’s a hybrid of classic continuous SD and agent equivalents.

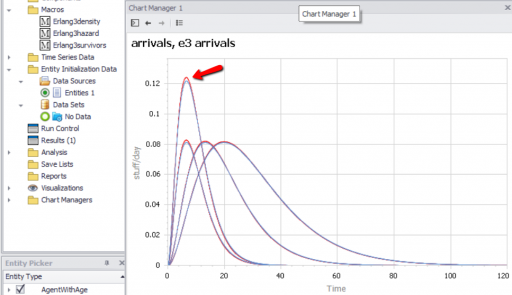
First, the Erlang3 entitytype compares the classic 3rd-order aging chain’s behavior to analytical equivalents, as in the Delay Sandbox. The analytic values are computed in a set of Ventity’s new macros:

Notice that the variances, which arise from Euler integration with a finite time step, are small enough to be uninteresting.

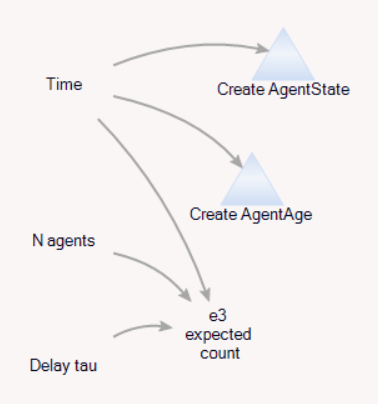
Second, the model compares the dynamics of discrete agent populations to the analytic Erlang results. To do this, the Model entity creates populations of agents at time 0, and (for comparison) computes the expected surviving population according to the Erlang distribution:

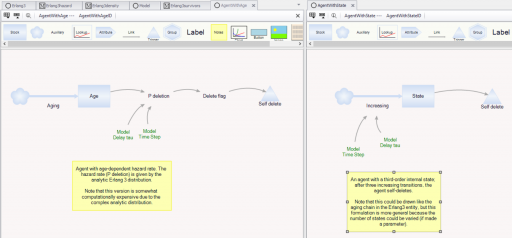
The agents live for a time, then self-delete according to two different strategies:

On the left, an agent tracks its own age, and has an age-specific probability of mortality (again, thanks to the hazard rate of the Erlang distribution). On the right, an agent has a state counter, and mortality occurs when the number of state transitions reaches 3.

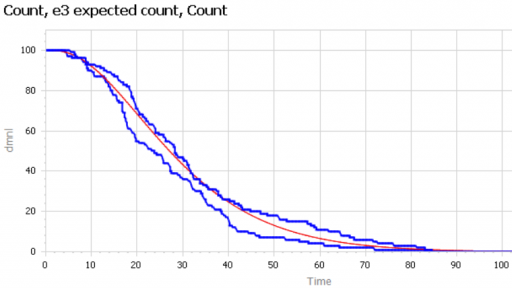
We can then compare the surviving agent populations (blue) to the Erlang expectation (red):

When the population is small (above, 100), there’s some stochastic variation around the expected result. But for larger populations, the difference is negligible.

The model: Erlang3 4 (2).zip

Nelson Rules

I ran across the Nelson Rules in a machine learning package. These are a set of heuristics for detecting changes in statistical process control. Their inclusion felt a bit like navigating a 787 with a mechanical flight computer (which is a very cool device, by the way).

The idea is pretty simple. You have a time series of measurements, normalized to Z-scores, and therefore varying (most of the time) by plus or minus 3 standard deviations. The Nelson Rules provide a way to detect anomalies: drift, oscillation, high or low variance, etc. Rule 1, for example, is just a threshold for outlier detection: it fires whenever a measurement is more than 3 SD from the mean.

In the machine learning context, it seems strange to me to use these heuristics when more powerful tests are available. This is not unlike the problem of deciding whether a random number generator is really random. It’s fairly easy to determine whether it’s producing a uniform distribution of values, but what about cycles or other long-term patterns? I spent a lot of time working on this when we replaced the RNG in Vensim. Many standard tests are available. They’re not all directly applicable, but the thinking is.

In any case, I got curious how the Nelson rules performed in the real world, so I developed a test model.

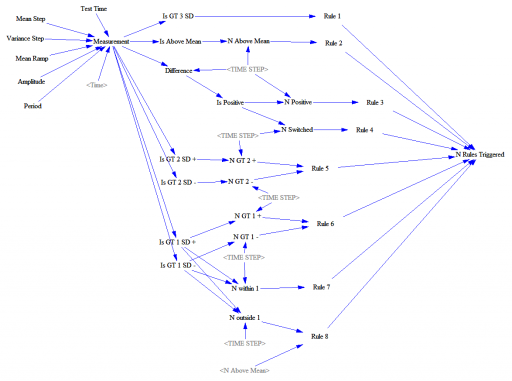
This feeds a test input (Normally distributed random values, with an optional signal superimposed) into a set of accounting variables that track metrics and compare with the rule thresholds. Some of these are complex.

Rule 4, for example, looks for 14 points with alternating differences. That’s a little tricky to track in Vensim, where we’re normally more interested in continuous time. I tackle that with the following structure:

Difference = Measurement-SMOOTH(Measurement,TIME STEP)
**************************************************************
Is Positive=IF THEN ELSE(Difference>0,1,-1)
**************************************************************
N Switched=INTEG(IF THEN ELSE(Is Positive>0 :AND: N Switched<0
,(1-2*N Switched )/TIME STEP
,IF THEN ELSE(Is Positive<0 :AND: N Switched>0
 ,(-1-2*N Switched)/TIME STEP
 ,(Is Positive-N Switched)/TIME STEP)),0)
**************************************************************
Rule 4=IF THEN ELSE(ABS(N Switched)>14,1,0)
**************************************************************

There’s a trick here. To count alternating differences, we need to know (a) the previous count, and (b) whether the previous difference encountered was positive or negative. Above, N Switched stores both pieces of information in a single stock (INTEG). That’s possible because the count is discrete and positive, so we can overload the storage by giving it the sign of the previous difference encountered.

Thus, if the current difference is negative (Is Positive < 0) and the previous difference was positive (N Switched > 0), we (a) invert the sign of the count by subtracting 2*N Switched, and (b) augment the count, here by subtracting 1 to make it more negative.

Similar tricks are used elsewhere in the structure.

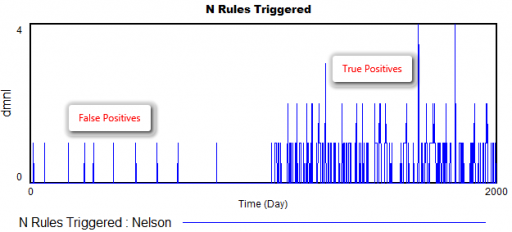
How does it perform? Surprisingly well. Here’s what happens when the measurement distribution shifts by one standard deviation halfway through the simulation:

There are a few false positives in the first 1000 days, but after the shift, there are many more detections from multiple rules.

The rules are pretty good at detecting a variety of pathologies: increases or decreases in variance, shifts in the mean, trends, and oscillations. The rules also have different false positive rates, which might be OK, as long as they catch nonoverlapping problems, and don’t have big differences in sensitivity as well. (The original article may have more to say about this – I haven’t checked.)

However, I’m pretty sure that I could develop some pathological inputs that would sneak past these rules. By contrast, I’m pretty sure I’d have a hard time sneaking anything past the NIST or Diehard RNG test suites.

If I were designing this from scratch, I’d use machine learning tools more directly – there are lots of tests for distributions, changes, trend breaks, oscillation, etc. that can be used online with a consistent likelihood interpretation and optimal false positive/negative tradeoffs.

Here’s the model:

NelsonRules1.mdl

NelsonRules1.vpm

Dynamics of the last Twinkie

When Hostess went bankrupt in 2012, there was lots of speculation about the fate of the last Twinkie, perhaps languishing on the dusty shelves of a gas station convenience store somewhere in New Mexico. Would that take ten days, ten weeks, ten years?

So, what does this have to do with system dynamics? It calls to mind the problem of modeling the inventory stockout constraint on sales. This problem dates back to Industrial Dynamics (see the variable NIR driving SSR and the discussion around figs. 15-5 and 15-7).

If there’s just one product in one inventory (i.e. one store), and visibility doesn’t matter, the constraint is pretty simple. As long as there’s one item left, sales or shipments can proceed. The constraint then is:

(1) selling = MIN(desired selling, inventory/time step)

In other words, the most that can be sold in one time step is the amount of inventory that’s actually on hand. Generically, the constraint looks like this:
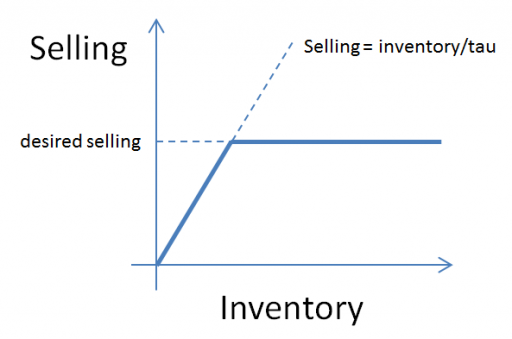
Here, tau is a time constant, that could be equal to time step (DT), as above, or could be generalized to some longer interval reflecting handling and other lags.

This can be further generalized to some kind of continuous function, like:

(2) selling = desired selling * f( inventory )

where f() is often a lookup table. This can be a bit tricky, because you have to ensure that f() goes to zero fast enough to obey the inventory/DT constraint above.

But what if you have lots of products and/or lots of inventory points, perhaps with different normal turnover rates? How does this aggregate? I built the following toy model to find out. You could easily do this in Vensim with arrays, but I found that it was ideally suited to Ventity.

Here’s the setup:

First, there’s a collection of Store entities, each with an inventory. Initial inventory is random, with a Poisson distribution, which ensures integer twinkies. Customer arrivals also have a Poisson distribution, and (optionally), the mean arrival rate varies by store. Selling is constrained to stock on hand via inventory/DT, and is also subject to a visibility effect – shelf stock influences the probability that a customer will buy a twinkie (realized with a Binomial distribution). The visibility effect saturates, so that there are diminishing returns to adding stock, as occurs when new stock goes to the back rows of the shelf, for example.
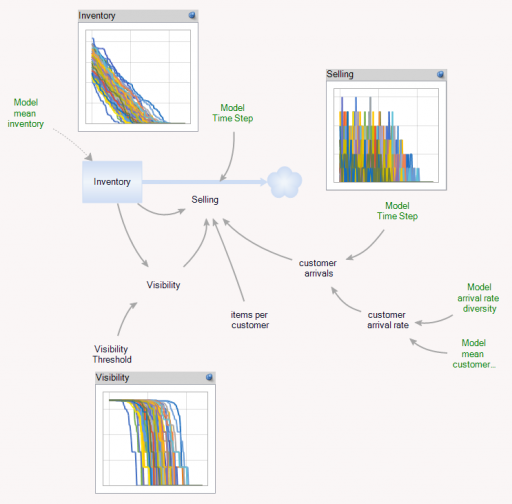
In addition, there’s an Aggregate entitytype, which is very similar to the Store, but deterministic and continuous.
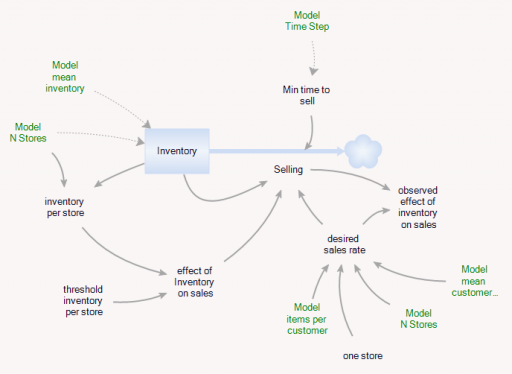
The Aggregate’s initial inventory and sales rates are set to the expected values for individual stores. Two different kinds of constraints on the inventory outflow are available: inventory/tau, and f(inventory). The sales rate simplifies to:

(3) selling = min(desired sales rate*f(inventory),Inventory/Min time to sell)

(4) min time to sell >= time step

In the Store and the Aggregate, the nonlinear effect of inventory on sales (called visibility in the store) is given by

(5) f(inventory) = 1-Exp(-Inventory/Threshold)

However, the aggregate threshold might be different from the individual store threshold (and there’s no compelling reason for the aggregate f() to match the individual f(); it was just a simple way to start).

In the Store[] collection, I calculate aggregates of the individual stores, which look quite continuous, even though the population is only 100. (There are over 100,000 gas stations in the US.)
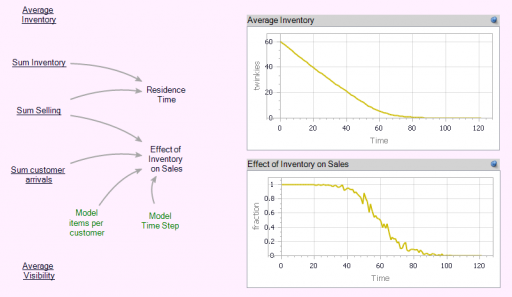
Notice that the time series behavior of the effect of inventory on sales is sigmoid.

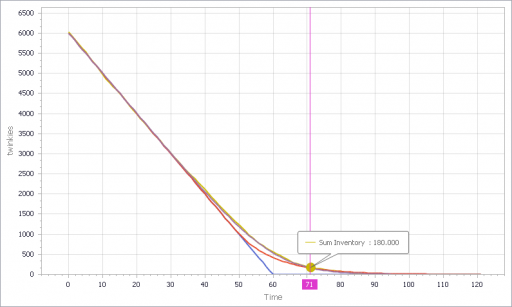
Now we can compare individual and aggregate behavior:

Inventory
Selling
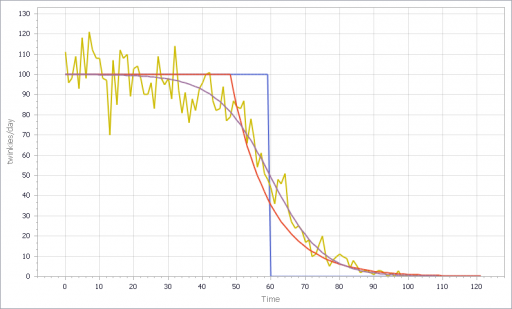
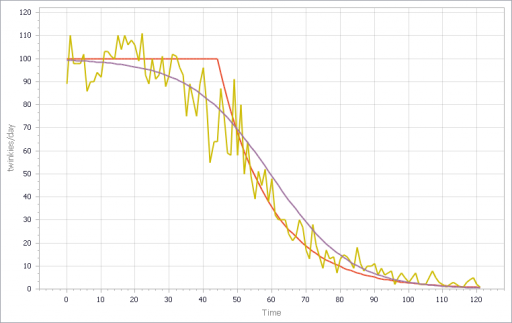
The noisy yellow line is the sum of the individual Stores. The blue line arises from imposing a hard cutoff, equation (1) above. This is like assuming that all stores are equal, and inventory doesn’t affect sales, until it’s gone. Clearly it’s not a great fit, though it might be an adequate shortcut where inventory dynamics are not really the focus of a model.

The red line also imposes an inventory/tau constraint, but the time constant (tau) is much longer than the time step, at 8 days (time step = 1 day). Finally, the purple sigmoid line arises from imposing the nonlinear f(inventory) constraint. It’s quite a good fit, but the threshold for the aggregate must be about twice as big as for the individual Stores.

However, if you parameterize f() poorly, and omit the inventory/tau constraint, you get what appear to be chaotic oscillations – cool, but obviously unphysical:
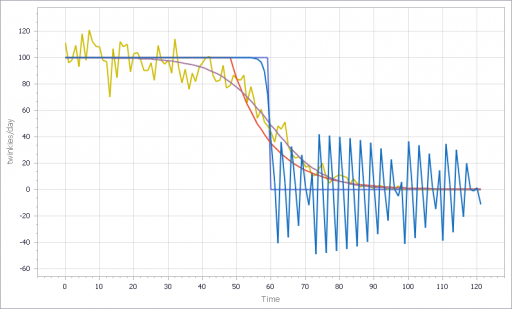
If, in addition, you add diversity in Store’s customer arrival rates, you get a longer tail on inventory. That last Twinkie is likely to be in a low-traffic outlet. This makes it a little tougher to fit all parts of the curve:
I think there are some interesting questions here, that would make a great paper for the SD conference:

  • (Under what conditions) can you derive the functional form of the aggregate constraint from the properties of the individual Stores?
  • When do the deficiencies of shortcut approaches, that may lack smooth derivatives, matter in aggregate models like Industrial dynamics?
  • What are the practical implications for marketing models?
  • What can you infer about inventory levels from aggregate data alone?
  • Is that really chaos?

Have at it!

The Ventity model: LastTwinkie1.zip
Forrester on Continuous Flows

I just published three short videos with sample models, illustrating representation of discrete and random events in Vensim.

Jay Forrester‘s advice from Industrial Dynamics is still highly relevant. Here’s an excerpt:

Chapter 5, Principles for Formulating Models

5.5 Continuous Flows

In formulating a model of an industrial operation, we suggest that the system be treated, at least initially, on the basis of continuous flows and interactions of the variables. Discreteness of events is entirely compatible with the concept of information-feedback systems, but we must be on guard against unnecessarily cluttering our formulation with the detail of discrete events that only obscure the momentum and continuity exhibited by our industrial systems.

In beginning, decisions should be formulated in the model as if they were continuously (but not implying instantaneously) responsive to the factors on which they are based. This means that decisions will not be formulated for intermittent reconsideration each week, month or year. For example, factory production capacity would vary continuously, not by discrete additions. Ordering would go on continuously, not monthly when the stock records are reviewed.

There are several reasons for recommending the initial formulation of a continuous model:

  • Real systems are more nearly continuous than is commonly supposed …
  • There will usually be considerable “aggregation” …
  • A continuous-flow system is usually an effective first approximation …
  • There is a natural tendency of model builders and executives to overstress the discontinuities of real situations. …
  • A continuous-flow model helps to concentrate attention on the central framework of the system. …
  • As a starting point, the dynamics of the continuous-flow model are usually easier to understand …
  • A discontinuous model, which is evaluated at infrequent intervals, such as an economic model solved for a new set of values annually, should never be justified by the fact that data in the real system have been collected at such infrequent intervals. …

These comments should never be construed as suggesting that the model builder should lack interest in the microscopic separate events that occur in a continuous-flow channel. The course of the continuous flow is the course of the separate events in it. By studying individual events we get a picture of how decisions are made and how the flows are delayed. The study of individual events is on of our richest sources of information about the way the flow channels of the model should be constructed. When a decision is actually being made regularly on a periodic basis, like once a month, the continuous-flow equivalent channel should contain a delay of half the interval; this represents the average delay encountered by information in the channel.

The preceding comments do not imply that discreteness is difficult to represent, nor that it should forever be excluded from a model. At times it will become significant. For example, it may create a disturbance that will cause system fluctuations that can be mistakenly interreted as externally generated cycles (…). When a model has progressed to the point where such refinements are justified, and there is reason to believe that discreteness has a significant influence on system behavior, discontinuous variables should then be explored to determine their effect on the model.

[Ellipses added – see the original for elaboration.]

Early warnings of catastrophe

Catastrophic Collapse Can Occur without Early Warning: Examples of Silent Catastrophes in Structured Ecological Models (PLOS ONE – open access)

Catastrophic and sudden collapses of ecosystems are sometimes preceded by early warning signals that potentially could be used to predict and prevent a forthcoming catastrophe. Universality of these early warning signals has been proposed, but no formal proof has been provided. Here, we show that in relatively simple ecological models the most commonly used early warning signals for a catastrophic collapse can be silent. We underpin the mathematical reason for this phenomenon, which involves the direction of the eigenvectors of the system. Our results demonstrate that claims on the universality of early warning signals are not correct, and that catastrophic collapses can occur without prior warning. In order to correctly predict a collapse and determine whether early warning signals precede the collapse, detailed knowledge of the mathematical structure of the approaching bifurcation is necessary. Unfortunately, such knowledge is often only obtained after the collapse has already occurred.

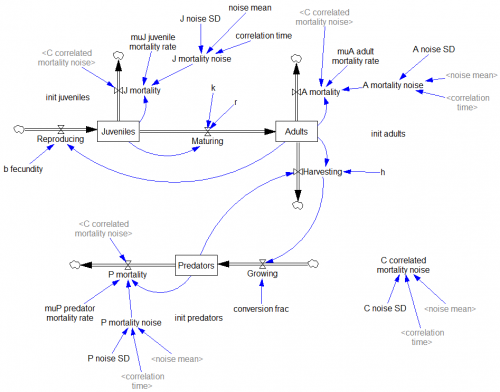
This is a third-order ecological model with juvenile and adult prey and a predator:

See my related blog post on the topic, in which I also mention a generic model of critical slowing down.

The model, with changes files (.cin) implementing some of the experiments: CatastropheWarning.zip

Stochastic Processes

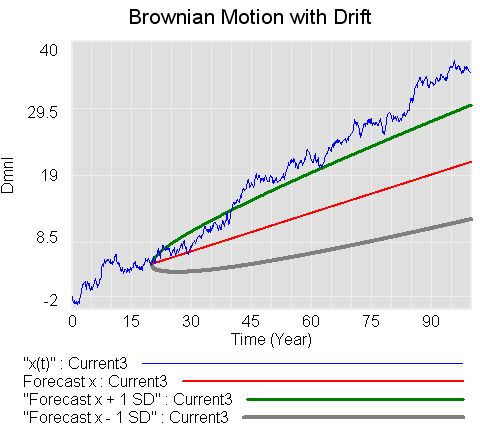
This model replicates a number of the stochastic processes from Dixit & Pindyck’s Investment Under Uncertainty. It includes Brownian motion (Wiener process), geometric Brownian motion, mean-reverting and jump processes, plus forecast confidence bounds for some variations.

Units balance, but after updating this model I’ve decided that there may be a conceptual issue, related to the interpretation of units in parameters of the Brownian process variants. This arises due to the fact that the parameter sigma represents the standard deviation at unit time, and that some of the derivations gloss over units associated with substitutions of dz=epsilon*SQRT(dt). I don’t think these are of practical importance, but will revisit the question in the future. This is what happens when you let economists get hold of engineers’ math. 🙂

These structures would be handy if made into :MACRO:s for reuse.

stochastic processes 3.mdl (requires an advanced version of Vensim)

stochastic processes 3.vpm (published package; includes a sensitivity setup for varying NOISE SEED)

stochastic processes 3 PLE.mdl (Runs in PLE, omits only one equation of low importance)

Polya urn with increasing returns

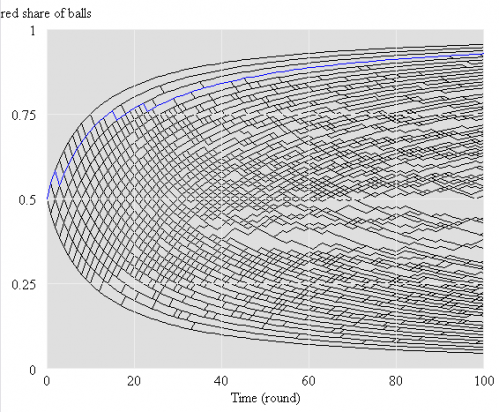
This set of models performs a variant of a Polya urn experiment, along the lines of that described in Bryan Arthur’s Increasing Returns and Path Dependence in the Economy, Chapter 10. There’s a small difference, which is that samples are drawn with replacement (Bernoulli distribution) rather than without (hypergeometric distribution).

The interesting dynamics arise from competing positive feedback loops through the stocks of red and white balls. There’s useful related reading at http://tuvalu.santafe.edu/~wbarthur/Papers/Papers.html

I did the physical version of this experiment with Legos with my kids:

I tried the Polya urns experiment over lunch. We put 5 red and 5 white legos in a bowl, then took turns drawing a sample of 5. We returned the sample to the bowl, plus one lego of whichever color dominated the sample. Iterate. At the start, and after 2 or 3 rounds, I solicited guesses about what would happen. Gratifyingly, the consensus was that the bowl would remain roughly evenly divided between red and white. After a few more rounds, the reality began to diverge, and we stopped when white had a solid 2:1 advantage. I wondered aloud whether using a larger or smaller sample would lead to faster convergence. With no consensus about the answer, we tried it – drawing samples of just 1 lego. I think the experimental outcome was somewhat inconclusive – we quickly reached dominance of red, but the sampling process was much faster, so it may have actually taken more rounds to achieve that. There’s a lot of variation possible in the outcome, which means that superstitious learning is a possible trap.

This model automates the experiment, which makes it easier and more reliable to explore questions like the sensitivity of the rate of divergence to the sample size.

PolyaUrn.vpm

This version works with Vensim PLE (though it’s not supposed to, because it uses the RANDOM BERNOULLI function). It performs a single experiment per run, but includes sensitivity control files for performing hundreds of runs at a time (requires PLE Plus). That makes for a nice map of outcomes:

Continue reading “Polya urn with increasing returns”

Delay Sandbox

There’s a handy rule of thumb for estimating how much of the input to a first order delay has propagated through as output: after three time constants, 95%. (This is the same as the rule for estimating how much material has left a stock that is decaying exponentially – about a 2/3 after one lifetime, 85% after two, 95% after three, and 99% after five lifetimes.)

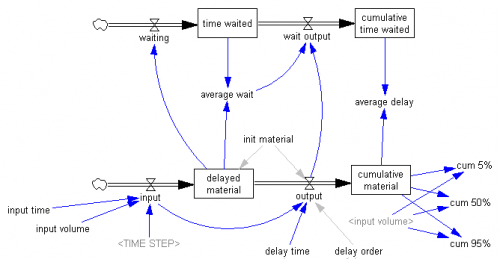
I recently wanted rules of thumb for other delay structures (third order or higher), so I built myself a simple model to facilitate playing with delays. It uses Vensim’s DELAY N function, to make it easy to change the delay order.

Here’s the structure:

Continue reading “Delay Sandbox”

Cumulative Normal Distribution

Vensim doesn’t have a function for the cumulative normal distribution, but it’s easy to implement via a macro. I used to use a polynomial cited in Numerical Recipes (error function, Ch. 6.2):

:MACRO: NCDF(x)
NCDF = 1-Complementary Normal CDF
~	dmnl
~		|
Complementary Normal CDF=
ERFCy/2
~	dmnl
~		|
ERFCy = IF THEN ELSE(y>=0,ans,2-ans)
~	dmnl
~	http://www.library.cornell.edu/nr/bookcpdf/c6-2.pdf
|
y = x/sqrt(2)
~	dmnl
~		|
ans=t*exp(-z*z-1.26551+t*(1.00002+t*(0.374092+t*(0.0967842+
t*(-0.186288+t*(0.278868+t*(-1.1352+t*(1.48852+
t*(-0.822152+t*0.170873)))))))))
~	dmnl
~		|
t=1/(1+0.5*z)
~	dmnl
~		|
z = ABS(y)
~	dmnl
~		|
:END OF MACRO:

I recently discovered a better approximation here, from algorithm 26.2.17 in Abromowitz and Stegun, Handbook of Mathematical Functions:

:MACRO: NCDF2(x)
NCDF2 =  IF THEN ELSE(x >= 0,
(1 - c * exp( -x * x / 2 ) * t *
( t *( t * ( t * ( t * b5 + b4 ) + b3 ) + b2 ) + b1 )),  ( c * exp( -x * x / 2 ) * t *
( t *( t * ( t * ( t * b5 + b4 ) + b3 ) + b2 ) + b1 ))
)
~     dmnl
~     From http://www.sitmo.com/doc/Calculating_the_Cumulative_Normal_Distribution
Implements algorithm 26.2.17 from Abromowitz and Stegun, Handbook of Mathematical 
Functions. It has a maximum absolute error of 7.5e^-8.
http://www.math.sfu.ca/
|
c  =  0.398942
~     dmnl
~           |
t = IF THEN ELSE( x >= 0, 1/(1+p*x), 1/(1-p*x))
~     dmnl
~           |
b5 =  1.33027
~     dmnl
~           |
b4 = -1.82126
~     dmnl
~           |
b3 =  1.78148
~     dmnl
~           |
b2 = -0.356564
~     dmnl
~           |
b1 =  0.319382
~     dmnl
~           |
p  =  0.231642
~     dmnl
~           |
:END OF MACRO:

In advanced Vensim versions, paste the macro into the header of your model (View>As Text). Otherwise, you can implement the equations inside the macro directly in your model.