Algebra, Eroding Goals and Systems Thinking

A NY Times editorial wonders, Is Algebra Necessary?*

I think the short answer is, “yes.”

The basic point of having a brain is to predict the consequences of actions before taking them, particularly where those actions might be expensive or fatal. There are two ways to approach this:

  • pattern matching or reinforcement learning – hopefully with storytelling as a conduit for cumulative experience with bad judgment on the part of some to inform the future good judgment of others.
  • inference from operational specifications of the structure of systems, i.e. simulation, mental or formal, on the basis of theory.

If you lack a bit of algebra and calculus, you’re essentially limited to the first option. That’s bad, because a lot of situations require the second for decent performance.

The evidence the article amasses to support abandonment of algebra does not address the fundamental utility of algebra. It comes in two flavors:

  • no one needs to solve certain arcane formulae
  • setting the bar too high for algebra discourages large numbers of students

I think too much reliance on the second point risks creating an eroding goals trap. If you can’t raise the performance, lower the standard:

eroding goals
B. Jana, Wikimedia Commons, Creative Commons Attribution-Share Alike 3.0 Unported

This is potentially dangerous, particularly when you also consider that math performance is coupled with a lot of reinforcing feedback.

As an alternative to formal algebra, the editorial suggests more practical math,

It could, for example, teach students how the Consumer Price Index is computed, what is included and how each item in the index is weighted — and include discussion about which items should be included and what weights they should be given.

I can’t really fathom how one could discuss weighting the CPI in a meaningful way without some elementary algebra, so it seems to me that this doesn’t really solve the problem.

However, I think there is a bit of wisdom here. What earthly purpose does solving the quadratic formula serve, until one is able to map that to some practical problem space? There is growing evidence that even high-performing college students can manipulate symbols without gaining the underlying intuition needed to solve real-world problems.

I think the obvious conclusion is not that we should give up on teaching algebra, but that we should teach it quite differently. It should emerge as a practical requirement, motivated by a student-driven search for the secrets of life and systems thinking in particular.

* Thanks to Richard Dudley for pointing this out.

Is Algebra Necessary?

The Capen Quiz at the System Dynamics Conference

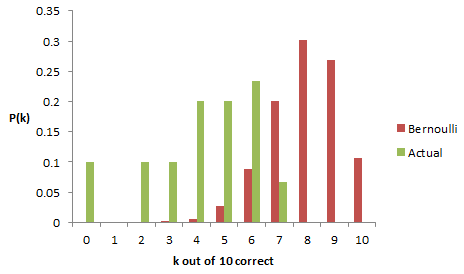
I ran my updated Capen quiz at the beginning of my Vensim mini-course on optimization and uncertainty at the System Dynamics conference. The results were pretty typical – people expressed confidence bounds that were too narrow compared to their actual knowledge of the questions. Thus their effective confidence was at the 40% level rather than the 80% level desired. Here’s the distribution of actual scores from about 30 people, compared to a Binomial (10,.8) distribution:

(I’m going from memory here on the actual distribution, because I forgot to grab the flipchart of results. Did anyone take a picture? I won’t trouble you with my confidence bounds on the the confidence bounds.)

My take on this is that it’s simply very hard to be well-calibrated intuitively, unless you dedicate time for explicit contemplation of uncertainty. But it is a learnable skill – my kids, who had taken the original Capen quiz, managed to score 7 out of 10.

Even if you can get calibrated on a set of independent questions, real-world problems where dimensions covary are really tough to handle intuitively. This is yet another example of why you need a model.

Spot the health care smokescreen

A Tea Party presentation on health care making the rounds in Montana claims that life expectancy is a smoke screen, and it’s death rates we should be looking at. The implication is that we shouldn’t envy Japan’s longer life expectancy, because the US has lower death rates, indicating superior performance of our health care system.

Which metric really makes the most sense from a systems perspective?

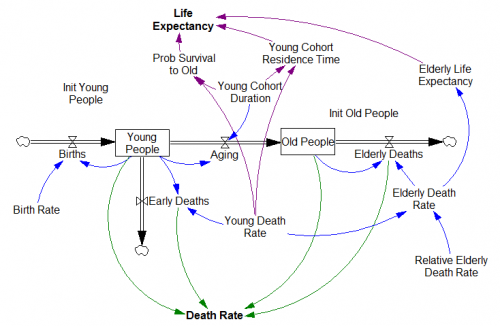
Here’s a simple, 2nd order model of life and death:

From the structure, you can immediately observe something important: life expectancy is a function only of parameters, while the death rate also includes the system states. In other words, life expectancy reflects the expected life trajectory of a person, given structure and parameters, while the aggregate death rate weights parameters (cohort death rates) by the system state (the distribution of population between old and young).

In the long run, the two metrics tell you the same thing, because the system comes into equilibrium such that the death rate is the inverse of the life expectancy. But people live a long time, so it might take decades or even centuries to achieve that equilibrium. In the meantime, the death rate can take on any value between the death rates of the young and old cohorts, which is not really helpful for understanding what a new person can expect out of life.

So, to the extent that health care performance is visible in the system trajectory at all, and not confounded by lifestyle choices, life expectancy is the metric that tells you about performance, and the aggregate death rate is the smokescreen.

Here’s the model: LifeExpectancyDeathRate.mdl or LifeExpectancyDeathRate.vpm

It’s initialized in equilibrium. You can explore disequilbrium situations by varying the initial population distribution (Init Young People & Init Old People), or testing step changes in the death rates.

False positives, publication bias and systems models

A PLOS Medicine paper asserts that most published results are false.

It can be proven that most claimed research findings are false

Corollary 1: The smaller the studies conducted in a scientific field, the less likely the research findings are to be true.

Corollary 2: The smaller the effect sizes in a scientific field, the less likely the research findings are to be true.

Corollary 3: The greater the number and the lesser the selection of tested relationships in a scientific field, the less likely the research findings are to be true.

Corollary 4: The greater the flexibility in designs, definitions, outcomes, and analytical modes in a scientific field, the less likely the research findings are to be true.

Corollary 5: The greater the financial and other interests and prejudices in a scientific field, the less likely the research findings are to be true.

Corollary 6: The hotter a scientific field (with more scientific teams involved), the less likely the research findings are to be true.

This somewhat alarming result arises from fairly simple statistics of false positives, publication selection bias, and causation vs. correlation problems. While the math is incontrovertible, some of the assumptions have been challenged:

… calculating the unreliability of the medical research literature, in whole or in part, requires more empirical evidence and different inferential models than were used. The claim that “most research findings are false for most research designs and for most fields” must be considered as yet unproven.

Still, the argument seems to be a matter of how much rather than whether publication bias influences findings:

We agree with the paper’s conclusions and recommendations that many medical research findings are less definitive than readers suspect, that P-values are widely misinterpreted, that bias of various forms is widespread, that multiple approaches are needed to prevent the literature from being systematically biased and the need for more data on the prevalence of false claims.

(Others propose similar challenges. There’s conflicting literature about whether (weak) observational studies hold up with (strong) randomized follow-up trials.)

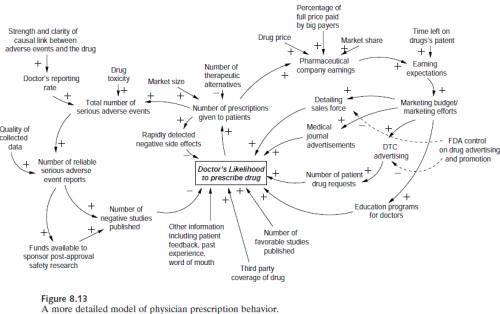
This is obviously a big problem from a control perspective, because the kind of information provided by the studies in question is key to managing many systems, as in Nancy Leveson‘s pharma safety example:
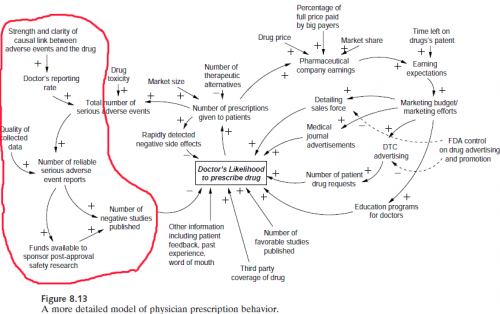
It’s also leads me to a rather pointed self-question. To what extent is typical system dynamics modeling practice subject to the same kinds of biases? Can we say not only that all models are wrong, but that most are useless?

First the good news.

  • SD doesn’t usually operate in the data mining space, where large observational studies seek effects absent any a priori causal theory. That means we’re not operating where false positives are most likely to arise.
  • Often, SD practitioners are not testing our own pet theories, but those of some decision makers – perhaps even theories of competing interests in an organization.
  • SD models play a “knowledge integration” role that’s somewhat analogous to meta-analysis. A meta-analysis pools the statistics from a number of replications of some observation, which improves the signal to noise ratio, making it easier to see whether there’s any baby in the bathwater. An SD model instead pools the effect sizes of inputs (studies or anecdotes) and puts them to a functional test: do the individual components, assembled into a system, yield the observed behavior of the macro system?
  • Similarly, good SD modelers tend to supplement purely statistical inputs with Reality Checks that effectively provide additional data verification by testing extreme conditions where outcomes are known (though this is not helpful if you don’t know anything about relationships to begin with).
  • Including physics (using the term loosely to include things like conservation of people) in models also greatly constrains the space of plausible hypotheses a priori.

Now the bad news.

  • Models are often used in one-off, non-replicable strategic decision making situations, so we’ll never know. Refereed forecasting helps, but success can still be due to luck rather than skill.
  • We often have to formalize soft variable concepts for which definitions are uncertain and measurements are lacking.
  • SD models are often reliant on thin literature bases, small studies, or subject matter expertise to establish relationships. Studies with randomized control are a rarity.
  • Available data for model verification is often of low quality and short duration.
  • Data can provide a weak check on the model – if a system exhibits exponential growth, for example, one positive feedback loop in the dynamic hypothesis is as good as another (though of course good a priori explanations of the structure of the system help).

My suspicion is that savvy modelers are already well aware of just how messy and uncertain their problem domains are. Decisions will be taken, with or without a model, so the real objective is to use the model to add value by rejecting ideas that don’t work. The problem then is not that wrong models make decisions worse, but that we could probably do a lot better if we could be smarter about the possible biases in models and thinking in general.

Alex Tabarrok at Marginal Revolution has a nice take on remedies:

What can be done about these problems? (Some cribbed straight from Ioannidis and some my own suggestions.)

1) In evaluating any study try to take into account the amount of background noise. That is, remember that the more hypotheses which are tested and the less selection which goes into choosing hypotheses the more likely it is that you are looking at noise.

2) Bigger samples are better. (But note that even big samples won’t help to solve the problems of observational studies which is a whole other problem).

3) Small effects are to be distrusted.

4) Multiple sources and types of evidence are desirable.

5) Evaluate literatures not individual papers.

6) Trust empirical papers which test other people’s theories more than empirical papers which test the author’s theory.

7) As an editor or referee, don’t reject papers that fail to reject the null.

For SD modeling, I’d add a few more:

8) Reserve time for exploration of uncertainty (lots of Monte Carlo simulation).

9) Calibrate your confidence bounds.

10) Help clients to appreciate the extent and implications of uncertainty.

11) Pay attention to the language used to describe statistical concepts. Words like “expectation” and “significance” that have specific mathematical interpretations don’t mean the same thing to managers.

11) Look for robust policies that work irrespective of uncertain relationships.

12) Explicitly seek out and test alternative hypotheses (This sounds like it’s at odds with Corollary 3 above, but I think it’s the right thing to do. Testing multiple hypotheses in the context of the model is not the same thing as mining data for multiple relationships.).

13) If you can’t estimate something directly from data, or back it up with literature (more than a single paper), at least articulate some bounds on the effect, perhaps through experiments with a submodel.

What do you think? When is modeling and statistical analysis helpful, and when is it risky business?



Dynamic simulation the hard way

When Alan Turing was born 100 years ago, on June 23, 1912, a computer was not a thing—it was a person. Computers, most of whom were women, were hired to perform repetitive calculations for hours on end. The practice dated back to the 1750s, when Alexis-Claude ­Clairaut recruited two fellow astronomers to help him plot the orbit of Halley’s comet. ­Clairaut’s approach was to slice time into segments and, using Newton’s laws, calculate the changes to the comet’s position as it passed Jupiter and Saturn. The team worked for five months, repeating the process again and again as they slowly plotted the course of the celestial bodies.

Today we call this process dynamic simulation; Clairaut’s contemporaries called it an abomination. They desired a science of fundamental laws and beautiful equations, not tables and tables of numbers. Still, his team made a close prediction of the perihelion of Halley’s comet. Over the following century and a half, computational methods came to dominate astronomy and engineering.

From Turing’s Enduring Importance in Technology Review.

Calibrate your confidence bounds: an updated Capen Quiz

Forecasters are notoriously overconfident. This applies to nearly everyone who predicts anything, not just stock analysts. A few fields, like meteorology, have gotten a handle on the uncertainty in their forecasts, but this remains the exception rather than the rule.

Having no good quantitative idea of uncertainty, there is an almost universal tendency for people to understate it. Thus, they overestimate the precision of their own knowledge and contribute to decisions that later become subject to unwelcome surprises.

A solution to this problem involves some better understanding of how to treat uncertainties and a realization that our desire for preciseness in such an unpredictable world may be leading us astray.

E.C. Capen illustrated the problem in 1976 with a quiz that asks takers to state 90% confidence intervals for a variety of things – the length of the Golden Gate bridge, the number of cars in California, etc. A winning score is 9 out of 10 right. 10 out of 10 indicates that the taker was underconfident, choosing ranges that are too wide.

Ventana colleague Bill Arthur has been giving the quiz to clients for years. In fact, it turns out that the vast majority of takers are overconfident in their knowledge – they choose ranges that are too narrow, and get only a three or four questions right. CEOs are the worst – if you score zero out of 10, you’re c-suite material.

My kids and I took the test last year. Using what we learned, we expanded the variance on our guesses of the weight of a giant pumpkin at the local coop – and as a result, brought the monster home.

Now that I’ve taken the test a few times, it spoils the fun, so last time I was in a room for the event, I doodled an updated quiz. Here’s your chance to calibrate your confidence intervals:


For each question, specify a range (minimum and maximum value) within which you are 80% certain that the true answer lies. In other words, in an ideal set of responses, 8 out of 10 answers will contain the truth within your range.

Example*:

The question is, “what was the winning time in the first Tour de France bicycle race, in 1903?”

Your answer is, “between 1 hour and 1 day.”

Your answer is wrong, because the truth (94 hours, 33 minutes, 14 seconds) does not lie within your range.

Note that it doesn’t help to know a lot about the subject matter – precise knowledge merely requires you to narrow your intervals in order to be correct 80% of the time.

Now the questions:

  1. What is the wingspan of an Airbus A380-800 superjumbo jet?
  2. What is the mean distance from the earth to the moon?
  3. In what year did the Russians launch Sputnik?
  4. In what year did Alaric lead the Visigoths in the Sack of Rome?
  5. How many career home runs did baseball giant Babe Ruth hit?
  6. How many iPhones did Apple sell in FY 2007, its year of introduction?
  7. How many transistors were on a 1993 Intel Pentium CPU chip?
  8. How many sheep were in New Zealand on 30 June 2006?
  9. What is the USGA-regulated minimum diameter of a golf ball?
  10. How tall is Victoria Falls on the Zambezi River?

Be sure to write down your answers (otherwise it’s too easy to rationalize ex post). No googling!

Answers at the end of next week.

*Update: edited slightly for greater clarity.

Thinking systemically about safetey

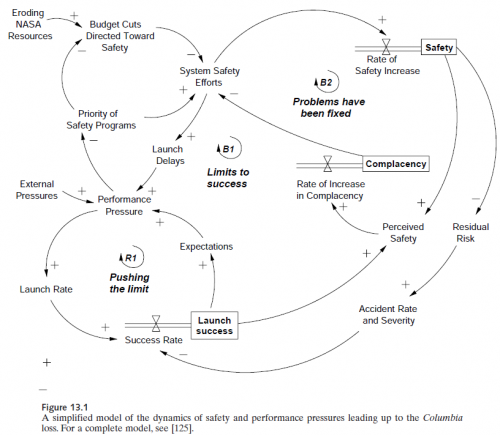
Accidents involve much more than the reliability of parts. Safety emerges from the systemic interactions of devices, people and organizations. Nancy Leveson’s Engineering a Safer World (free pdf currently at the MIT press link, lower left) picks up many of the threads in Perrow’s classic Normal Accidents, plus much more, and weaves them into a formal theory of systems safety. It comes to life with many interesting examples and prescriptions for best practice.

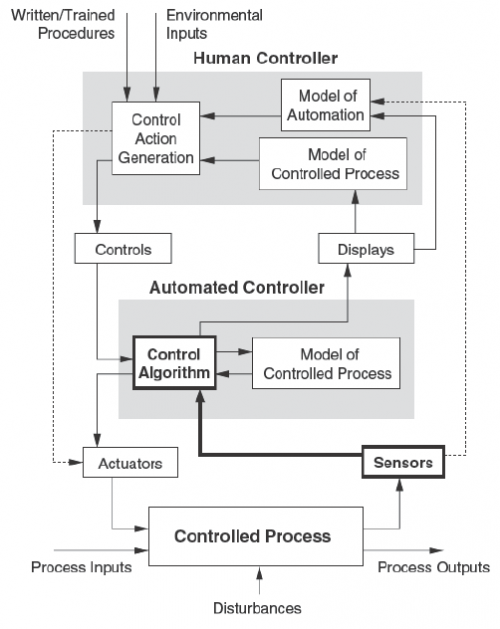
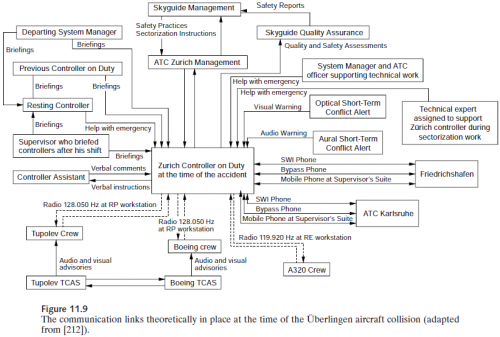
So far, I’ve only had time to read this the way I read the New Yorker (cartoons first), but a few pictures give a sense of the richness of systems perspectives that are brought to bear on the problems of safety:

Leveson - Pharma safety
Leveson - Safety as control
Leveson - Aviation information flow
The contrast between the figure above and the one that follows in the book, showing links that were actually in place, is striking. (I won’t spoil the surprise – you’ll have to go look for yourself.)

Leveson - Columbia disaster