Facebook reloaded

Facebook trading opened with it’s IPO and closed at $105 billion market capitalization.

I wondered how my model tracked reality over the last six months.

Facebook stats put users at 901 million at the end of March. My maximum likelihood run was rather lower than that – it corresponds with the K950 run in my last post (saturation users of 950 million), and predicted 840M users for end of Q1 2012. The latest data point corresponds with my K1250 run. I’m not sure if it’s interesting or not, but the new data point is a bit of an outlier. For one thing, it’s reported to the nearest million at a precise time, not with aggressive rounding as in earlier numbers I’d found. Re-estimating the model with the new, precise data point, it’s necessary to pass on the high size over most of the data from 2008-2011. That seems a bit fishy – perhaps a change in reporting methods has occurred.

In any case, it hardly matters whether the user carrying capacity is a bit over or under a billion. Either way, the valuation with current revenue per user is on the order of $20 billion. I had picked $5/user/year based on past performance, which turned out to be very close to the 2011 actuals. It would take a 10-year ramp to 7x current revenue/user to justify current pricing, or very low interest rates and risk premiums.

So the real question is, can Facebook increase its revenue per user dramatically?

Another short sell opportunity?

“I have no interest in shorting a cultural phenomenon,” hedge fund manager Jeffrey Matthews of Ram Partners in Greenwich, Connecticut, told Reuters in an email interview.

Asked if this was because such stocks trade without regard to normal market valuation, he wrote back, “Bingo.”

What drives learning?

Sit down and shut up while I tell you.

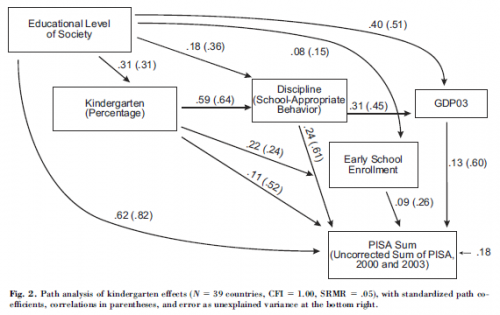
One interesting take on this compares countries cross-sectionally to get insight into performance drivers. A colleague dug up Educational Policy and Country Outcomes in International Cognitive Competence Studies. Two pictures from the path analysis are interesting:

Note the central role of discipline. Interestingly, the study also finds that self-report of pleasure reading is negatively correlated with performance. Perhaps that’s a consequence of getting performance through discipline rather than self-directed interest? (It works though.)

More interesting, though, is that practically everything is weak, except the educational level of society – a big positive feedback.

I find this sort of analysis quite interesting, but if I were a teacher, I think I’d be frustrated. In the aggregate international data, there’s precious little to go on when it comes to deciding, “what am I going to do in class today?”


Politicians designing control systems, badly

We already have to fly in planes designed by lawyers (metaphorically speaking). Now House Republicans want to remove the windows and instruments from the cockpit. This is stupid. Really stupid. I’ve used ACS data on numerous public and private sector consulting engagements. I’m perfectly willing to pay for the data, but I seriously doubt that the private sector will supply a substitute. Anyway, some basic free data is needed so that all citizens can participate intelligently in democracy. Lacking that, we’ll have to fly blind. Say, what’s a mountain goat doing up here in a cloud bank?

Teacher value added modeling – my bottom line

I’m still attracted to the idea of objective measurements of teaching performance.* But I’m wary of what appear to be some pretty big limitations in current implementations.

It’s interesting reading the teacher comments on the LA Times’ teacher value added database, because many teachers appear to have a similar view – conceptually supportive, but wary of caveats and cognizant of many data problems. (Interestingly, the LAT ratings seem to have higher year-on-year and cross subject rating reliability, much more like I would expect a useful metric to behave. I can only browse incrementally though, so seeing the full dataset rather than individual samples might reveal otherwise.)

My takeaways on the value added measurements:

I think the bigger issues have more to do with the content of the value added measurements rather than their precision. There’s nothing mysterious about what teacher value added measures. It’s very explicitly the teacher-level contribution to year-on-year improvement in student standardized test scores. Any particular measurement might contain noise and bias, but if you could get rid of those, there are still some drawbacks to the metric.

  • Testing typically emphasizes only math and English, maybe science, and not art, music, and a long list of other things. This is broadly counterproductive for life, but also even narrowly for learning math and English, because you need some real-world subject matter in order to have interesting problems to solve and things to write about.
  • Life is a team sport. Teaching is, or should be, too. (If you doubt this, watch a few episodes of a reality show like American Chopper and ponder whether performance would be more enhanced by better algebra skills, or better cooperation, communication and project management skills. Then ponder whether building choppers is much different from larger enterprises, like the Chunnel.) We should be thinking about performance accordingly.
    • A focus at the student and teacher level ignores the fact that school system-level dynamics are most likely the biggest opportunity for improvement.
    • A focus on single-subject year-on-year improvements means that teachers are driven to make decisions with a 100% time discount rate, and similar total disregard for the needs of other teachers’ classes.**
  • Putting teachers in a measurement-obsessed command-and-control environment is surely not the best way to attract high-quality teachers.
  • It’s hard to see how putting every student through the same material at the same pace can be optimal.
  • It doesn’t make sense to put too much weight on standardized test scores, when the intersection between those and more general thinking/living skills is not well understood.

If no teachers are ever let go for poor performance, that probably signals a problem. In fact, it’s likely a bigger problem if teacher performance measurement (generally, not just VAM) is noisy, because bad teachers can get tenure by luck. If VAM helps with the winnowing process, that might be a useful function.

But it seems to me that the power of value added modeling is being wasted by this musical chairs*** mentality. The real challenge in teaching is not to decrease the stock of bad teachers. It’s to increase the stock of good ones, by attracting new ones, retaining the ones we have, and helping all of them learn to improve. Of course, that might require something more scarce than seats in musical chairs – money.


* A friend and school board member in semi-rural California was an unexpected fan of No Child Left Behind testing requirements, because objective measurements were the only thing that finally forced her district to admit that, well, they kind of sucked.

** A friend’s son, a math teacher, proposed to take a few days out of the normal curriculum to wrap up some loose ends from prior years. He thought this would help students to cement the understanding of foundational topics that they’d imperfectly mastered. Management answered categorically that there could be no departures from the current year material, needed to cover standardized test requirements. He defied them and did it, but only because he knew that it would take the district a year to fire him, and he was quitting anyway.

*** Musical chairs has to be one of the worst games you could possibly teach to children. We played it fairly regularly in elementary school.

Dynamics of teacher value added – the limits

In my last post, I showed that culling low-performance teachers can work surprisingly well, even in the presence of noise that’s as large as the signal.

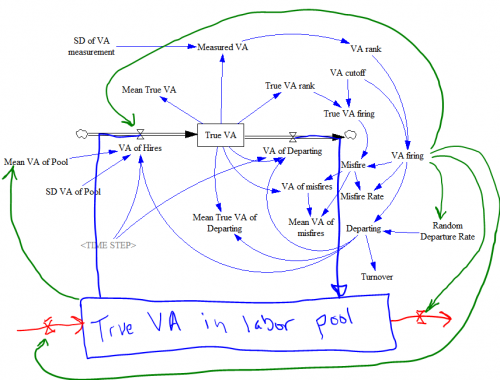
However, that involved two big assumptions: the labor pool of teachers is unlimited with respect to the district’s needs, and there’s no feedback from the evaluation process to teacher quality and retention. Consider the following revised system structure:

In this view, there are several limitations to the idea of firing bad teachers to improve performance:

  • Fired teachers don’t just disappear into a cloud; they go back into the teacher labor pool. This means that, as use of VA evaluation increases, the mean quality of the labor pool goes down, making it harder to replace teachers with new and better ones. This is unambiguously a negative (balancing) feedback loop.
  • The quality of the labor pool could go up through a similar culling process, but it’s not clear that teacher training institutions can deliver 50% more or better candidates, or that teachers rejected for low value added in one district will leave the pool altogether.

Several effects have ambiguous sign – they help (positive/reinforcing feedback) if the measurement system is seen as fair and attractive to good teachers, but they hurt performance otherwise:

  • Increased use of VA changes the voluntary departure rate of teachers from the district, with different effects on good and bad teachers.
  • Increased use of VA changes the ease of hiring good teachers.
  • Increased use of VA attracts more/better teachers to the labor pool, and reduces attrition from the labor pool.

On balance, I’d guess that these are currently inhibiting performance. Value added measurement is widely perceived as noisy and arbitrary, and biased toward standardized learning goals that aren’t all that valuable or fun to teach to.

  • Increasing the rate of departure requires a corresponding increase in the hiring rate, but this is not free, and there’s no guarantee that the labor pool supports it.

There are some additional limiting loops implicit in Out with the bad, in with the good.

Together, I think these effects most likely limit the potential for Value Added hiring/firing decisions to improve performance rather severely, especially given the current resistance to and possible problems with the measurements.

Dynamics of teacher value added

Suppose for the sake of argument that (a) maximizing standardized test scores is what we want teachers to do and (b) Value Added Modeling (VAM) does in fact measure teacher contributions to scores, perhaps with jaw-dropping noise, but at least no systematic bias.

Jaw-dropping noise isn’t as bad as it sounds. Other evaluation methods, like principal evaluations, aren’t necessarily less random, and if anything are more subject to various unknown biases. (Of course, one of those biases might be a desirable preference for learning not captured by standardized tests, but I won’t go there.) Also, other parts of society, like startup businesses, are subjected to jaw-dropping noise via markets, yet the economy still functions.

Further, imagine that we run a district with 1000 teachers, 10% of whom quit in a given year. We can fire teachers at will on the basis of low value added scores. We might not literally fire them; we might just deny them promotions or other benefits, thus encouraging them to leave. We replace teachers by hiring, and get performance given by a standard normal distribution (i.e. performance is an abstract index, ~ N(0,1)). We measure performance each year, with measurement error that’s as large as the variance in performance (i.e., measured VA = true VA + N(0,1)).
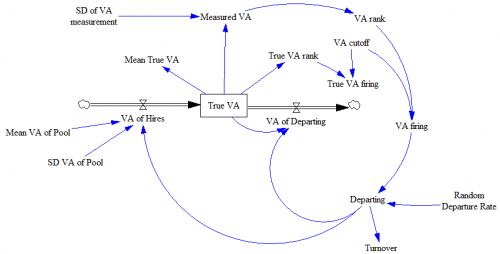
Structure of the system described. Note that this is essentially a discrete event simulation. Rather than a stock of teachers, we have an array of 1000 teacher positions, with each teacher represented by a performance score (“True VA”).

With such high noise, does VAM still work? The short answer is yes, if you don’t mind the side effects, and live in an open system.

If teachers depart at random, average performance across the district will be distributed N(0,.03); the large population of teachers smooths the noise inherited from the hiring process. Suppose, on top of that, that we begin to cull the bottom-scoring 5% of teachers each year. 5% doesn’t sound like a lot, but it probably is. For example, you’d have to hold a tenure review (or whatever) every 4 years and cut one in 5 teachers. Natural turnover probably isn’t really as high as 10%, but even so, this policy would imply a 50% increase in hiring to replace the greater outflow. Then suppose we can increase the accuracy of measurement from N(0,1) to N(0,0.5).

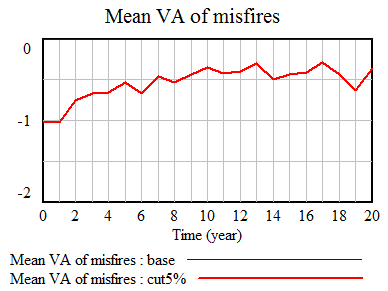
What happens to performance? It goes up quite a bit:
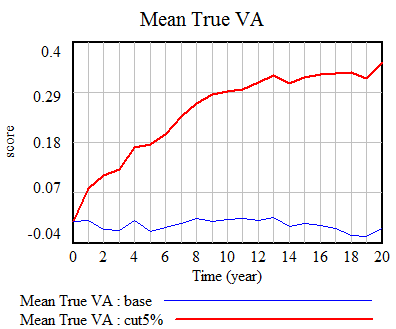
In our scenario (red), the true VA of teachers in the district goes up by about .35 standard deviations eventually. Note the eventually: quality is a stock, and it takes time to fill it up to a new equilibrium level. Initially, it’s easy to improve performance, because there’s low-hanging fruit – the bottom 5% of teachers is solidly poor in performance. But as performance improves, there are fewer poor performers, and it’s tougher to replace them with better new hires.

Surprisingly, doubling the accuracy of measurements (green) or making them perfect (gray) doesn’t increase performance much further. On the other hand, if noise exceeds the signal, ~N(0,5), performance is no longer increased much (black):
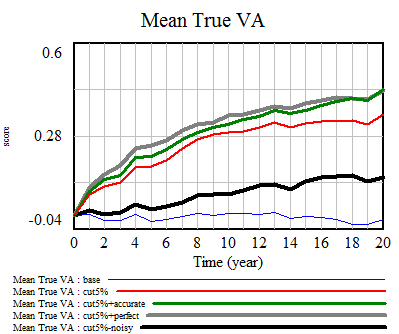
Extreme noise defeats the selection process, because firing becomes essentially random. There’s no expectation that a randomly-fired teacher can be replaced with a better randomly-hired teacher.

While aggregate performance goes up in spite of a noisy measurement process, the cost is a high chance of erroneously firing teachers, because their measured performance is in the bottom 5%, but their true performance is not. This is akin to the fundamental tradeoff between Type I and Type II errors in statistics. In our scenario (red), the error rate is about 70%, i.e. 70% of teachers fired aren’t truly in the bottom 5%:
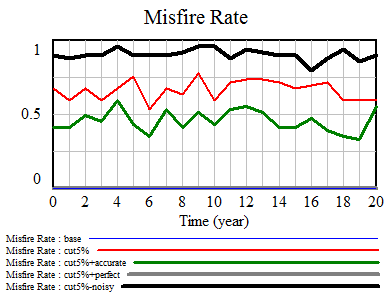
This means that, while evaluation errors come out in the wash at the district system level, they fall rather heavily on individuals. It’s not quite as bad as it seems, though. While a high fraction of teachers fired aren’t really in the bottom 5%, they’re still solidly below average. However, as aggregate performance rises, the false-positive firings get worse, and firings increasingly involve teachers near the middle of the population in performance terms:
Next post: why all of this this is limited by feedback.

 

More NYC teacher VAM mysteries

I can’t resist a dataset. So, now that I have the NYC teacher value added modeling results, I have to keep picking at it.

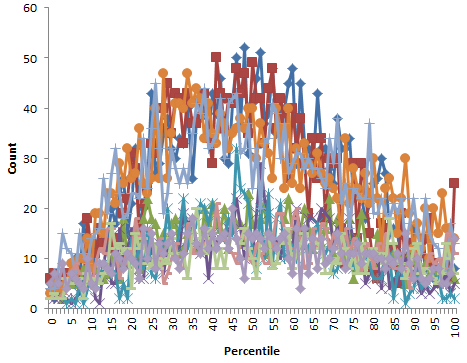
The 2007-2008 results are in a slightly different format from the later years, but contain roughly the same number of teacher ratings (17,000) and have lots of matching names, so at first glance the data are ok after some formatting. However, it turns out that, unlike 2008-2010, they contain percentile ranks that are nonuniformly distributed (which should be impossible). They also include values of both 0 and 100 (normally, percentiles are reported 1 to 100 or 0 to 99, but not including both endpoints, so that there are 100 rather than 101 bins). <sound of balled up spreadsheet printout ricocheting around inside metal wastebasket>

Nonuniform distribution of percentile ranks for 2007-2008 school year, for 10 subject-grade combinations.

That leaves only two data points: 2008-2009 and 2009-2010. That’s not much to go on for assessing the reliability of teacher ratings, for which you’d like to have lots of repeated observations of the same teachers. Actually, in a sense there are a bit more than two points, because the data includes a multi-year rating, that includes information from intervals prior to the 2008-2009 school year for some teachers.

I’d expect the multi-year rating to behave like a Bayesian update as more data arrives. In other words, the multi-year score at (t) is roughly the multi-year score at (t-1) convolved with the single-year score for (t). If things are approximately normal, this would work like:

  • Prior: multi-year score for year (t-1), distributed N( mu, sigma/sqrt(n) ) – with mu = teacher’s true expected value added, and sigma = measurement and performance variability, incorporating n years of data
  • Data likelihood: single-year score for year (t), ~ N( mu, sigma )
  • Posterior: multi-year score for year (t), ~ N( mu, sigma/sqrt(n+1) )

So, you’d expect that the multi-year score would behave like a SMOOTH, with the estimated value adjusted incrementally toward each new single-year value observed, and the confidence bounds narrowing with sqrt(n) as observations accumulate. You’d also expect that individual years would have similar contributions to the multi-year score, except to the extent that they differ in number of data points (students & classes) and data quality, which is probably not changing much.

However, I can’t verify any of these properties:

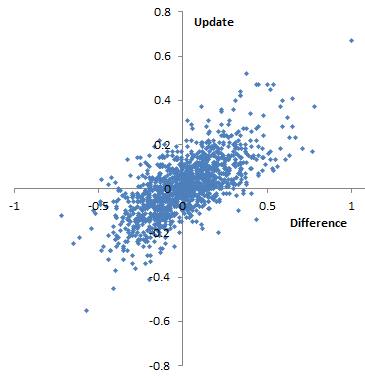
Difference of 09-10 score from 08-09 multi-year score vs. update to multi-year score from 08-09 to 09-10. I’d expect this to be roughly diagonal, and not too noisy. However, it appears that there are a significant number of teachers for whom the multi-year score goes down, despite the fact that their annual 09-10 score exceeds their prior 08-09 multi-year score (and vice versa). This also occurs in percentiles. This is 4th grade English, but other subject-grade combinations appear similar.

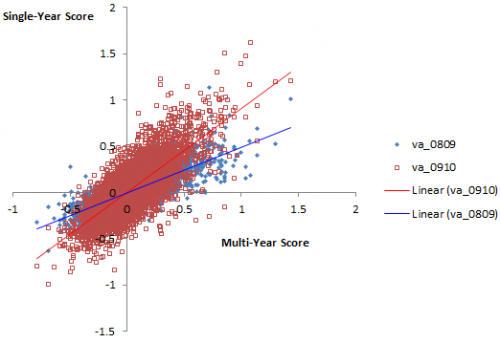
Plotting single-year scores for 08-09 and 09-10 against the 09-10 multi-year score, it appears that the multi-year score is much better correlated with 09-10, which would seem to indicate that 09-10 has greater leverage on the outcome. Again, his is 4th grade English, but generalizes.
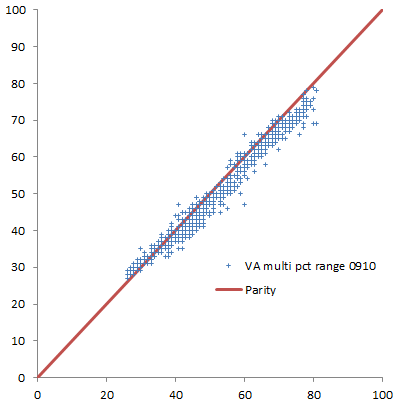
Percentile range (confidence bounds) for multi-year rank in 08-09 vs. 09-10 school year, for teachers in the 40th-59th percentile in 08-09. Ranges mostly shrink, but not by much.

I hesitate to read too much into this, because it’s possible that (a) the FOI datasheets are flawed, (b) I’m misinterpreting the data, which is rather sketchily documented, or (c) in haste, I’ve just made a total hash of this analysis. But if none of those things are true, then it would seem that the properties of this measurement system are not very desirable. It’s just very weird for a teacher’s multi-year score to go up when his single-year score goes down; a possible explanation could be numerical instability of the measurement process. It’s also strange for confidence bounds to widen, or narrow hardly at all, in spite of a large injection of data; that suggests that there’s very little incremental information in each school year. Perhaps one could construct some argument about non-normality of the data that would explain things, but that might violate the assumptions of the estimates. Or, perhaps it’s some artifact of the way scores are normalized. Even if this is a true and proper behavior of the estimate, it gives the measurement system a face validity problem. For the sake of NYC teachers, I hope that it’s (c).

Teacher value added modeling

The vision of teacher value added modeling (VAM) is a good thing: evaluate teachers based on objective measures of their contribution to student performance. It may be a bit utopian, like the cybernetic factory, but I’m generally all for substitution of reason for baser instincts. But a prerequisite for a good control system is a good model connected to adequate data streams. I think there’s reason to question whether we have these yet for teacher VAM.

The VAM models I’ve seen are all similar. Essentially you do a regression on student performance, with a dummy for the teacher, and as many other explanatory variables as you can think of. Teacher performance is what’s left after you control for demographics and whatever else you can think of. (This RAND monograph has a useful summary.)

Right away, you can imagine lots of things going wrong. Statistically, the biggies are omitted variable bias and selection bias (because students aren’t randomly assigned to teachers). You might hope that omitted variables come out in the wash for aggregate measurements, but that’s not much consolation to individual teachers who could suffer career-harming noise. Selection bias is especially troubling, because it doesn’t come out in the wash. You can immediately think of positive-feedback mechanisms that would reinforce the performance of teachers who (by mere luck) perform better initially. There might also be nonlinear interaction affects due to classroom populations that don’t show up as the aggregate of individual student metrics.

On top of the narrow technical issues are some bigger philosophical problems with the measurements. First, they’re just what can be gleaned from standardized testing. That’s a useful data point, but I don’t think I need to elaborate on its limitations. Second, the measurement is a one-year snapshot. That means that no one gets any credit for building foundations that enhance learning beyond a single school year. We all know what kind of decisions come out of economic models when you plug in a discount rate of 100%/yr.

The NYC ed department claims that the models are good:

Q: Is the value-added approach reliable?

A: Our model met recognized standards for validity and reliability. Teachers’ value-added scores were positively correlated with school Progress Report scores and principals’ evaluations of teacher effectiveness. A teacher’s value-added score was highly stable from year to year, and the results for teachers in the top 25 percent and bottom 25 percent were particularly stable.

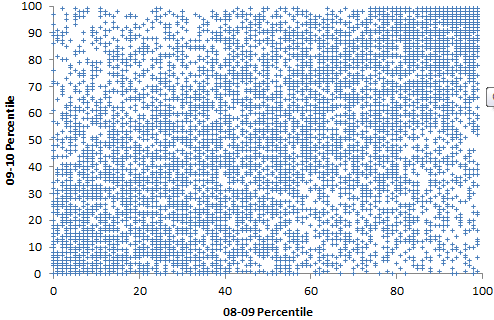
That’s odd, because independent analysis by Gary Rubinstein of FOI released data indicates that scores are highly unstable. I found that hard to square with the district’s claims about the model, above, so I did my own spot check:

Percentiles are actually not the greatest measure here, because they throw away a lot of information about the distribution. Also, the points are integers and therefore overlap. Here are raw z-scores:
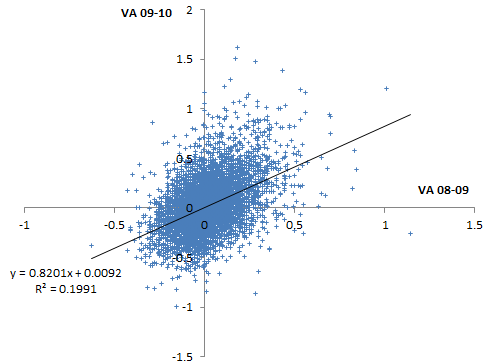
Some things to note here:

  • There is at least some information here.
  • The noise level is very high.
  • There’s no visual evidence of the greater reliability in the tails cited by the district. (Unless they’re talking about percentiles, in which case higher reliability occurs almost automatically, because high ranks can only go down, and ranking shrinks the tails of the distribution.)

The model methodology is documented in a memo. Unfortunately, it’s a typical opaque communication in Greek letters, from one statistician to another. I can wade through it, but I bet most teachers can’t. Worse, it’s rather sketchy on model validation. This isn’t just research, it’s being used for control. It’s risky to put a model in such a high-stakes, high profile role without some stress testing. The evaluation of stability in particular (pg. 21) is unsatisfactory because the authors appear to have reported it at the performance category level rather than the teacher level, when the latter is the actual metric of interest, upon which tenure decisions will be made. Even at the category level, cross-year score correlations are very low (~.2-.3) in English and low (~.4-.6) in math (my spot check results are even lower).

What’s really needed here is a full end-to-end model of the system, starting with a synthetic data generator, replicating the measurement system (the 3-tier regression), and ending with a population model of teachers. That’s almost the only way to know whether VAM as a control strategy is really working for this system, rather than merely exercising noise and bias or triggering perverse side effects. The alternative (which appears to be underway) is the vastly more expensive option of experimenting with real $ and real people, and I bet there isn’t adequate evaluation to assess the outcome properly.

Because it does appear that there’s some information here, and the principle of objective measurement is attractive, VAM is an experiment that should continue. But given the uncertainties and spectacular noise level in the measurements, it should be rolled out much more gradually. It’s bonkers for states to hang 50% of a teacher’s evaluation on this method. It’s quite ironic that states are willing to make pointed personnel decisions on the basis of such sketchy information, when they can’t be moved by more robust climate science.

Really, the thrust here ought to have two prongs. Teacher tenure and weeding out the duds ought to be the smaller of the two. The big one should be to use this information to figure out what makes better teachers and classrooms, and make them.

Alternate perceptions of time

An interesting tidbit from Science:

Where Time Goes Up and Down

Dennis Normile

In Western cultures, the future lies ahead; the past is behind us. These notions are embedded in both gestures and spoken metaphors (looking forward to next year or back over the past year). A forward hand motion typically accompanies talk of the future; references to the past often bring a wave over the shoulder.

It is hard for most Westerners to conceive of other ways of conceptualizing time. But in 2006, Rafael Núñez, a cognitive scientist at the University of California, San Diego, reported that for the Aymara, an ethnic group of about 2 million people living in the Andean highlands, in both spoken and gestural terms, the future is unseen and conceived as being behind the speaker; the past, since it has been witnessed, is in front. They point behind themselves when discussing the future. And when talking about the past, Aymara gesture farther in front of them the more distant the event ….

At the Tokyo Evolutionary Linguistics Forum, Núñez presented another example of unusual thinking—and gesturing—about time: The Yupno people, who inhabit a remote valley in Papua New Guinea, think of time topographically. No matter which way a speaker is facing, he or she will gesture uphill when discussing the future and point downhill when talking about the past. …

I like the Aymara approach, with the future unseen behind the speaker. I bet there aren’t any Aymara economic models assuming perfect foresight as a model of behavior.

Where Time Goes Up and Down