Pink Noise

In a continuous time dynamic model, representing noise as a random draw at every time step can be problematic. As the time step is decreased, the high frequency power of the noise spectrum increases accordingly, potentially changing the behavior. In the limit of small time steps, the resulting white noise has infinite power, which is not physically realistic.

The solution is to use pink noise, which is essentially white noise filtered to cut off high frequencies. SD models from the bad old days typically employed a pink noise generating structure that employed uniformly distributed white noise, relying on the central limit theorem to yield a normally distributed output. Ed Anderson improved that structure to incorporate a normally distributed input, which works better, especially if the cutoff frequency is close to the inverse of the time step.

Two versions of the model are attached: one for advanced versions of Vensim, which permit implementation as a :MACRO:, for efficient reuse. The other works with Vensim PLE.

PinkNoise2010.mdl PinkNoise2010.vmf PinkNoise2010.vpm

PinkNoise2010-PLE.vmf PinkNoise2010-PLE.vpm

Contributed by Ed Anderson, updated by Tom Fiddaman

Notes (also in the model files):

Description: The pink noise molecule described generates a simple random series with autocorrelation. This is useful in representing time series, like rainfall from day to day, in which today’s value has some correlation with what happened yesterday. This particular formulation will also have properties such as standard deviation and mean that are insensitive both to the time step and the correlation (smoothing) time. Finally, the output as a whole and the difference in values between any two days is guaranteed to be Gaussian (normal) in distribution.

Behavior: Pink noise series will have both a historical and a random component during each period. The relative “trend-to-noise” ratio is controlled by the length of the correlation time. As the correlation time approaches zero, the pink noise output will become more independent of its historical value and more “noisy.” On the other hand, as the correlation time approaches infinity, the pink noise output will approximate a continuous time random walk or Brownian motion. Displayed above are two time series with correlation times of 1 and 8 months. While both series have approximately the same standard deviation, the 1-month correlation time series is less smooth from period to period than the 8-month series, which is characterized by “sustained” swings in a given direction. Note that this behavior will be independent of the time-step. The “pink” in pink noise refers to the power spectrum of the output. A time series in which each period’s observation is independent of the past is characterized by a flat or “white” power spectrum. Smoothing a time series attenuates the higher or “bluer” frequencies of the power spectrum, leaving the lower or “redder” frequencies relatively stronger in the output.

Caveats: This assumes the use of Euler integration with a time step of no more than 1/4 of the correlation time. Very long correlation times should be avoided also as the multiplication in the scaled white noise will become progressively less accurate.

Technical Notes: This particular form of pink noise is superior to that of Britting presented in Richardson and Pugh (1981) because the Gaussian (Normal) distribution of the output does not depend on the Central Limit Theorem. (Dynamo did not have a Gaussian random number generator and hence R&P had to invoke the CLM to get a normal distribution.) Rather, this molecule’s normal output is a result of the observations being a sum of Gaussian draws. Hence, the series over short intervals should better approximate normality than the macro in R&P.

MEAN: This is the desired mean for the pink noise.

STD DEVIATION: This is the desired standard deviation for the pink noise.

CORRELATION TIME: This is the smooth time for the noise, or for the more technically minded this is the inverse of the filter’s cut-off frequency in radians.

Painting ourselves into a green corner

At the Green California Summit & Expo this week, I saw a strange sight: a group of greentech manufacturers hanging out in the halls, griping about environmental regulations. Their point? That a surfeit of command-and-control measures makes compliance such a lengthy and costly process that it’s hard to bring innovations to market. That’s a nice self-defeating outcome!

Consider this situation:

greenCorner
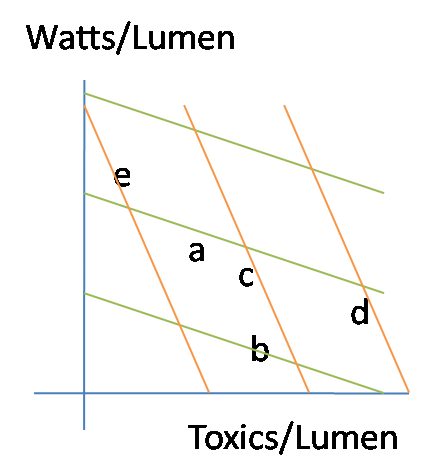
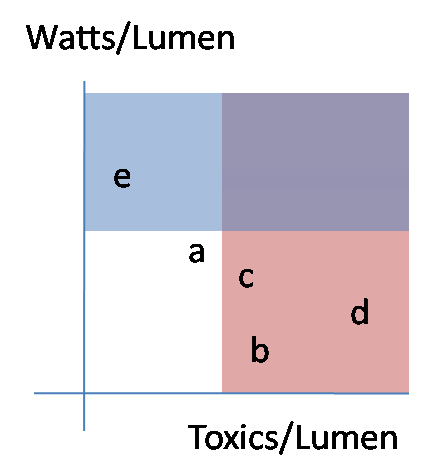
I was thinking of lighting, but it could be anything. Letters a-e represent technologies with different properties. The red area is banned as too toxic. The blue area is banned as too inefficient. That leaves only technology a. Maybe that’s OK, but what if a is made in Cuba, or emits harmful radiation, or doesn’t work in cold weather? That’s how regulations get really complicated and laden with exceptions. Also, if we revise our understanding of toxics, how should we update this to reflect the tradeoffs between toxics in the bulb and toxics from power generation, or using less toxic material per bulb vs. using fewer bulbs? Notice that the only feasible option here – a – is not even on the efficient frontier; a mix of e and b could provide the same light with slightly less power and toxics.

Proliferation of standards creates a situation with high compliance costs, both for manufacturers and the bureaucracy that has to administer them. That discourages small startups, leaving the market for large firms, which in turn creates the temptation for the incumbents to influence the regulations in self-serving ways. There are also big coverage issues: standards have to be defined clearly, which usually means that there are fringe applications that escape regulation. Refrigerators get covered by Energy Star, but undercounter icemakers and other cold energy hogs don’t. Even when the standards work, lack of a price signal means that some of their gains get eaten up by rebound effects. When technology moves on, today’s seemingly sensible standard becomes part of tomorrow’s “dumb laws” chain email.

The solution is obviously not total laissez faire; then the environmental goals just don’t get met. There probably are some things that are most efficient to ban outright (but not the bulb), but for most things it would be better to impose upstream prices on the problems – mercury, bisphenol A, carbon, or whatever – and let the market sort it out. Then providers can make tradeoffs the way they usually do – which package of options makes the cheapest product? -without a bunch of compliance risk involved in bringing their product to market.

Here’s the alternative scheme:

greenTradeoffs

The green and orange lines represent isocost curves for two different sets of energy and toxic prices. If the unit prices of a-e were otherwise the same, you’d choose b with the green pricing scheme (cheap toxics, expensive energy) and e in the opposite circumstance (orange). If some of the technologies are uniquely valuable in some situations, pricing also permits that tradeoff – perhaps c is not especially efficient or clean, but has important medical applications.

With a system driven by prices and values, we could have very simple conversations about adaptive environmental control. Are NOx levels acceptable? If not, raise the price of emitting NOx until it is. End of discussion.

Two related tidbits:

Fed green buildings guru Kevin Kampschroer gave an interesting talk on the GSA’s greening efforts. He expressed hope that we could move from LEED (checklists) to LEEP (performance-based ratings).

I heard from a lighting manufacturer that the cost of making a CFL is under a buck, but running a recycling program (for mercury recapture) costs $1.50/bulb. There must be a lot of markup in the distribution channels to get them up to retail prices.

The lure of border carbon adjustments

Are border carbon adjustments (BCAs) the wave of the future? Consider these two figures:

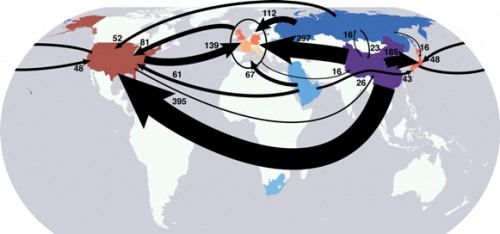
Carbon flows embodied in trade goods

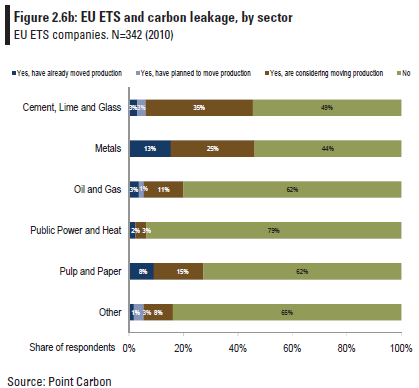
Leakage

The first shows the scale of carbon embodied in trade. The second, even if it overstates true intentions, demonstrates the threat of carbon outsourcing. Both are compelling arguments for border adjustments (i.e. tariffs) on GHG emissions.

I think things could easily go this route: it’s essentially a noncooperative route to a harmonized global carbon price. Unlike global emissions trading, it’s not driven by any principle of fair allocation of property rights in the atmosphere; instead it serves the more vulgar notion that everyone (or at least every nation) keeps their own money.

Consider the pros and cons:

Advocates of BCAs claim that the measures are intended to address three factors. First, competitiveness concerns where some industries in developed countries consider that a BCA will protect their global competitiveness vis-a-vis industries in countries that do not apply the same requirements. The second argument for BCAs is ‘carbon leakage’ – the notion that emissions might move to countries where rules are less stringent. A third argument, of the highest political relevance, has to do with ‘leveraging’ the participation of developing countries in binding mitigation schemes or to adopt comparable measures to offset emissions by their own industries.

from a developing country perspective, at least three arguments run counter to that idea: 1) that the use of BCAs is a prima facie violation of the spirit and letter of multilateral trade principles and norms that require equal treatment among equal goods; 2) that BCAs are a disguised form of protectionism; and 3) that BCAs undermine in practice the principle of common but differentiated responsibilities.

In other words: the advocates are a strong domestic constituency with material arguments in places where BCAs might arise. The opponents are somewhere else and don’t get to vote, and armed with legalistic principles more than fear and greed.

Feedbackwards

In the 80s, my mom had an Audi 5000. It’s value was destroyed by allegations of sudden, uncontrollable acceleration. No plausible physical mechanism was ever identified.

Today, Toyota’s suffering from the same fate. A more likely explanation? Operator error. Stepping on the gas instead of the brake transforms the normal negative feedback loop controlling velocity into a runaway positive feedback:

… A driver would step on the wrong pedal, panic when the car did not perform as expected, continue to mistake the accelerator for the brake, and press down on the accelerator even harder.

This had disastrous consequences in a 1992 Washington Square Park incident that killed five and a 2003 Santa Monica Farmers’ Market incident that killed ten …

Given time, the driver can model the situation, figure out what’s wrong, and correct. But, as my sister can attest, when you’re six feet in front of the garage with the 350 V8 Buick at full throttle, there isn’t a lot of time.

Read more at the Washington Examiner

Idle wind in China?

Via ClimateProgress:

China finds itself awash in wind turbine factories

China’s massive investment in wind turbines, fueled by its government’s renewable energy goals, has caused the value of the turbines to tumble more than 30 percent from 2004 levels, the vice president of Shanghai Electric Group Corp. said yesterday.

There are now “too many plants,” Lu Yachen said, noting that China is idling as much as 40 percent of its turbine factories.

The surge in turbine investments came in response to China’s goal to increase its power production capacity from wind fivefold in 2020.

The problem is that there are power grid constraints, said Dave Dai, an analyst with CLSA Asia-Pacific Markets, noting that construction is slowed because of that obstacle. Currently, only part of China’s power grid is able to accept delivery of electricity produced by renewable energy. “The issues with the grid aren’t expected to ease in the near term,” he said. Still, they “should improve with the development of smart-grid investment over time.”

The constraints may leave as much as 4 gigawatts of windpower generation capacity lying idle, Sunil Gupta, managing director for Asia and head of clean energy at Morgan Stanley, concluded in November.

China has the third-largest windpower market by generating capacity, Shanghai Electric’s Yachen said.

It’s tempting to say that the grid capacity is a typical coordination failure of centrally planned economies. Maybe so, but there are certainly similar failures in market economies – Montana gas producers are currently pipeline-constrained, and the rush to gas in California in the deregulation/Enron days was hardly a model of coordination. (Then again, electric power is hardly a free market.)

The real problem, of course, is that coal gets a free ride in China – as in most of the world – so that the incentives to solve the transmission problem for wind just aren’t there.

Fuzzy VISION

Like spreadsheets, open-loop models are popular but flawed tools. An open loop model is essentially a scenario-specification tool. It translates user input into outcomes, without any intervening dynamics. These are common in public discourse. An example turned up in the very first link when I googled “regional growth forecast”:

The growth forecast is completed in two stages. During the first stage SANDAG staff produces a forecast for the entire San Diego region, called the regionwide forecast. This regionwide forecast does not include any land use constraints, but simply projects growth based on existing demographic and economic trends such as fertility rates, mortality rates, domestic migration, international migration, and economic prosperity.

In other words, there’s unidirectional causality from inputs  to outputs, ignoring the possible effects of the outputs (like prosperity) on the inputs (like migration). Sometimes such scenarios are useful as a starting point for thinking about a problem. However, with no estimate of the likelihood of realization of such a scenario, no understanding of the feedback that would determine the outcome, and no guidance about policy levers that could be used to shape the future, such forecasts won’t get you very far (but they might get you pretty deep – in trouble).

The key question for any policy, is “how do you get there from here?” Models can help answer such questions. In California, one key part of the low-carbon fuel standard (LCFS) analysis was VISION-CA. I wondered what was in it, so I took it apart to see. The short answer is that it’s an open-loop model that demonstrates a physically-feasible path to compliance, but leaves the user wondering what combination of vehicle and fuel prices and other incentives would actually get consumers and producers to take that path.

First, it’s laudable that the model is publicly available for critique, and includes macros that permit replication of key results. That puts it ahead of most analyses right away. Unfortunately, it’s a spreadsheet, which makes it tough to know what’s going on inside.

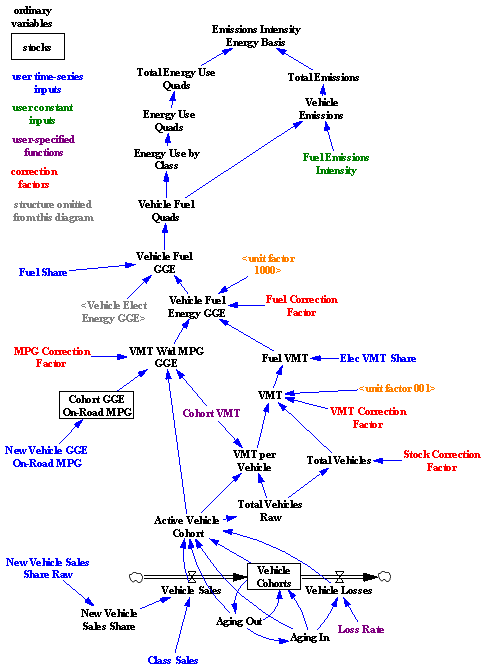
I translated some of the model core to Vensim for clarity. Here’s the structure:

VISION-CA

Bringing the structure into the light reveals that it’s basically a causal tree – from vehicle sales, fuel efficiency, fuel shares, and fuel intensity to emissions. There is one pair of minor feedback loops, concerning the aging of the fleet and vehicle losses. So, this is a vehicle accounting tool that can tell you the consequences of a particular pattern of new vehicle and fuel sales. That’s already a lot of useful information. In particular, it enforces some reality on scenarios, because it imposes the fleet turnover constraint, which imposes a delay in implementation from the time it takes for the vehicle capital stock to adjust. No overnight miracles allowed.

What it doesn’t tell you is whether a particular measure, like an LCFS, can achieve the desired fleet and fuel trajectory with plausible prices and other conditions. It also can’t help you to decide whether an LCFS, emissions tax, or performance mandate is the better policy. That’s because there’s no consumer choice linking vehicle and fuel cost and performance, consumer knowledge, supplier portfolios, and technology to fuel and vehicle sales. Since equilibrium analysis suggests that there could be problems for the LCFS, and disequilibrium generally makes things harder rather than easier, those omissions are problematic.

Continue reading “Fuzzy VISION”

The Trouble with Spreadsheets

As a prelude to my next look at alternative fuels models, some thoughts on spreadsheets.

Everyone loves to hate spreadsheets, and it’s especially easy to hate Excel 2007 for rearranging the interface: a productivity-killer with no discernible benefit. At the same time, everyone uses them. Magne Myrtveit wonders, Why is the spreadsheet so popular when it is so bad?

Spreadsheets are convenient modeling tools, particularly where substantial data is involved, because numerical inputs and outputs are immediately visible and relationships can be created flexibly. However, flexibility and visibility quickly become problematic when more complex models are involved, because:

  • Structure is invisible and equations, using row-column addresses rather than variable names, are sometimes incomprehensible.
  • Dynamics are difficult to represent; only Euler integration is practical, and propagating dynamic equations over rows and columns is tedious and error-prone.
  • Without matrix subscripting, array operations are hard to identify, because they are implemented through the geography of a worksheet.
  • Arrays with more than two or three dimensions are difficult to work with (row, column, sheet, then what?).
  • Data and model are mixed, so that it is easy to inadvertently modify a parameter and save changes, and then later be unable to easily recover the differences between versions. It’s also easy to break the chain of causality by accidentally replacing an equation with a number.
  • Implementation of scenario and sensitivity analysis requires proliferation of spreadsheets or cumbersome macros and add-in tools.
  • Execution is slow for large models.
  • Adherence to good modeling practices like dimensional consistency is impossible to formally verify

For some of the reasons above, auditing the equations of even a modestly complex spreadsheet is an arduous task. That means spreadsheets hardly ever get audited, which contributes to many of them being lousy. (An add-in tool called Exposé can get you out of that pickle to some extent.)

There are, of course, some benefits: spreadsheets are ubiquitous and many people know how to use them. They have pretty formatting and support a wide variety of data input and output. They support many analysis tools, especially with add-ins.

For my own purposes, I generally restrict spreadsheets to data pre- and post-processing. I do almost everything else in Vensim or a programming language. Even seemingly trivial models are better in Vensim, mainly because it’s easier to avoid unit errors, and more fun to do sensitivity analysis with Synthesim.

Lorenz Attractor

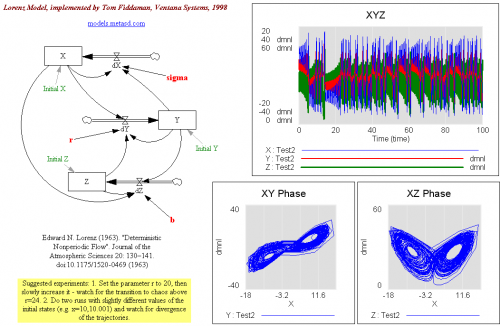
This is an implementation of Lorenz’ groundbreaking model that exhibits continuous-time chaos.

A google search turns up lots of good information on this model. For more advanced material, try google scholar.

I didn’t replicate this from Lorenz’ original 1963 article, Deterministic Nonperiodic Flow, but you can find a copy here.

Updated!

lorenz2.vmf

lorenz2.vpm