Controlled Burn, Wood Stove, or Dumpster Fire?

The Twitter mess is a really interesting example of experimenting on a complex system in real time, apparently without much of a model.

I think fire is an interesting analogy (as long as you don’t take it too seriously, as with all analogies). There are different kinds of fires. A controlled burn improves forest health and lowers future risk by consuming dead wood. I think that’s what Musk is trying to accomplish. A fire in a wood stove makes nice heat, regulated by air flow. Controlled growth may be another Musk objective. An uncontrolled burn, or a burn where you don’t want it, is destructive.

I think the underlying parallel is that fire is driven by reinforcing feedback, and any organization has a lot of positive feedback loops. Success requires that the virtuous cycles are winning over the vicious cycles. If you get too many of the bad reinforcing feedbacks going, you have an uncontrolled burn in a bad place. This is often fatal, as at Sears.

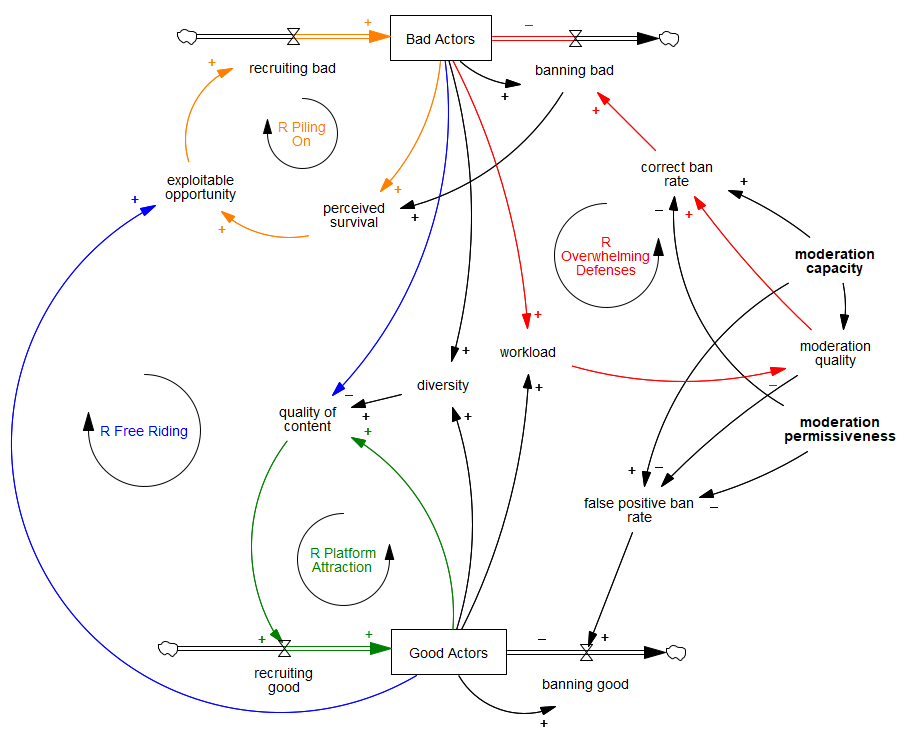
Here are some of the loops I think are active at Twitter.

First, there’s the employee picture. I’ve divided them into two classes: over- and under-performing, which you might think of as identifying whether they produce more team value than their compensation indicates, or less. The dynamics I’ve drawn are somewhat incomplete, as I’ve focused on the “over-” side, omitting a number of parallel loops on the “under-” side for brevity.

There are some virtuous cycles you’d like to encourage (green). Hiring better people increases the perceived quality of colleagues, and makes it easier to recruit more good people. As you hire to increase work capacity, time pressure goes down, work quality goes up, you can book more work in the future, and use the revenue to hire more people. (This glosses over some features of IT work, like the fact that code is cumulative.)

There are also some loops you’d like to keep inactive, like the orange loop, which I’ve named for mass exodus, but might be thought of as amplifying departures due to the chaos and morale degradation from initial losses. A similar loop (not colored) is triggered when loss of high-performing employees increases the workload on the remainder, beyond their appetite.
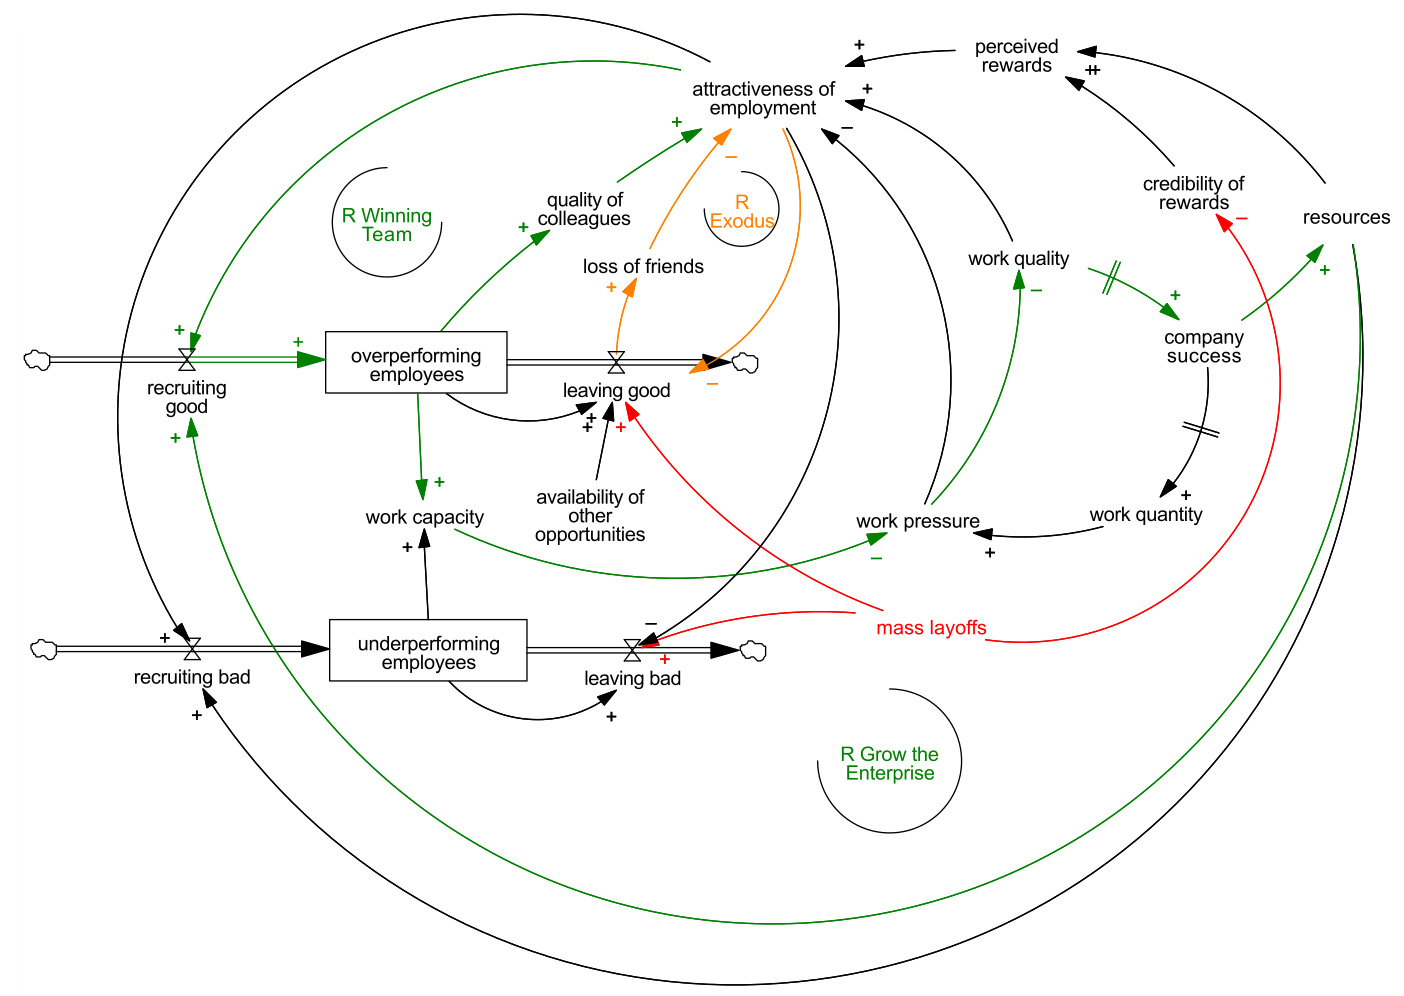
I suspect that Musk is counting on mass layoffs (red) to selectively eliminate the underperforming employees, and perhaps whole functional areas. This might work, except that I doubt it’s achievable without side effects, either demoralizing good employees, or removing functions that actually made unobserved vital contributions. I think he’s also counting on promises of future performance to enlist high performers in a crusade. But mass layoffs work against that by destroying the credibility of promises about the future – why stick around if you may be terminated for essentially random reasons?

Another key feature (not shown) is Musk’s apparent propensity to fire people for daring to contradict him. This seems like a good way to selectively fire high performers, and destroy the morale of the rest. Once you ignite the vicious cycles in this way, it’s hard to recover, because unlike forest detritus, the overperformers are more “flammable” than the underperformers – i.e., they have better prospects at other companies. Having the good people leave first is the opposite of what you want.

How far this fire spreads depends on how it impacts customers. The initial mass layoffs and reinforcing departures seem to have had a big impact on moderation capacity. That triggers a couple more vicious cycles. With moderation capacity down, bad actors last longer on the platform, increasing moderation workload. Higher workload and lower capacity decreases quality of moderation, so the removal of bad accounts falls more (red). As this happens, other potential bad actors observe the opportunity and move into the breach (orange).

There are some aspects of this subsystem that I found difficult to deal with on a CLD. The primary questions are of “good and bad from whose perspective,” and whether greater intentional permissiveness offsets diminished moderation capacity. I think there are some legitimate arguments for permitting more latitude (“sunshine is the best remedy”) but also compelling arguments for continued proscription of certain behavior (violence for example). The credibility of policy changes so far, such as they can be determined, is undermined by the irony of the immediate crackdown on freedom to criticize the boss.

One key feature not shown here is how advertisers view all this. They’re the revenue driver after all. So far they seem to fear the increase in turbulence and controversy, even if it brings diversity and engagement.That’s bad, because it’s another vicious cycle (roughly, less revenue -> less capacity -> more conflict -> less revenue).

Account holders might become more of a revenue driver, but the initial rollout of the $8 verification idea was badly botched – presumably in part because of the simultaneous mass reduction in organizational capacity. This is unfortunate, because reducing anonymity might be a good way of promoting quality information through accountability.

The alternative, if Twitter collapses, is not entirely appetizing. Other big platforms aren’t exactly paragons of freedom or civility, and alternatives like Mastodon that provide more self-moderation capacity probably also enhance the insularity of filter bubbles.

I’m wondering again, (how) Should Systems Thinkers be on Social Media?

Related:

AI is killing us now

The danger of path-dependent information flows on the web

Encouraging Moderation


Stock markets and coronavirus – an endogenous perspective

Markets collapse when they’re in a vulnerable state. Coronavirus might be the straw that broke the camel’s back – this time – but there’s no clear pandemic to stock price causality.

The predominant explanation for this week’s steep decline in the stock market is coronavirus. I take this as evidence that the pandemic of open-loop, event-based thinking is as strong as ever.

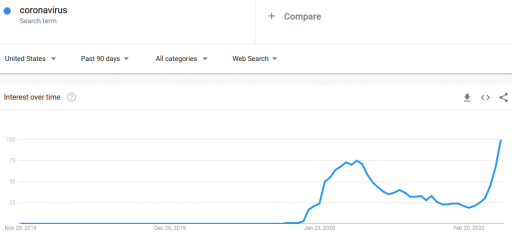
First, let’s look at some data. Here’s interest in coronavirus:

It was already pretty high at the end of January. Why didn’t the market collapse then? (In fact, it rose a little over February). Is there a magic threshold of disease, beyond which markets collapse?

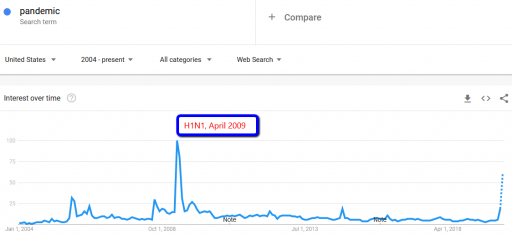
How about other pandemics? Interest in pandemics was apparently higher in 2009, with the H1N1 outbreak:

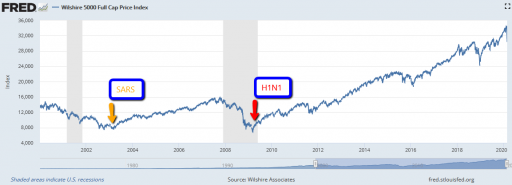
Did the market collapse then? No. In fact, that was the start of the long climb out of the 2007 financial crisis. The same was true for SARS, in spring 2003, in the aftermath of the dotcom bust.

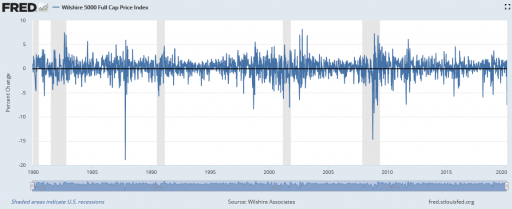
There are also lots of examples of market crashes, like 1987, that aren’t associated with pandemic fears at all. Corrections of this magnitude are actually fairly common (especially if you consider the percentage drop, not the inflated absolute drop):

Wilshire Associates, Wilshire 5000 Full Cap Price Index [WILL5000PRFC], retrieved from FRED, Federal Reserve Bank of St. Louis; https://fred.stlouisfed.org/series/WILL5000PRFC, February 28, 2020.
So clearly a pandemic is neither necessary nor sufficient for a market correction to occur.

I submit that the current attribution of the decline to coronavirus is primarily superstitious, and that the market is doing what it always does.

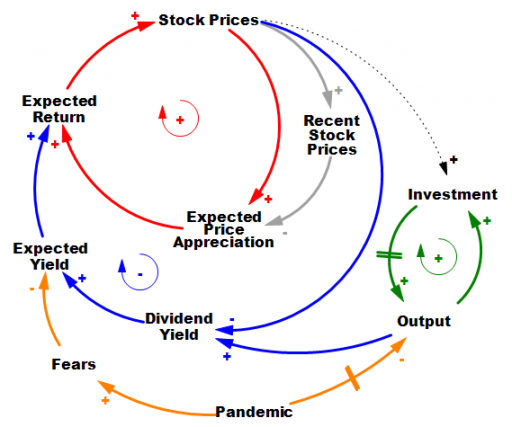
It’s hard to do it justice briefly, but the stock market is basically an overlay of a complicated allocation mechanism on top of the real economy. In the real economy (green positive loop) capital and technology accumulation increase output (thinking strictly of on-market effects). Growth in that loop proceeds steadily in the long run, but with bumps from business cycles. The stock market is sending signals to the real economy about how to invest, but that’s complicated, hence the dashed line.

In the stock market, prices reflect expectations about the future flow of dividends from the economy (blue negative loop). If that were the whole story, coronavirus (orange) would have to have induced fears of a drop in the NPV of future profits of about 10%. Hopefully that’s way outside any plausible scenario. So why the big drop? It’s due to the other half of the story. Expectations are formed partly on fundamentals, and partly on the expectation that the market will go up, because it’s been going up (red positive loop).

There are actually a number of mechanisms behind this: naive extrapolation, sophisticated exploitation of the greater fool, redirection of media attention to prognosticators of growth when they’re right, and so on. The specifics aren’t important; what matters is that they create a destabilizing reinforcing feedback loop that inflates bubbles. Then, when some shock sufficient to overcome the expectations of appreciation arrives, the red loop runs the other way, as a vicious cycle. Diminished expected returns spark selling, lowering prices, and further diminishing expectations of appreciation. If things get bad enough, liquidity problems and feedback to the real economy accentuate the problem, as in 1929.

Importantly, this structure makes the response of the market to bad news nonlinear and state-dependent. When SARS and H1N1 arrived, the market was already bottomed out. At such a point, the red loop is weak, because there’s not much speculative activity or enthusiasm. The fact that this pandemic is having a large impact, even while it’s still hypothetical, suggests that market expectations were already in a fragile state. If SARS-Cov-2 hadn’t come along to pop the bubble, some other sharp object would have done it soon: a bank bust, a crop failure, or maybe just a bad hot dog for an influential trader.

Coronavirus may indeed be the proximate cause of this week’s decline, in the same sense as the straw that broke the camel’s back. However, the magnitude of the decline is indicative of the fragility of the market state when the shock came along, and not necessarily of the magnitude of the shock itself. The root cause of the decline is that the structure of markets is prone to abrupt losses.

For a nice exploration of these dynamics, from the complexity/nonlinear dynamics thread of systems science, see Didier Sornette’s Why Stock Markets Crash: Critical Events in Complex Financial Systems.

The bubble regulator’s dilemma

More from Galbraith on the crash of ’29:

Some of those in positions of authority wanted the boom to continue. They were making money out of it, and they may have had an intimation of the personal disaster which awaited them when the boom came to an end. But there were also some who saw, however dimly, that a wild speculation was in progress, and that something should be done. For these people, however, every proposal to act raised the same intractable problem. The consequences of successful action seemed almost as terrible as the consequences of inaction, and they could be more horrible for those who took the action.

A bubble can easily be punctured. But to incise it with a needle so that it subsides gradually is a task of no small delicacy. Among those who sensed what was happening in early 1929, there was some hope but no confidence that the boom could be made to subside. The real choice was between an immediate and deliberately engineered collapse and a more serious disaster later on. Someone would certainly be blamed for the ultimate collapse when it came. There was no question whatever who would be blamed should the boom be deliberately deflated.

This presents an evolutionary problem, preventing emergence of wise regulators, even absent “power corrupts” dynamics. The solution may be to incise the bubble in a distributed fashion, by inoculating the individuals who create the bubble with more wisdom and memory of past boom-bust cycles.

Systems Thinking about the Crash of ’29

I picked up John Kenneth Galbraith’s account of The Great Crash at a used bookstore. I’m not far into it, but there’s a nice assertion of the importance of a systemic view over event-based descriptions right at the start:

… implicit in this hue and cry was the notion that somewhere on Wall Street … there was a deus ex machina who somehow engineered the boom and bust. This notion that great misadventures are the work of great and devious adventurers, and that the latter can and must be found if we are to be safe, is a popular one in our time. … While this may be a harmless avocation, it does not suggest and especially good view of historical processes. No one was responsible for the great Wall Street crash. No one engineered the speculation that preceded it. Both were the product of the free choice of hundreds of thousands of individuals. The latter were not led to the slaughter. They were impelled to it by the seminal lunacy which has always seized people who are seized in turn with the notion that they can become very rich. …

Galbraith’s purpose in writing the book is itself systemic, to weaken the erosion of memory that permits episodic boom bust cycles:

Someday, no one can tell when, there will be another speculative climax and crash. There is no chance that, as the market moves to the brink, those involved will see the nature of their illusion and so protect themselves and the system. … There is some protection so long as there are people who know, when they hear it said that history is being made in this market or that a new era has been opened, that the same history has been made and the same eras have been opened many, many times before. This acts to arrest the spread of illusion. …

With time, the number who are restrained by memory must decline. The historian, in a volume such as this, can hope that he provides a substitute for memory that slightly stays that decline.


The Beer Game

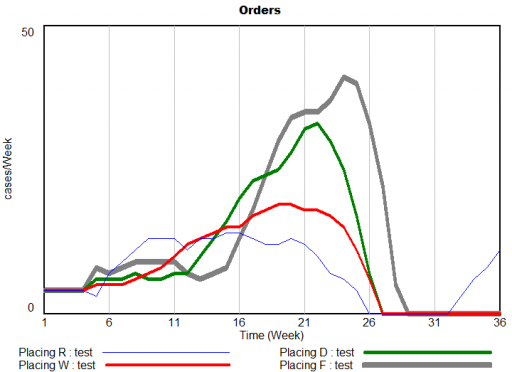
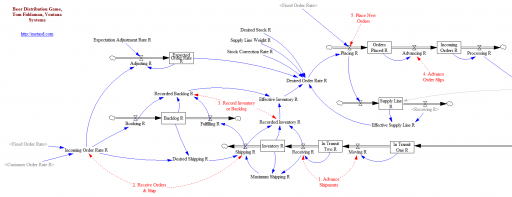
The Beer Game is the classic business game in system dynamics, demonstrating just how tricky it can be to manage a seemingly-simple system with delays and feedback. It’s a great icebreaker for teams, because it makes it immediately clear that catastrophes happen endogenously and fingerpointing is useless.

The system demonstrates amplification, aka the bullwhip effect, in supply chains. John Sterman analyzes the physical and behavioral origins of underperformance in the game in this Management Science paper. Steve Graves has some nice technical observations about similar systems in this MSOM paper.

Here are two versions that are close to the actual board game and the Sterman article:

Beer Game Fiddaman NoSubscripts.zip

This version doesn’t use arrays, and therefore should be usable in Vensim PLE. It includes a bunch of .cin files that implement the (calibrated) decision heuristics of real teams of the past, as well as some sensitivity and optimization control files.

Beer Game Fiddaman Array.zip

This version does use arrays to represent the levels of the supply chain. That makes it a little harder to grasp, but much easier to modify if you want to add or remove levels from the system or conduct optimization experiments. It requires Vensim Pro or DSS, or the Model Reader.

Big Data Gone Bad

An integrated market model is a hungry beast. It wants data from a variety of areas of a firm’s business, often from a variety of sources. As I said in my previous post, typically these data streams have never been considered together before, and therefore they’re full of contradictions and quality issues. Here’s a real world example, from the pharma business. The details are proprietary, and I’ve stylized the data, but the story is pretty simple.

Suppose you have a product with two different indications. One is short term (for injuries, a 4 month treatment), and one is long term (for a chronic condition, over 24 months). It’s of obvious interest to understand the two markets individually, to enable allocation of resources to distinct marketing efforts for each set of doctors and patients.

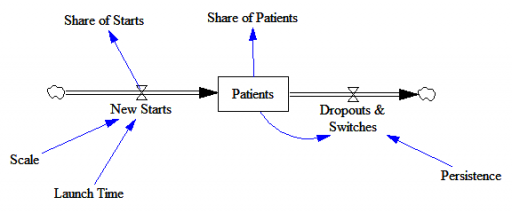
Here’s the structure of the market:

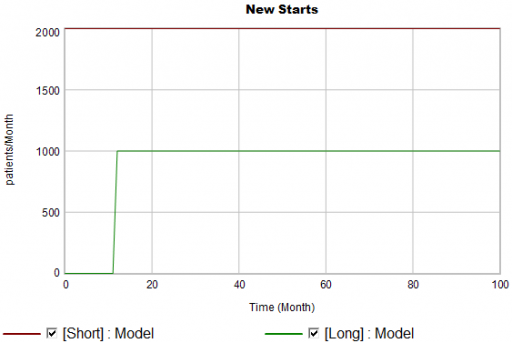
New patients are started on therapy. They remain in the stock of Patients for some time, before they drop out of therapy or switch to another drug. Initially, just the short term indication is approved; the long term indication gets approved a year into the simulation:

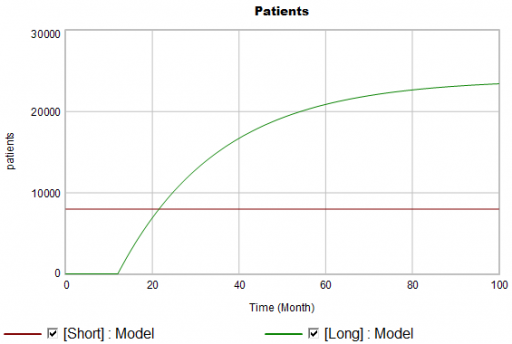
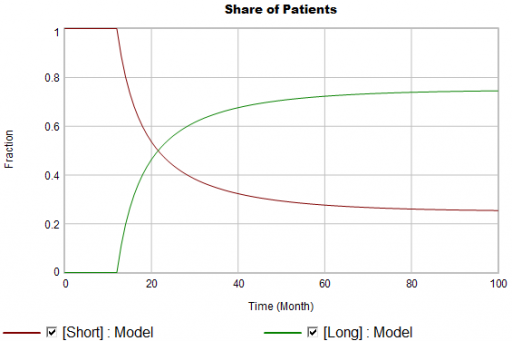
There are twice as many short term starts, but the long term patients stick around 6 times as long, so ultimately there are a lot more of them:

Notice that this is simple first-order goal seeking behavior. The long term patient population is rising toward an equilibrium of (1000 patients/month)x(24 months persistence)=24,000 patients, over a time scale of 24 months.

Puzzle #1

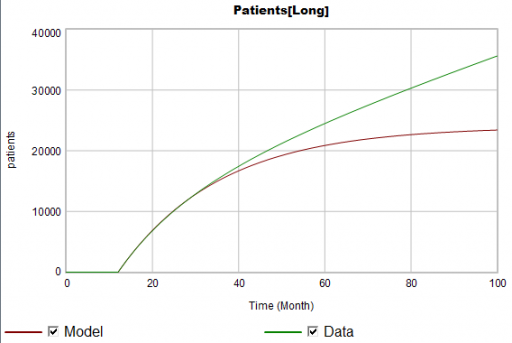
Suppose the data for the long term patients is doing something different (note that the colors now refer to model and data):

The model is goal-seeking, but the patient population data keeps rising. Bathtub dynamics says that it’s impossible for the step in the inflow of starts to integrate to this pattern when the outflow of dropouts is first order. You’d have to conclude that the model can’t fit the data, without invoking some additional assumptions. For example, the persistence of the long term patients might be increasing as doctors gain experience or the composition of the patient population changes.

But what if I told you that the driving data, new starts, isn’t a “real” measurement? First, new prescriptions aren’t easy to distinguish from refills, and there’s a certain amount of overcounting when patients switch pharmacies or otherwise drop out of the data, then reappear. Second, the short term and long term patients take the same drug, and prescription records don’t say why. So, the data vendor infers the split from dosages, prescriber specialties, and the phase of the moon. The inference happens in an undocumented black box algorithm and there’s no way to establish the ground truth of its performance.

Now, do you trust the algorithm, or doctors who say they know the duration of treatment – but might be missing something too?

Puzzle #2

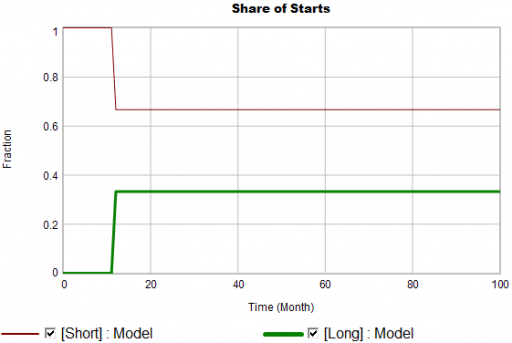
Even in the presence of algorithmic uncertainty, you’d expect certain dynamic reality checks to pass. Consider the share of long term patients in the market. For new starts, it’s a step function, rising from 0 to 1/3 at launch in month 12:

Again, from the bathtub, we know that the patient population can’t instantly mimic the step in starts. If the system is first order with constant persistence, the long term share of patients should rise gradually to 3/4 (1000*24/(1000*24+2000*4)). If persistence is increasing, per puzzle #1, it might go higher on a longer time scale, but it can’t go faster.

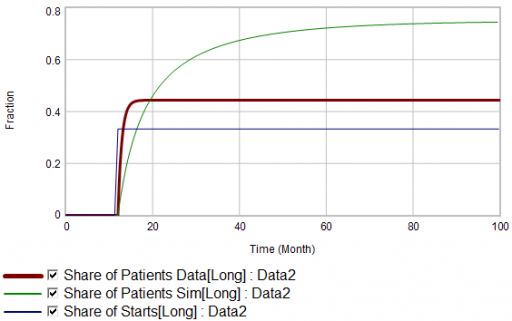
Now, suppose the data does something unexpected:

Here, the patient population share data mimics the share of new starts with a time constant that’s very short compared to the persistence of therapy. This should be dynamically impossible in a simple system. But, as always, you could start invoking time varying inputs or parameters to explain what the data shows. (And remember that the real data is noisy, making it harder to be sure about anything.)

But I think there’s another, simpler explanation. The data vendor could be using the same or similar algorithms to classify new starts and existing patients. It could be wrong about the inflow split, or wrong about the stocks, or both. And, it could be reclassifying existing patients from short to long and back with a time constant much faster than the persistence of therapy permits.

Conclusion

It turns out that, in spite of having lots of data about this system, we don’t actually know much. This is a problem for model calibration, because we don’t know which source to trust. Uncertainty in the calibration propagates into decision making. It’s awkward for people in the firm to revise the stories they’ve used to justify past actions. It ought to be awkward for the data vendor to provide flaky information, but luckily they have a near-monopoly.

But we still have options:

  • Track down the data issues. This is the most attractive idea in principle, but it might be slow and expensive to find someone at the data vendor who knows what’s going on, and even then the answer might be unsatisfactory.
  • Model the data. If some details of the data collection process are known, it’s often possible to reverse engineer the “real” data from flawed measurements.
  • Split the difference. Calibrate as best you can to all available information, including gut feel and known “physics” of the situation, not just the numerical data.
  • Embrace the uncertainty. If no theory fits the data, look for policies that are robust to alternative futures, and convey the irreducible uncertainty of the situation to decision makers.

A real challenge for modelers is that model consumers typically have science tastes on a propaganda budget. People are used to seeing data that looks precise, full of enticing detail, with conclusions that sound plausible, but are little more than superstition. It’s cheap to make nice graphics and long figure-rich Powerpoint decks.

Really sorting out what’s going on in situations like this is hard, but it can have great strategic value. For example, in this case, if persistence is increasing, it’s more critical than ever to win the long term patients. If market shares could differ dramatically from what measurements report, competitive threats and opportunities could go unnoticed. Anyone who can use models to discover the fog of data and see through it will have a real competitive edge.

A tale of Big Data and System Dynamics

I recently worked on a fascinating project that combined Big Data and System Dynamics (SD) to good effect. Neither method could have stood on its own, but the outcome really emphasized some of the strategic limitations of the data-driven approach. Including SD in the project simultaneously lowered the total cost of analysis, by avoiding data processing for things that could be determined a priori, and increased its value by connecting the data to business context.

I can’t give a direct account of what we did, because it’s proprietary, but here’s my best shot at the generalizable insights. The context was health care for some conditions that particularly affect low income and indigent populations. The patients are hard to track and hard to influence.

Two efforts worked in parallel: Big Data (led by another vendor) and System Dynamics (led by Ventana). I use the term “SD” loosely, because much of what we ultimately did was data-centric: agent based modeling and estimation of individual-level nonlinear dynamic models in Vensim. The Big Data vendor’s budget was two orders of magnitude greater than ours, mostly due to some expensive system integration tasks, but partly due to the caché of their brand and flashy approach, I suspect. Continue reading “A tale of Big Data and System Dynamics”

Data Science should be about more than data

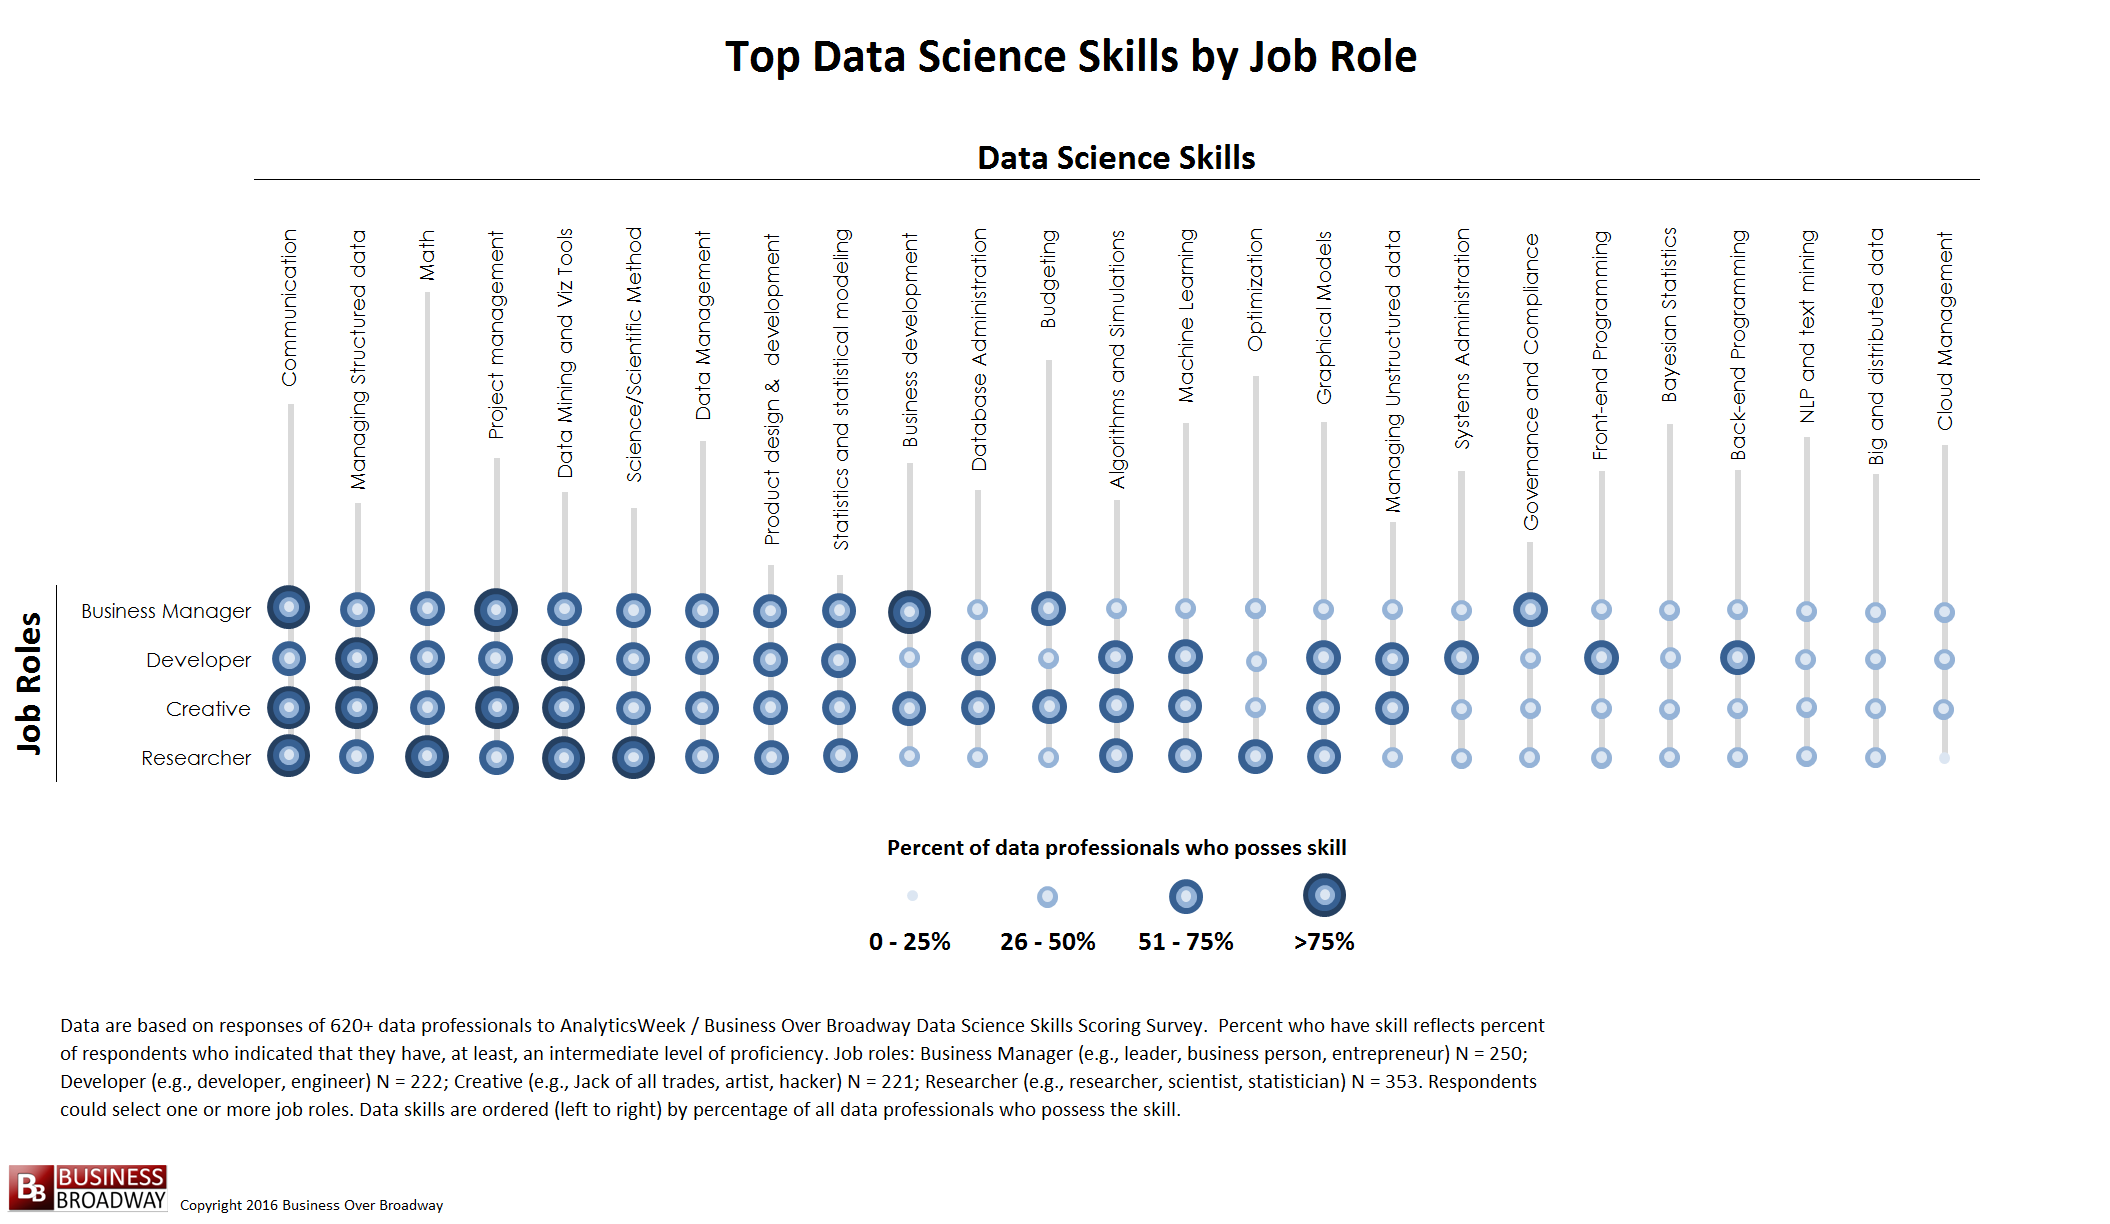
There are lots of “top 10 skills” lists for data science and analytics. The ones I’ve seen are all missing something huge.

Here’s an example:

Business Broadway – Top 10 Skills in Data Science

Modeling barely appears here. Almost all the items concern the collection and analysis of data (no surprise there). Just imagine for a moment what it would be like if science consisted purely of observation, with no theorizing.

What are you doing with all those data points and the algorithms that sift through them? At some point, you have to understand whether the relationships that emerge from your data make any sense and answer relevant questions. For that, you need ways of thinking and talking about the structure of the phenomena you’re looking at and the problems you’re trying to solve.

I’d argue that one’s literacy in data science is greatly enhanced by knowledge of mathematical modeling and simulation. That could be system dynamics, control theory, physics, economics, discrete event simulation, agent based modeling, or something similar. The exact discipline probably doesn’t matter, so long as you learn to formalize operational thinking about a problem, and pick up some good habits (like balancing units) along the way.

Data science meets the bottom line

A view from simulation & System Dynamics


I come to data science from simulation and System Dynamics, which originated in control engineering, rather than from the statistics and database world. For much of my career, I’ve been working on problems in strategy and public policy, where we have some access to mental models and other a priori information, but little formal data. The attribution of success is tough, due to the ambiguity, long time horizons and diverse stakeholders.

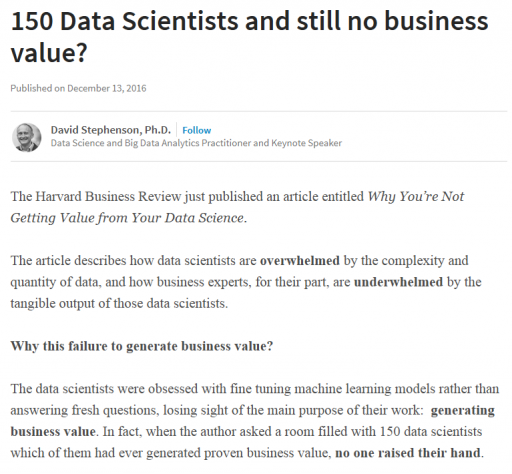
I’ve always looked over the fence into the big data pasture with a bit of envy, because it seemed that most projects were more tactical, and establishing value based on immediate operational improvements would be fairly simple. So, I was surprised to see data scientists’ angst over establishing business value for their work:

One part of solving the business value problem comes naturally when you approach things from the engineering point of view. It’s second nature to include an objective function in our models, whether it’s the cash flow NPV for a firm, a project’s duration, or delta-V for a rocket. When you start with an abstract statistical model, you have to be a little more deliberate about representing the goal after the model is estimated (a simulation model may be the delivery vehicle that’s needed).

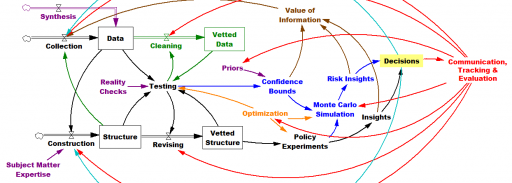
You can solve a problem whether you start with the model or start with the data, but I think your preferred approach does shape your world view. Here’s my vision of the simulation-centric universe:

The more your aspirations cross organizational silos, the more you need the engineering mindset, because you’ll have data gaps at the boundaries – variations in source, frequency, aggregation and interpretation. You can backfill those gaps with structural knowledge, so that the model-data combination yields good indirect measurements of system state. A machine learning algorithm doesn’t know about dimensional consistency, conservation of people, or accounting identities unless the data reveals such structure, but you probably do. On the other hand, when your problem is local, data is plentiful and your prior knowledge is weak, an algorithm can explore more possibilities than you can dream up in a given amount of time. (Combining the two approaches, by using prior knowledge of structure as “free data” constraints for automated model construction, is an area of active research here at Ventana.)

I think all approaches have a lot in common. We’re all trying to improve performance with systems science, we all have to deal with messy data that’s expensive to process, and we all face challenges formulating problems and staying connected to decision makers. Simulations need better connectivity to data and users, and purely data driven approaches aren’t going to solve our biggest problems without some strategic context, so maybe the big data and simulation worlds should be working with each other more.

Cross-posted from LinkedIn