
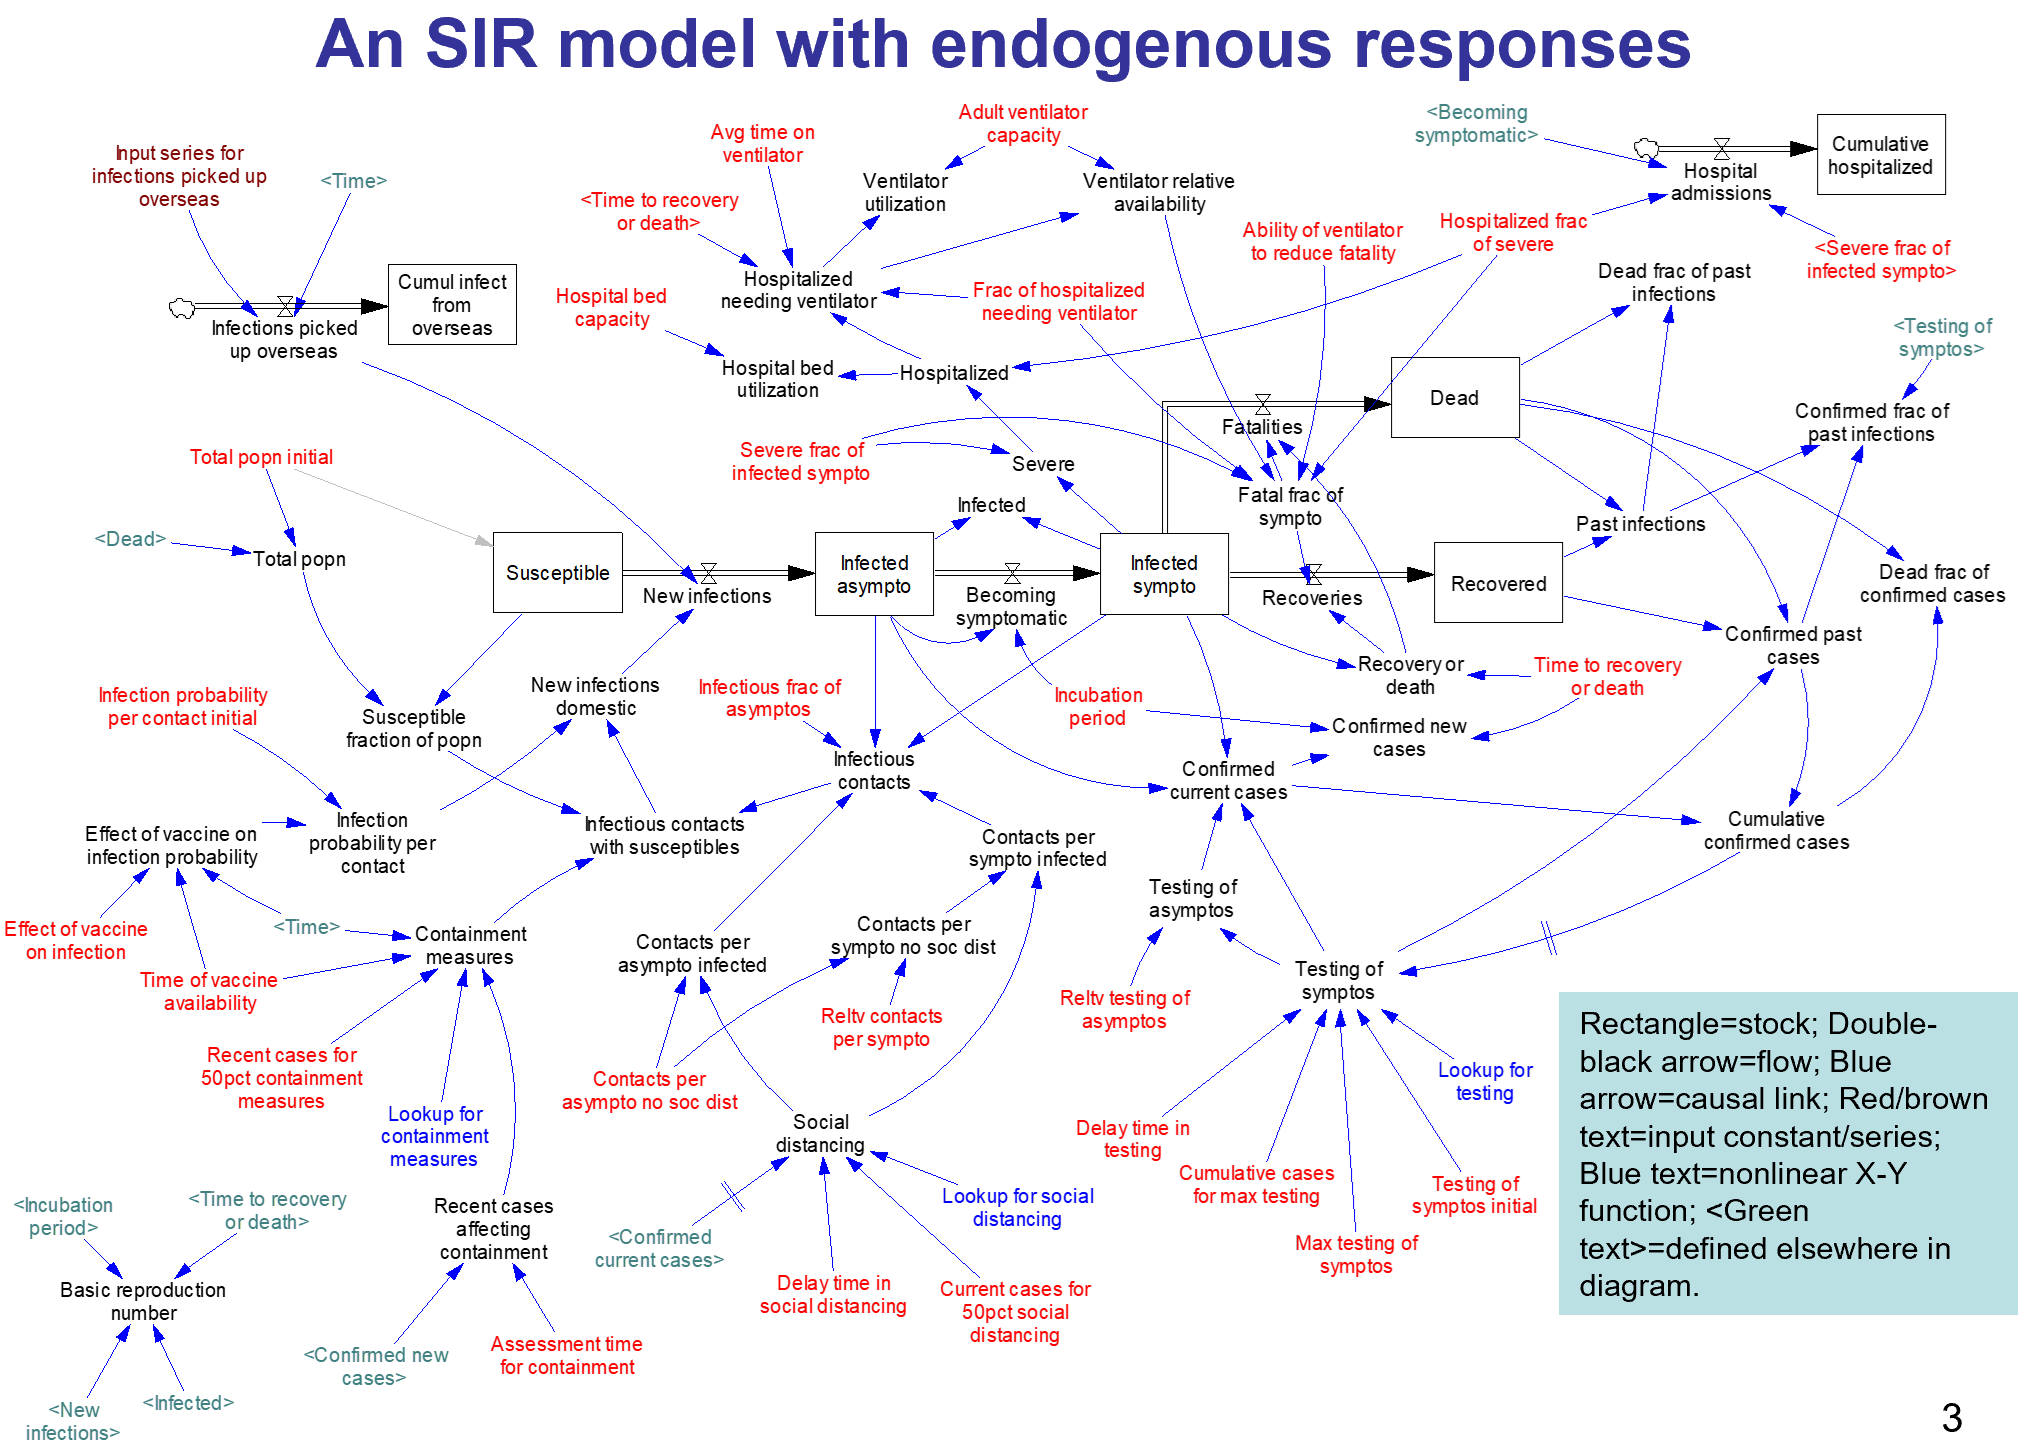
Here’s another COVID-19 model. This one’s from Jack Homer of Homer Consulting. Jack is a very creative modeler, the author of some SD classics like the worker burnout model, an SD blogger, and plays a central role in important projects like Rethink Health.
The core of the model is an SEIR chain, similar to my model. This adds some nice features, including endogenous testing and a feedback decision rule for control measures. It’s parameterized for the US.
I haven’t spent significant time with the model yet, so I can’t really comment. An alarming feature of this disease is that doublings occur on the same time scale as thinking through an iteration of a model, especially if coronavirus is not your day job. I hope to add some further thoughts when I’ve thinned my backlog a bit.
From the slide deck:
Conclusions
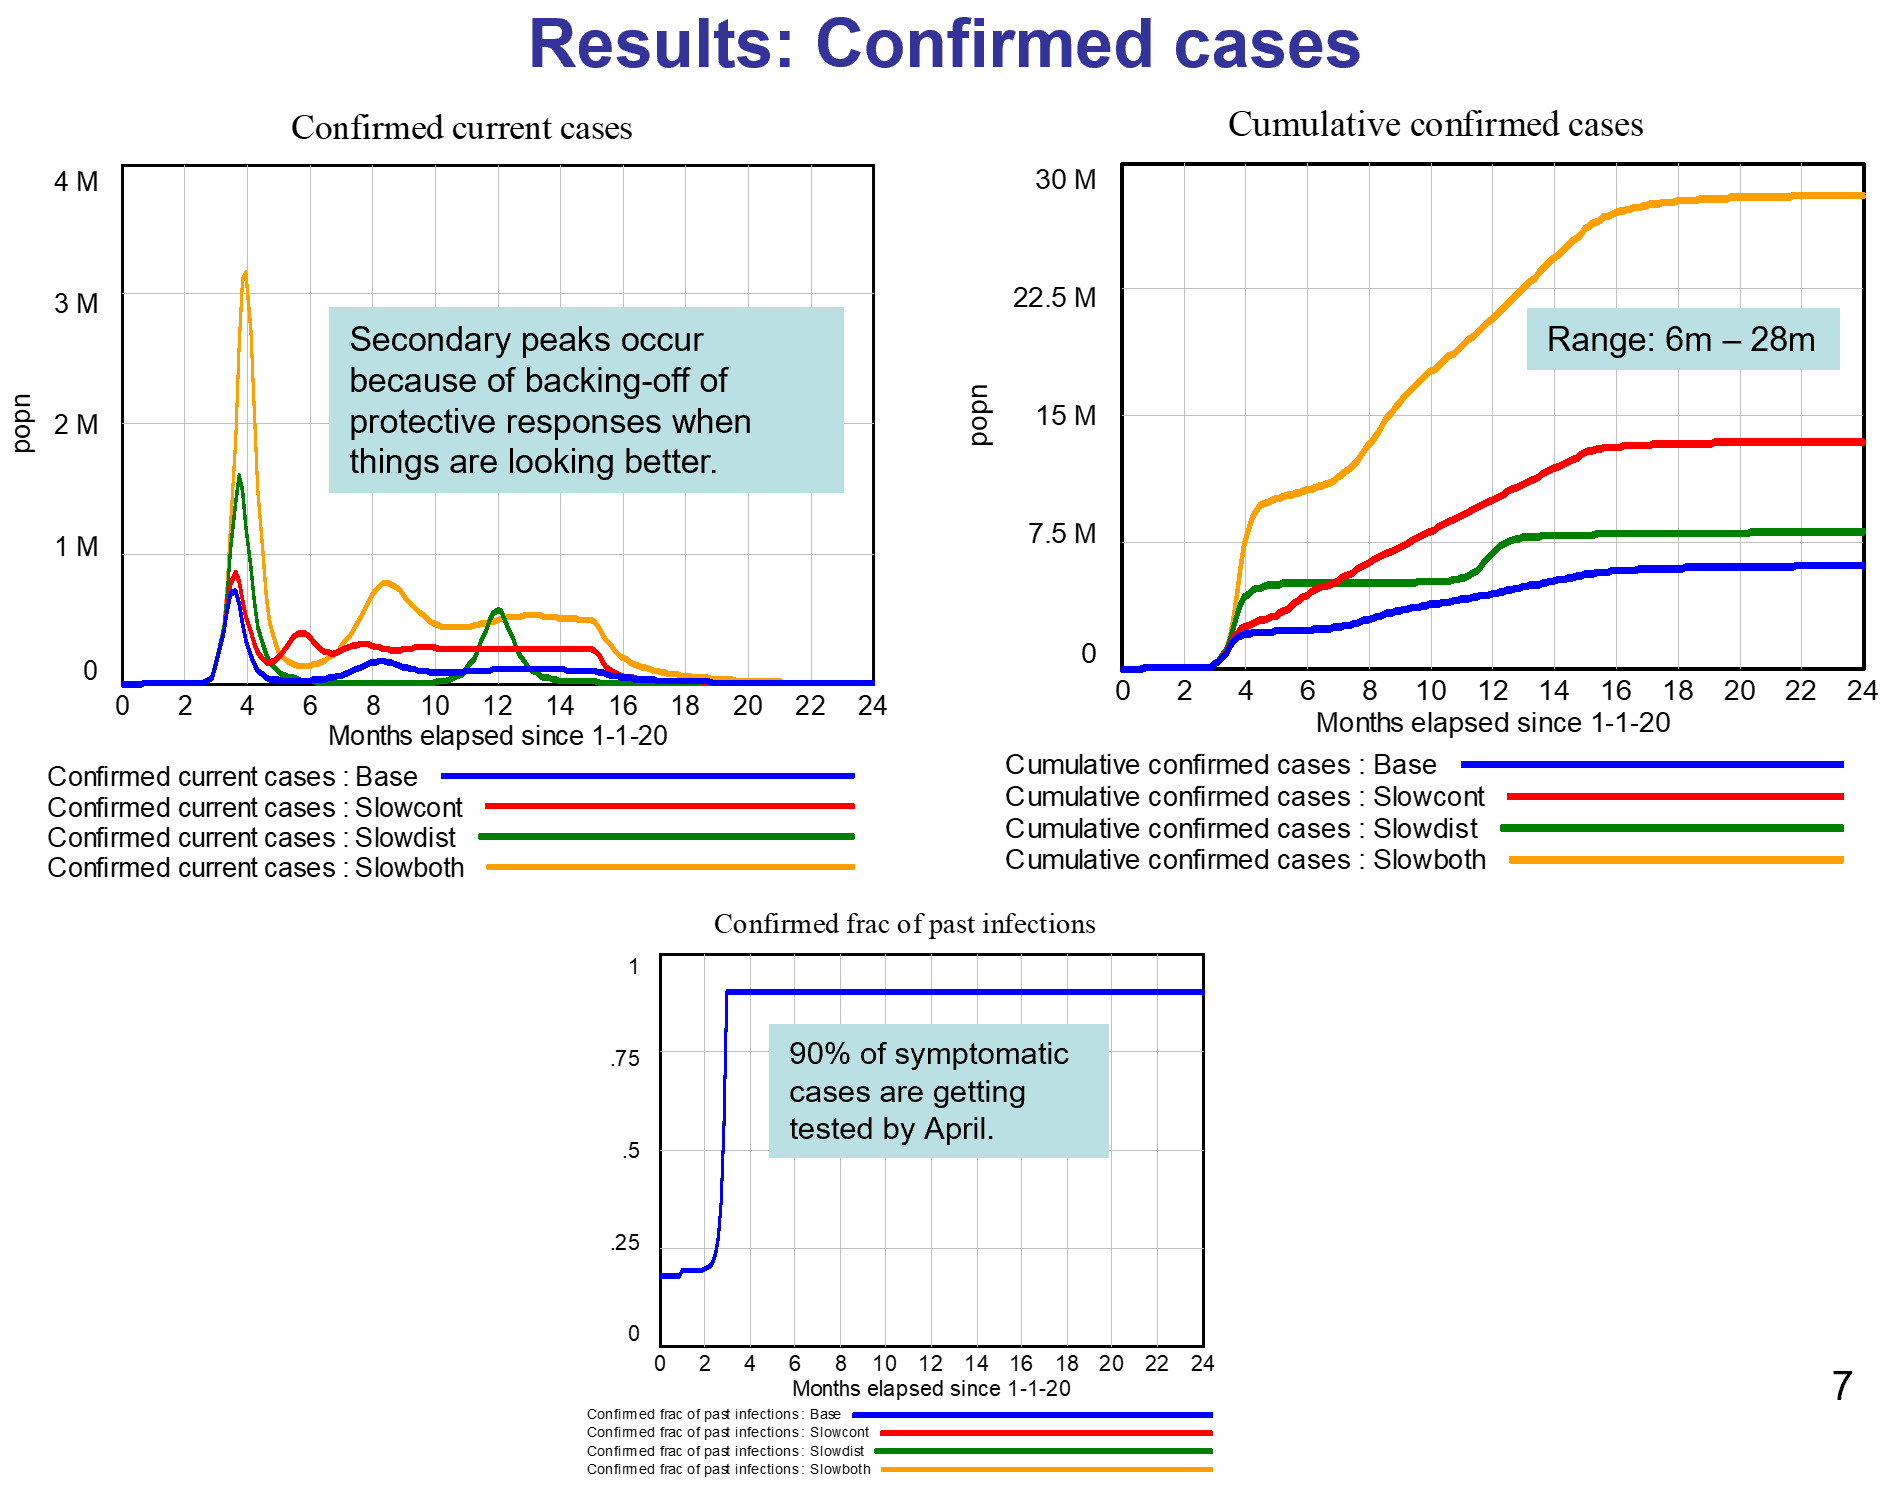
- The results here come from a model with several key numerical assumptions, especially around behavioral responses. As the 4 runs illustrate, if the assumptions are modified, the overall results change over some range of possibility.
- My assumptions about the behavioral responses were informed by what we been seeing recently in the US: a good response, even in regions not yet hard-hit. The message is out, and it is having an effect.
- Because of the responses, and despite the absence of a vaccine, I conclude this epidemic will not infect a third or half of the population as some have predicted. Rather, we are likely to see 6m-28m cases in the US in total, resulting in 100k-500k deaths. This projection assumes a vaccine available by next April.
- I also conclude that our hospital system overall has enough bed capacity to handle the peak load late April/early May; and enough ventilator capacity except during those 3 weeks in the more pessimistic Slowboth scenario. We would need 180k ventilators (rather than the assumed 120k) to avoid this shortage in the pessimistic scenario.
- I have not addressed here the impact of containment measures and social distancing on the economy, including the supply of food and other necessities. This supply is important, affecting our ability to maintain strong containment and distancing.
This archive contains the Vensim model in mdl and vpmx format, a custom graph set (already loaded in the model), and some runs:
A nice slide deck documenting the results:
This uses data via GET XLS so it won’t work with PLE; the Model Reader will work.
Update, 3/24/2020: This version refines the model. I’ve added a copy with the data variables deleted, that should work with PLE.
Update, 4/27/2020: