The predominant explanation for this week’s steep decline in the stock market is coronavirus. I take this as evidence that the pandemic of open-loop, event-based thinking is as strong as ever.
First, let’s look at some data. Here’s interest in coronavirus:
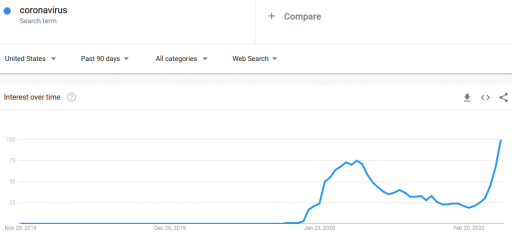
It was already pretty high at the end of January. Why didn’t the market collapse then? (In fact, it rose a little over February). Is there a magic threshold of disease, beyond which markets collapse?
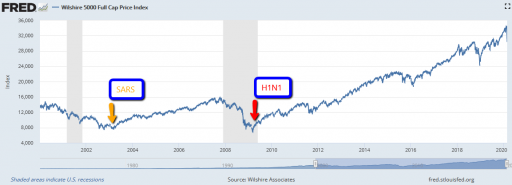
How about other pandemics? Interest in pandemics was apparently higher in 2009, with the H1N1 outbreak:
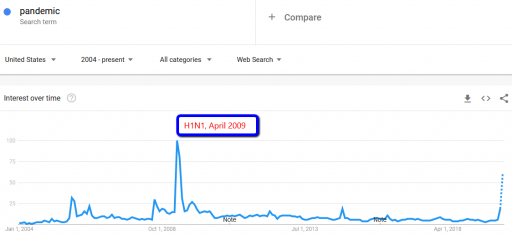
Did the market collapse then? No. In fact, that was the start of the long climb out of the 2007 financial crisis. The same was true for SARS, in spring 2003, in the aftermath of the dotcom bust.
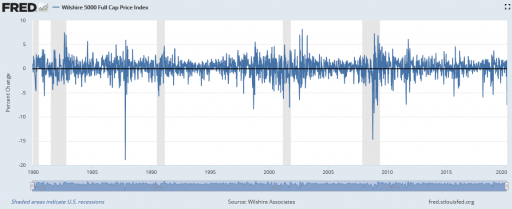
There are also lots of examples of market crashes, like 1987, that aren’t associated with pandemic fears at all. Corrections of this magnitude are actually fairly common (especially if you consider the percentage drop, not the inflated absolute drop):
I submit that the current attribution of the decline to coronavirus is primarily superstitious, and that the market is doing what it always does.
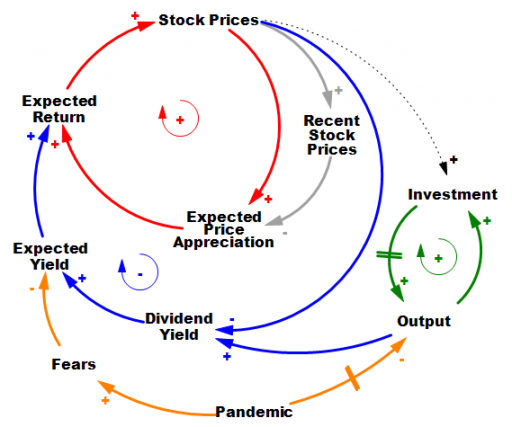
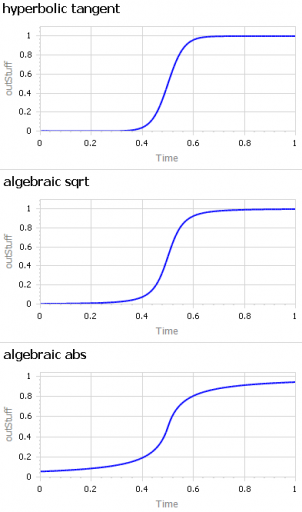
It’s hard to do it justice briefly, but the stock market is basically an overlay of a complicated allocation mechanism on top of the real economy. In the real economy (green positive loop) capital and technology accumulation increase output (thinking strictly of on-market effects). Growth in that loop proceeds steadily in the long run, but with bumps from business cycles. The stock market is sending signals to the real economy about how to invest, but that’s complicated, hence the dashed line.
In the stock market, prices reflect expectations about the future flow of dividends from the economy (blue negative loop). If that were the whole story, coronavirus (orange) would have to have induced fears of a drop in the NPV of future profits of about 10%. Hopefully that’s way outside any plausible scenario. So why the big drop? It’s due to the other half of the story. Expectations are formed partly on fundamentals, and partly on the expectation that the market will go up, because it’s been going up (red positive loop).
There are actually a number of mechanisms behind this: naive extrapolation, sophisticated exploitation of the greater fool, redirection of media attention to prognosticators of growth when they’re right, and so on. The specifics aren’t important; what matters is that they create a destabilizing reinforcing feedback loop that inflates bubbles. Then, when some shock sufficient to overcome the expectations of appreciation arrives, the red loop runs the other way, as a vicious cycle. Diminished expected returns spark selling, lowering prices, and further diminishing expectations of appreciation. If things get bad enough, liquidity problems and feedback to the real economy accentuate the problem, as in 1929.
Importantly, this structure makes the response of the market to bad news nonlinear and state-dependent. When SARS and H1N1 arrived, the market was already bottomed out. At such a point, the red loop is weak, because there’s not much speculative activity or enthusiasm. The fact that this pandemic is having a large impact, even while it’s still hypothetical, suggests that market expectations were already in a fragile state. If SARS-Cov-2 hadn’t come along to pop the bubble, some other sharp object would have done it soon: a bank bust, a crop failure, or maybe just a bad hot dog for an influential trader.
Coronavirus may indeed be the proximate cause of this week’s decline, in the same sense as the straw that broke the camel’s back. However, the magnitude of the decline is indicative of the fragility of the market state when the shock came along, and not necessarily of the magnitude of the shock itself. The root cause of the decline is that the structure of markets is prone to abrupt losses.
For a nice exploration of these dynamics, from the complexity/nonlinear dynamics thread of systems science, see Didier Sornette’s Why Stock Markets Crash: Critical Events in Complex Financial Systems.