Climate Causality Confusion

A newish set of papers (1. Theory (preprint); 2. Applications (preprint); 3. Extension) is making the rounds on the climate skeptic sites, with – ironically – little skepticism applied.

The claim is bold:

… According to the commonly assumed causality link, increased [CO2] causes a rise in T. However, recent developments cast doubts on this assumption by showing that this relationship is of the hen-or-egg type, or even unidirectional but opposite in direction to the commonly assumed one. These developments include an advanced theoretical framework for testing causality based on the stochastic evaluation of a potentially causal link between two processes via the notion of the impulse response function. …. All evidence resulting from the analyses suggests a unidirectional, potentially causal link with T as the cause and [CO2] as the effect.

Galileo complex seeps in when the authors claim that absence of correlation or impulse response from CO2 -> temperature proves absence of causality:

Clearly, the results […] suggest a (mono-directional) potentially causal system with T as the cause and [CO2] as the effect. Hence the common perception that increasing [CO2] causes increased T can be excluded as it violates the necessary condition for this causality direction.

Unfortunately, these claims are bogus. Here’s why.

The authors estimate impulse response functions between CO2 and temperature (and back), using the following formalism:


where g(h) is the response at lag h. As the authors point out, if

the IRF is zero for every lag except for the specific lag 0, then Equation (1) becomes y(t)=bx(t-h0) +v(t). This special case is equivalent to simply correlating  y(t) with x(t-h0) at any time instance . It is easy to find (cf. linear regression) that in this case the multiplicative constant is the correlation coefficient of y(t) and  x(t-h0) multiplied by the ratio of the standard deviations of the two processes.

Now … anyone who claims to have an “advanced theoretical framework for testing causality” should be aware of the limitations of linear regression. There are several possible issues that might lead to misleading conclusions about causality.

Problem #1 here is bathtub statistics. Temperature integrates the radiative forcing from CO2 (and other things). This is not debatable – it’s physics. It’s old physics, and it’s experimental, not observational. If you question the existence of the effect, you’re basically questioning everything back to the Enlightenment. The implication is that no correlation is expected between CO2 and temperature, because integration breaks pattern matching. The authors purport to avoid integration by using first differences of temperature and CO2. But differencing both sides of the equation doesn’t solve the integration problem; it just kicks the can down the road. If y integrates x, then patterns of the integrals or derivatives of y and x won’t match either. Even worse differencing filters out the signals of interest.

Problem #2 is that the model above assumes only equation error (the term v(t) on the right hand side). In most situations, especially dynamic systems, both the “independent” (a misnomer) and dependent variables are subject to measurement error, and this dilutes the correlation or slope of the regression line (aka attenuation bias), and therefore also the IRF in the authors’ framework. In the case of temperature, the problem is particularly acute, because temperature also integrates internal variability of the climate system (weather) and some of this variability is autocorrelated on long time scales (because for example oceans have long time constants). That means the effective number of data points is a lot less than the 60 years or 720 months you’d expect from simple counting.

Dynamic variables are subject to other pathologies, generally under the heading of endogeneity bias, and related features with similar effects like omitted variable bias. Generalizing the approach to distributed lags in no way mitigates these. The bottom line is that absence of correlation doesn’t prove absence of causation.

Admittedly, even Nobel Prize winners can screw up claims about causality and correlation and estimate dynamic models with inappropriate methods. But causality confusion isn’t really a good way to get into that rarefied company.

I think methods purporting to assess causality exclusively from data are treacherous in general. The authors’ proposed method is provably wrong in some cases, including this one, as is Granger Causality. Even if you have pretty good assumptions, you’ll always find a system that violates them. That’s why it’s so important to take data-driven results with a grain of salt, and look for experimental control (where you can get it) and mechanistic explanations.

One way to tell if you’ve gotten causality wrong is when you “discover” mechanisms that are physically absurd. That happens on a spectacular scale in the third paper:

… we find Δ=23.5 and 8.1 Gt C/year, respectively, i.e., a total global increase in the respiration rate of Δ=31.6 Gt C/year. This rate, which is a result of natural processes, is 3.4 times greater than the CO2 emission by fossil fuel combustion (9.4 Gt C /year including cement production).

To put that in perspective, the authors propose a respiration flow that would put the biosphere about 30% out of balance. This implies a mass flow of trees harvested, soils destroyed, etc. 3.4 times as large as the planetary flow of fossil fuels. That would be about 4 cubic kilometers of wood, for example. In the face of the massive outflow from the biosphere, the 9.4 GtC/yr from fossil fuels went where, exactly? Extraordinary claims require extraordinary evidence, but the authors apparently haven’t pondered how these massive novel flows could be squared with other lines of evidence, like C isotopes, ocean Ph, satellite CO2, and direct estimates of land use emissions.

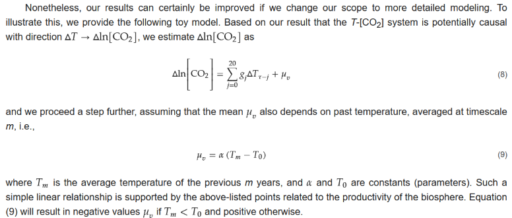
This “insight” is used to construct a model of the temperature->CO2 process:

In this model, the trend in CO2 is explained almost exclusively by the mean temperature effect mu_v = alpha*(T-T0). That effect is entirely ad hoc, with no basis in the impulse response framework.

How do we get into this pickle? I think the simple answer is that the authors’ specification of the system is incomplete. As above, they define a causal system,

y(t) = ∫g1(h)x(t-h)dh

x(t) = ∫g2(h)y(t-h)dh

where g(.) is an impulse response function weighting lags h and the integral is over h from 0 to infinity (because only nonnegative lags are causal). In their implementation, x and y are first differences, so in their climate example, Δlog(CO2) and ΔTemp. In the estimation of the impulse lag structures g(.), the authors impose nonnegativity and (optionally) smoothness constraints.

A more complete specification is roughly:

Y = A*X + U

dX/dt = B*X + E

where

  • X is a vector of system states (e.g., CO2 and temperature)
  • Y is a vector of measurements (observed CO2 and temperature)
  • A and B are matrices of coefficients (this is a linear view of the system, but could easily be generalized to nonlinear functions)
  • E is driving noise perturbing the state, and therefore integrated into it
  • U is measurement error

My notation could be improved to consider covariance and state-dependent noise, though it’s not really necessary here. Fred Schweppe wrote all this out decades ago in Uncertain Dynamic Systems, and you can now find it in many texts like Stengel’s Optimal Control and Estimation. Dixit and Pindyck transplanted it to economics and David Peterson brought it to SD where it found its way into Vensim as the combination of Kalman filtering and optimization.

How does this avoid the pitfalls of the Koutsoyiannis et al. approach?

  • An element of X can integrate any other element of X, including itself.
  • There are no arbitrary restrictions (like nonnegativity) on the impulse response function.
  • The system model (A, B, and any nonlinear elements augmenting the framework) can incorporate a priori structural knowledge (e.g., physics).
  • Driving noise and measurement error are recognized and can be estimated along with everything else.

Does the difference matter? I’ll leave that for a second post with some examples.


Sea level update – newish work

I linked some newish work on sea level by Aslak Grinsted et al. in my last post. There are some other new developments:

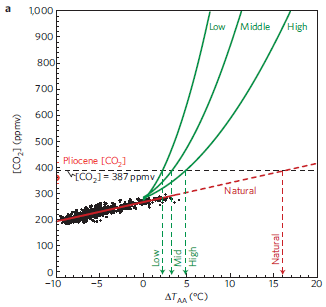
On the data front, Rohling et al. investigate sea level over the last half a million years and in the Pliocene (3+ million years ago). Here’s the relationship between CO2 and Antarctic temperatures:

Rohling Fig 2A

Two caveats and one interesting observation here:

  • The axes are flipped; if you think causally with CO2 on the x-axis, you need to mentally reflect this picture.
  • TAA refers to Antarctic temperature, which is subject to polar amplification
  • Notice that the empirical line (red) is much shallower than the relationship in model projections (green). Since the axes are flipped, that means that empirical Antarctic temperatures are much more sensitive to CO2 than projections, if it’s valid to extrapolate, and we wait long enough.

Continue reading “Sea level update – newish work”

Polar Bears & Principles

Amstrup et al. have just published a rebuttal of the Armstrong, Green & Soon critique of polar bear assessments. Polar bears aren’t my area, and I haven’t read the original, so I won’t comment on the ursine substance. However, Amstrup et al. reinforce many of my earlier objections to (mis)application of forecasting principles, so here are some excerpts:

The Principles of Forecasting and Their Use in Science

… AGS based their audit on the idea that comparison to their self-described principles of forecasting could produce a valid critique of scientific results. AGS (p. 383) claimed their principles ‘summarize all useful knowledge about forecasting.’ Anyone can claim to have a set of principles, and then criticize others for violating their principles. However, it takes more than a claim to create principles that are meaningful or useful. In concluding our rejoinder, we point out that the principles espoused by AGS are so deeply flawed that they provide no reliable basis for a rational critique or audit.

Failures of the Principles

Armstrong (2001) described 139 principles and the support for them. AGS (pp. 382’“383) claimed that these principles are evidence based and scientific. They fail, however, to be evidence based or scientific on three main grounds: They use relative terms as if they were absolute, they lack theoretical and empirical support, and they do not follow the logical structure that scientific criticisms require.

Using Relative Terms as Absolute

Many of the 139 principles describe properties that models, methods, and (or) data should include. For example, the principles state that data sources should be diverse, methods should be simple, approaches should be complex, representations should be realistic, data should be reliable, measurement error should be low, explanations should be clear, etc. … However, it is impossible to look at a model, a method, or a datum and decide whether its properties meet or violate the principles because the properties of these principles are inherently relative.

Consider diverse. AGS faulted H6 for allegedly failing to use diverse sources of data. However, H6 used at least six different sources of data (mark-recapture data, radio telemetry data, data from the United States and Canada, satellite data, and oceanographic data). Is this a diverse set of data? It is more diverse than it would have been if some of the data had not been used. It is less diverse than it would have been if some (hypothetical) additional source of data had been included. To criticize it as not being diverse, however, without providing some measure of comparison, is meaningless.

Consider simple. What is simple? Although it might be possible to decide which of two models is simpler (although even this might not be easy), it is impossible’”in principle’”to say whether any model considered in isolation is simple or not. For example, H6 included a deterministic time-invariant population model. Is this model simple? It is certainly simpler than the stationary, stochastic model, or the nonstationary stochastic model also included in H6. However, without a measure of comparison, it is impossible to say which, if any, are ‘simple.’ For AGS to criticize the report as failing to use simple models is meaningless.

A Lack of Theoretical and Empirical Support

If the principles of forecasting are to serve as a basis for auditing the conclusions of scientific studies, they must have strong theoretical and (or) empirical support. Otherwise, how do we know that these principles are necessary for successful forecasts? Closer examination shows that although Armstrong (2001, p. 680) refers to evidence and AGS (pp. 382’“383) call the principles evidence based, almost half (63 of 139) are supported only by received wisdom or common sense, with no additional empirical or theoretical support. …

Armstrong (2001, p. 680) defines received wisdom as when ‘the vast majority of experts agree,’ and common sense as when ‘it is difficult to imagine that things could be otherwise.’ In other words, nearly half of the principles are supported only by opinions, beliefs, and imagination about the way that forecasting should be done. This is not evidence based; therefore, it is inadequate as a basis for auditing scientific studies. … Even Armstrong’s (2001) own list includes at least three cases of principles that are supported by what he calls strong empirical evidence that ‘refutes received wisdom’’”that is, at least three of the principles contradict received wisdom. …

Forecasting Audits Are Not Scientific Criticism

The AGS audit failed to distinguish between scientific forecasts and nonscientific forecasts. Scientific forecasts, because of their theoretical basis and logical structure based upon the concept of hypothesis testing, are almost always projections. That is, they have the logical form of ‘if X happens, then Y will follow.’ The analyses in AMD and H6 take exactly this form. A scientific criticism of such a forecast must show that even if X holds, Y does not, or need not, follow.

In contrast, the AGS audit simply scored violations of self-defined principles without showing how the identified violation might affect the projected result. For example, the accusation that H6 violated the commandment to use simple models is not a scientific criticism, because it says nothing about the relative simplicity of the model with respect to other possible choices. It also says nothing about whether the supposedly nonsimple model in question is in error. A scientific critique on the grounds of simplicity would have to identify a complexity in the model, and show that the complexity cannot be defended scientifically, that the complexity undermines the credibility of the model, and that a simpler model can resolve the issue. AGS did none of these.

There’s some irony to all this. Armstrong & Green criticize climate predictions as mere opinions cast in overly-complex mathematical terms, lacking predictive skill. The instrument of their critique is a complex set of principles, mostly derived from opinions, with undemonstrated ability to predict the skill of models and forecasts.

Unprincipled Forecast Evaluation

I hadn’t noticed until I heard it here, but Armstrong & Green are back at it, with various claims that climate forecasts are worthless. In the Financial Post, they criticize the MIT Joint Program model,

… No more than 30% of forecasting principles were properly applied by the MIT modellers and 49 principles were violated. For an important problem such as this, we do not think it is defensible to violate a single principle.

As I wrote in some detail here, the Forecasting Principles are a useful seat-of-the-pants guide to good practices, but there’s no evidence that following them all is necessary or sufficient for a good outcome. Some are likely to be counterproductive in many situations, and key elements of good modeling practice are missing (for example, balancing units of measure).

It’s not clear to me that A&G really understand models and modeling. They seem to view everything through the lens of purely statistical methods like linear regression. Green recently wrote,

Another important principle is that the forecasting method should provide a realistic representation of the situation (Principle 7.2). An interesting statement in the MIT report that implies (as one would expect given the state of knowledge and omitted relationships) that the modelers have no idea to what extent their models provide a realistic representation of reality is as follows:

‘Changes in global surface average temperature result from a combination of emissions and climate parameters, and therefore two runs that look similar in terms of temperature may be very different in detail.’ (MIT Report p. 28)

While the modelers have sufficient latitude in their parameters to crudely reproduce a brief period of climate history, there is no reason to believe the models can provide useful forecasts.

What the MIT authors are saying, in essence, is that

T = f(E,P)

and that it is possible to achieve the same future temperature T with different combinations of emissions E and parameters P. Green seems to be taking a leap, to assume that historic T does not provide much constraint on P. First, that’s not necessarily true, given that historic E cannot be chosen freely. It could still be the case that the structure of f(E,P) means that historic T provides a weak constraint on P given E. But if that’s true (as it basically is), the problem is self-diagnosing: estimates of P will have broad confidence bounds, as will forecasts of T. Green completely ignores the MIT authors’ explicit characterization of this uncertainty. He also ignores the fact that the output of the model is not just T, and that we have priors for many elements of P (from more granular models or experiments, for example). Thus we have additional lines of evidence with which to constrain forecasts. Green also neglects to consider the implications of uncertainties in P that are jointly distributed in an offsetting manner (as is likely for climate sensitivity, ocean circulation, and aerosol forcing).

A&G provide no formal method to distinguish between situations in which models yield useful or spurious forecasts. In an earlier paper, they claimed rather broadly,

‘To our knowledge, there is no empirical evidence to suggest that presenting opinions in mathematical terms rather than in words will contribute to forecast accuracy.’ (page 1002)

This statement may be true in some settings, but obviously not in general. There are many situations in which mathematical models have good predictive power and outperform informal judgments by a wide margin.

A&G’s latest paper with Willie Soon, Validity of Climate Change Forecasting for Public Policy Decision Making, apparently forthcoming in IJF, is an attempt to make the distinction, i.e. to determine whether climate models have any utility as predictive tools. An excerpt from the abstract summarizes their argument:

Policymakers need to know whether prediction is possible and if so whether any proposed forecasting method will provide forecasts that are substantively more accurate than those from the relevant benchmark method. Inspection of global temperature data suggests that it is subject to irregular variations on all relevant time scales and that variations during the late 1900s were not unusual. In such a situation, a ‘no change’ extrapolation is an appropriate benchmark forecasting method. … The accuracy of forecasts from the benchmark is such that even perfect forecasts would be unlikely to help policymakers. … We nevertheless demonstrate the use of benchmarking with the example of the Intergovernmental Panel on Climate Change’s 1992 linear projection of long-term warming at a rate of 0.03°C-per-year. The small sample of errors from ex ante projections at 0.03°C-per-year for 1992 through 2008 was practically indistinguishable from the benchmark errors. … Again using the IPCC warming rate for our demonstration, we projected the rate successively over a period analogous to that envisaged in their scenario of exponential CO2 growth’”the years 1851 to 1975. The errors from the projections were more than seven times greater than the errors from the benchmark method. Relative errors were larger for longer forecast horizons. Our validation exercise illustrates the importance of determining whether it is possible to obtain forecasts that are more useful than those from a simple benchmark before making expensive policy decisions.

There are many things wrong here:

  1. Demonstrating that unforced variability (history) can be adequately forecasted by a naive benchmark has no bearing on whether future forced variability will continue to be well-represented, or whether models can predict future emergence of a signal from noise. AG&S’ procedure is like watching an airplane taxi, concluding that aerodynamics knowledge is of no advantage, and predicting that the plane will remain on the ground forever.
  2. Comparing a naive forecast for global mean temperature against models amounts to a rejection of a vast amount of information. What is the naive forecast for the joint behavior of temperature, preciptiation, lapse rates, sea level, and their spatial and seasonal patterns? These have been evaluated for models, but AG&S do not suggest benchmarks.
  3. A no-change forecast is not necessarily the best naive forecast for a series with unknown variability, if that series has some momentum or structure which can be exploited to do better. The particular no change forecast selected byAG&S is suboptimal, because it uses a single year as a forecast, unneccesarily projecting annual variation into the future. In general, a stronger naive forecast (e.g., a smoothed value of a few recent years) would strengthen AG&S’ case, so it’s unclear why they’ve chosen an excessively naive benchmark. Fortunately, their base year, 1991, was rather “average”.
  4. The first exhibit presented is the EPICA ice core temperature. Roughly 85% of the data shown has a time interval too long to show century-scale temperature variations, and none of it could be expected to fully reveal decadal-scale variations, so it’s mostly irrelevant with respect to the kind of forecasts they seek to evaluate.
  5. The mere fact that a series has unknown historic variability does not mean that it cannot be forecast [corrected 8/18/09]. The EPICA and Vostok CO2 records look qualitatively much like the temperature record, yet CO2 accumulation in the atmosphere is quite predictable over decadal time scales, and models could handily beat a naive forecast.
  6. AG&S’ method of forecast evaluation unduly weights the short term, like the A&G sucker bet does. This is not strictly a problem, but it does make interpretation of the bounds on AG&S’ alternate forecast (“The benchmark forecast is that the global mean temperature for each year for the rest of this century will be within 0.5°C of the 2008 figure.”) a little tricky.
  7. The retrospective evaluation of the 1990/1992 IPCC projection of 0.3C/decade ignores many factors. First, 0.3C/decade over a century does not imply a smooth trend over short time scales; models and reality have substantial unforced variability which must be taken into account. The paragraph cited by AG&S includes the statement, “The rise will not be steady because of the influence of other factors.” Second, the 1992 report (in the very paragraph AG&S cite) notes that projections do not account for aerosols, so 0.3C/decade can’t be taken as a point prediction for the future, even if contingency on GHG emissions is resolved. Third, the IPCC projection stated approximate bounds – 0.2 to 0.5 C/decade – that should be accounted for in the evaluation, but are not. Still, the IPCC projection beats the naive benchmark.
  8. AG&S’ evaluation of the 0.3C/decade future BAU projection as a backcast over 1851-1975 is absurd. They write, “It is not unreasonable, then, to suppose for the purposes of our validation illustration that scientists in 1850 had noticed that the increasing industrialization of the world was resulting in exponential growth in ‘greenhouse gases’ and to project that this would lead to global warming of 0.03°C per year.” Actually, it’s completely unreasonable. Many figures in the 1990 FAR clearly indicate that the 0.3C/decade projection was not valid on [-infinity,infinity]. For example, figures 6, 8, and 9 from the SPM – just a few pages from material cited by AG&S – clearly show a gentle trend <0.05C/decade through 1950. Furthermore, even the most rudimentary understanding of the dynamics of GHG and heat accumulation is sufficient to realize that one would not expect a linear historic temperature trend to emerge from the emissions signal.

How do AG&S arrive at this sorry state? Their article embodies a “sh!t happens” epistemology. They write, “The belief that ‘things have changed’ and the future cannot be judged by the past is common, but invalid.” The problem is, one can say with equal confidence that, “the belief that ‘things never change’ and the past reveals the future is common, but invalid.” In reality, there are predictable phenomena (the orbits of the planets) and unpredictable ones (the fall of the Berlin wall). AG&S have failed to establish that climate is unpredictable or to provide us with an appropriate method for deciding whether it is predictable or not. Nor have they given us any insight into how to know or what to do if we can’t decide. Doing nothing because we think we don’t know anything is probably better than sacrificing virgins to the gods, but it doesn’t strike me as a robust strategy.

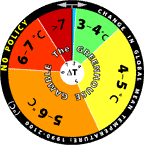
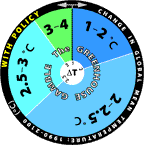
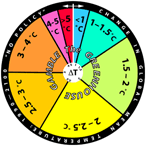
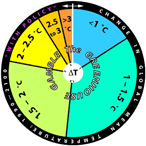
MIT Updates Greenhouse Gamble

For some time, the MIT Joint Program has been using roulette wheels to communicate climate uncertainty. They’ve recently updated the wheels, based on new model projections:

No Policy Policy
New No policy Policy
Old Old no policy Old policy

The changes are rather dramatic, as you can see. The no-policy wheel looks like the old joke about playing Russian Roulette with an automatic. A tiny part of the difference is a baseline change, but most is not, as the report on the underlying modeling explains:

The new projections are considerably warmer than the 2003 projections, e.g., the median surface warming in 2091 to 2100 is 5.1°C compared to 2.4°C in the earlier study. Many changes contribute to the stronger warming; among the more important ones are taking into account the cooling in the second half of the 20th century due to volcanic eruptions for input parameter estimation and a more sophisticated method for projecting GDP growth which eliminated many low emission scenarios. However, if recently published data, suggesting stronger 20th century ocean warming, are used to determine the input climate parameters, the median projected warning at the end of the 21st century is only 4.1°C. Nevertheless all our simulations have a very small probability of warming less than 2.4°C, the lower bound of the IPCC AR4 projected likely range for the A1FI scenario, which has forcing very similar to our median projection.

I think the wheels are a cool idea, but I’d be curious to know how users respond to it. Do they cheat, and spin to get the outcome they hope for? Perhaps MIT should spice things up a bit, by programming an online version that gives users’ computers the BSOD if they roll a >7C world.

Hat tip to Travis Franck for pointing this out.

Sea Level Rise – VI – The Bottom Line (Almost)

The pretty pictures look rather compelling, but we’re not quite done. A little QC is needed on the results. It turns out that there’s trouble in paradise:

  1. the residuals (modeled vs. measured sea level) are noticeably autocorrelated. That means that the model’s assumed error structure (a white disturbance integrated into sea level, plus white measurement error) doesn’t capture what’s really going on. Either disturbances to sea level are correlated, or sea level measurements are subject to correlated errors, or both.
  2. attempts to estimate the driving noise on sea level (as opposed to specifying it a priori) yield near-zero values.

#1 is not really a surprise; G discusses the sea level error structure at length and explicitly address it through a correlation matrix. (It’s not clear to me how they handle the flip side of the problem, state estimation with correlated driving noise – I think they ignore that.)

#2 might be a consequence of #1, but I haven’t wrapped my head around the result yet. A little experimentation shows the following:

driving noise SD equilibrium sensitivity (a, mm/C) time constant (tau, years) sensitivity (a/tau, mm/yr/C)
~ 0 (1e-12) 94,000 30,000 3.2
1 14,000 4400 3.2
10 1600 420 3.8

Intermediate values yield values consistent with the above. Shorter time constants are consistent with expectations given higher driving noise (in effect, the model is getting estimated over shorter intervals), but the real point is that they’re all long, and all yield about the same sensitivity.

The obvious solution is to augment the model structure to include states representing persistent errors. At the moment, I’m out of time, so I’ll have to just speculate what that might show. Generally, autocorrelation of the errors is going to reduce the power of these results. That is, because there’s less information in the data than meets the eye (because the measurements aren’t fully independent), one will be less able to discriminate among parameters. In this model, I seriously doubt that the fundamental banana-ridge of the payoff surface is going to change. Its sides will be less steep, reflecting the diminished power, but that’s about it.

Assuming I’m right, where does that leave us? Basically, my hypotheses in Part IV were right. The likelihood surface for this model and data doesn’t permit much discrimination among time constants, other than ruling out short ones. R’s very-long-term paleo constraint for a (about 19,500 mm/C) and corresponding long tau is perfectly plausible. If anything, it’s more plausible than the short time constant for G’s Moberg experiment (in spite of a priori reasons to like G’s argument for dominance of short time constants in the transient response). The large variance among G’s experiment (estimated time constants of 208 to 1193 years) is not really surprising, given that large movements along the a/tau axis are possible without degrading fit to data. The one thing I really can’t replicate is G’s high sensitivities (6.3 and 8.2 mm/yr/C for the Moberg and Jones/Mann experiments, respectively). These seem to me to lie well off the a/tau ridgeline.

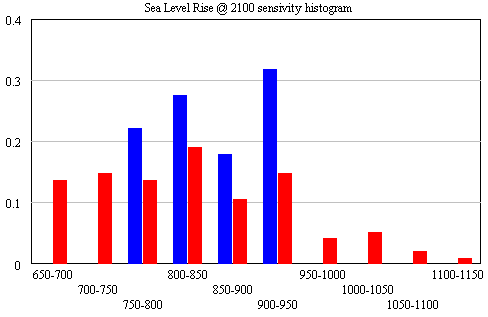
The conclusion that IPCC WG1 sea level rise is an underestimate is robust. I converted Part V’s random search experiment (using the optimizer) into sensitivity files, permitting Monte Carlo simulations forward to 2100, using the joint a-tau-T0 distribution as input. (See the setup in k-grid-sensi.vsc and k-grid-sensi-4x.vsc for details). I tried it two ways: the 21 points with a deviation of less than 2 in the payoff (corresponding with a 95% confidence interval), and the 94 points corresponding with a deviation of less than 8 (i.e., assuming that fixing the error structure would make things 4x less selective). Sea level in 2100 is distributed as follows:

Sea level distribution in 2100

The sample would have to be bigger to reveal the true distribution (particularly for the “overconfident” version in blue), but the qualitative result is unlikely to change. All runs lie above the IPCC range (.26-.59), which excludes ice dynamics.

Continue reading “Sea Level Rise – VI – The Bottom Line (Almost)”

Sea Level Rise Models – V

To take a look at the payoff surface, we need to do more than the naive calibrations I’ve used so far. Those were adequate for choosing constant terms that aligned the model trajectory with the data, given a priori values of a and tau. But that approach could give flawed estimates and confidence bounds when used to estimate the full system.

Elaborating on my comment on estimation at the end of Part II, consider a simplified description of our model, in discrete time:

(1) sea_level(t) = f(sea_level(t-1), temperature, parameters) + driving_noise(t)

(2) measured_sea_level(t) = sea_level(t) + measurement_noise(t)

The driving noise reflects disturbances to the system state: in this case, random perturbations to sea level. Measurement noise is simply errors in assessing the true state of global sea level, which could arise from insufficient coverage or accuracy of instruments. In the simple case, where driving and measurement noise are both zero, measured and actual sea level are the same, so we have the following system:

(3) sea_level(t) = f(sea_level(t-1), temperature, parameters)

In this case, which is essentially what we’ve assumed so far, we can simply initialize the model, feed it temperature, and simulate forward in time. We can estimate the parameters by adjusting them to get a good fit. However, if there’s driving noise, as in (1), we could be making a big mistake, because the noise may move the real-world state of sea level far from the model trajectory, in which case we’d be using the wrong value of sea_level(t-1) on the right hand side of (1). In effect, the model would blunder ahead, ignoring most of the data.

In this situation, it’s better to use ordinary least squares (OLS), which we can implement by replacing modeled sea level in (1) with measured sea level:

(4) sea_level(t) = f(measured_sea_level(t-1), temperature, parameters)

In (4), we’re ignoring the model rather than the data. But that could be a bad move too, because if measurement noise is nonzero, the sea level data could be quite different from true sea level at any point in time.

The point of the Kalman Filter is to combine the model and data estimates of the true state of the system. To do that, we simulate the model forward in time. Each time we encounter a data point, we update the model state, taking account of the relative magnitude of the noise streams. If we think that measurement error is small and driving noise is large, the best bet is to move the model dramatically towards the data. On the other hand, if measurements are very noisy and driving noise is small, better to stick with the model trajectory, and move only a little bit towards the data. You can test this in the model by varying the driving noise and measurement error parameters in SyntheSim, and watching how the model trajectory varies.

The discussion above is adapted from David Peterson’s thesis, which has a more complete mathematical treatment. The approach is laid out in Fred Schweppe’s book, Uncertain Dynamic Systems, which is unfortunately out of print and pricey. As a substitute, I like Stengel’s Optimal Control and Estimation.

An example of Kalman Filtering in everyday devices is GPS. A GPS unit is designed to estimate the state of a system (its location in space) using noisy measurements (satellite signals). As I understand it, GPS units maintain a simple model of the dynamics of motion: my expected position in the future equals my current perceived position, plus perceived velocity times time elapsed. It then corrects its predictions as measurements allow. With a good view of four satellites, it can move quickly toward the data. In a heavily-treed valley, it’s better to update the predicted state slowly, rather than giving jumpy predictions. I don’t know whether handheld GPS units implement it, but it’s possible to estimate the noise variances from the data and model, and adapt the filter corrections on the fly as conditions change.

Continue reading “Sea Level Rise Models – V”

Sea Level Rise Models – IV

So far, I’ve established that the qualitative results of Rahmstorf (R) and Grinsted (G) can be reproduced. Exact replication has been elusive, but the list of loose ends (unresolved differences in data and so forth) is long enough that I’m not concerned that R and G made fatal errors. However, I haven’t made much progress against the other items on my original list of questions:

  • Is the Grinsted et al. argument from first principles, that the current sea level response is dominated by short time constants, reasonable?
  • Is Rahmstorf right to assert that Grinsted et al.’s determination of the sea level rise time constant is shaky?
  • What happens if you impose the long-horizon paleo constraint to equilibrium sea level rise in Rahmstorf’s RC figure on the Grinsted et al. model?

At this point I’ll reveal my working hypotheses (untested so far):

  • I agree with G that there are good reasons to think that the sea level response occurs over multiple time scales, and therefore that one could make a good argument for a substantial short-time-constant component in the current transient.
  • I agree with R that the estimation of long time constants from comparatively short data series is almost certainly shaky.
  • I suspect that R’s paleo constraint could be imposed without a significant degradation of the model fit (an apparent contradiction of G’s results).
  • In the end, I doubt the data will resolve the argument, and we’ll be left with the conclusion that R and G agree on: that the IPCC WGI sea level rise projection is an underestimate.

Continue reading “Sea Level Rise Models – IV”