Dynamics of Fukushima Radiation

I like maps, but I love time series.

ScienceInsider has a nice roundup of radiation maps. I visited a few, and found current readings, but got curious about the dynamics, which were not evident.

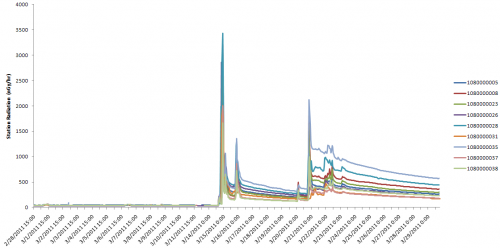
So, I grabbed Marian Steinbach’s scraped data and filtered it to a manageable size. Here’s what I got for the 9 radiation measurement stations in Ibaraki prefecture, where the Fukushima-Daiichi reactors are located:

IbarakiStationRadiation

The time series above (click it to enlarge) shows about 10 days of background readings, pre-quake, followed by some intense spikes of radiation, with periods of what looks like classic exponential decay behavior. “Intense” is relative, because fortunately those numbers are in nanoGrays, which are small.

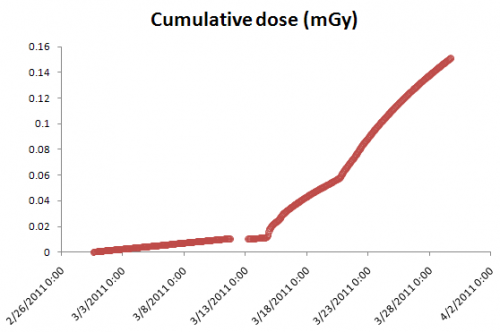
The cumulative dose at these sites is not yet high, but climbing:

IbarakiStationCumDose

The Fukushima contribution to cumulative dose is about .15 milliGrays – according to this chart, roughly a chest x-ray. Of course, if you extrapolate to long exposure from living there, that’s not good, but fortunately the decay process is also underway.

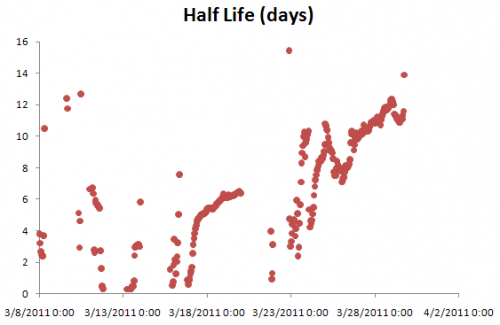
The interesting thing about the decay process is that it shows signs of having multiple time constants. That’s exactly what you’d expect, given that there’s a mix of isotopes with different half lives and a mix of processes (radioactive decay and physical transport of deposited material through the environment).

IbarakiRadHalfLife

The linear increases in the time constant during the long, smooth periods of decay presumably arise as fast processes play themselves out, leaving the longer time constants to dominate. For example, if you have a patch of soil with cesium and iodine in it, the iodine – half life 8 days – will be 95% gone in a little over a month, leaving the cesium – half life 30 years – to dominate the local radiation, with a vastly slower rate of decay.

Since the longer-lived isotopes will dominate the future around the plant, the key question then is what the environmental transport processes do with the stuff.

Update: Here’s the Steinbach data, aggregated to hourly (from 10min) frequency, with -888 and -888 entries removed, and trimmed in latitude range. Station_data Query hourly (.zip)

The Secret of the Universe in 6 sentences

Niall Palfreyman wrote this on the board to introduce a course in differential equations:

  1. The Secret of the Universe in 6 sentences
  2. Nature always integrates flows over time
  3. Flows always differentiate fields over space
  4. Structure determines behaviour
  5. Algebra is the study of structure
  6. Dynamics is the study of behaviour

I like it.

A little explanation is in order. I have my morning coffee in hand. It’s warmer than the room, so it’s cooling off. It’s heat winds up in the room. If I want to manage my coffee well, neither burning my tongue nor gagging down cold sludge, I need to be able to make some predictions about the future behavior of my cuppa joe. I won’t get far by postulating demons randomly stealing calorics from my cup, though that might provide a soothingly fatalistic outlook. I’m much better off if I understand how and why coffee cools.

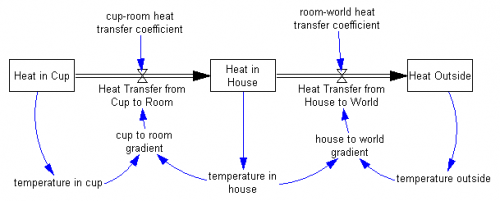
#2, the “nature integrates flows” part of the system looks like this:

coffeeCooling

Each box represents an accumulation of heat (that’s the integral). Each pipe represents a flow of heat from one place to another. The heat currently in the house is simply the net result of all the inflows from coffee cups, and all the losses to the outside world, over all time (of course, there are other flows to consider, like my computers warming the room, and losses to the snowy outside).

In the same way, the number of people in a room is the net accumulation of all the people who ever entered, less all those who ever left. A neat thing about this is that the current heat in the cup, or count of people in a room, is a complete description of the state of the system. You don’t need to know the detailed history of inflows and outflows, because you can simply take the temperature of the cup or count the people in the room to measure the accumulated effects of all the past events.

The next question is, why does the heat flow? That’s what #3 is about. Heat follows temperature gradients, as water flows downhill. Here’s a temperature field for a coffee cup:

Coffee_applepie_infrared

wikimedia commons

Heat will flow from the hot (red) cup into the cool (green) environment. The flow will be fastest where the gradient is steepest – i.e. where there’s the greatest temperature difference over a unit of space. That’s the “flows differentiate fields” part. Other properties also matter, like the thermal conductivity of the cup, air currents in the room, insulation in the wall, and heat capacity of coffee, and these can also be described as distributions over space or fields. That adds the blue to the model above:

CoffeeStructure

The blue arrows describe why the flows flow. These are algebraic expressions, like Heat Transfer from Cup to Room = Cup to Room Gradient/Cup-Room Heat Transfer Coefficient. They describe the structure – the “why” – of the system (#5).

The behavior of the system, i.e. how fast my coffee cools, is determined by the structure described above (#4). If you change the structure, by using an insulated mug to change the cup-room heat transfer coefficient for example, you change the behavior – the coffee cools more slowly.* The search for understanding about coffee cups, nuclear reactors, and climate is essentially an effort to identify structures that explain the dynamics or patterns of behavior that we observe in the world.

* Update: added a sentence for clarification, and corrected numbering.

Then & Now

Time has an interesting article on the climate policy positions of the GOP front runners. It’s amazing how far we’ve backed away from regulating greenhouse emissions:

Then Now
Pawlenty signed the Next Generation Energy Act of 2007 in Minnesota, which called for a plan to “recommend how the state could adopt a regulatory system that imposes a cap on the aggregate air pollutant emissions of a group of sources.” The current Tim Pawlenty line on carbon is that “cap and trade would be a disaster.”
Here he is in Iowa in 2007, voicing concern about man-made global warming while supporting more government subsidies for new energy sources, new efficiency standards, and a new global carbon treaty. Mitt Romney regularly attacks Barack Obama for pushing a cap and trade system through Congress.

And so on…

I can’t say that I’ve ever been much of a cap and trade fan, and I’d lay a little of the blame for our current sorry state at the door of cap and trade supporters who were willing to ignore what a bloated beast the bills had become. Not much, though. Most of the blame falls to the anti-science and let’s pretend externalities don’t exist crowds, who wouldn’t give a carbon tax the time of day either.

Vensim Compiled Simulation on the Mac

Speed freaks on Windows have long had access to 2 to 5x speed improvements from compiled simulations. Now that’s available on the Mac in the latest Vensim release.

Here’s how to do it, in three easy steps:

  • Get a Mac.
  • Get the gcc compiler. The only way I know to get this is to sign up as an Apple Developer (free) and download Xcode (I grabbed 3.2.2, which is much smaller than the 3.2.6+iOS SDK, but version shouldn’t matter much). There may be other ways, but this was easy.
  • Get Vensim DSS. After you install (checking the Install external function and compiled simulation support to: box), launch the program and go to Vensim DSS>Preferences…>Startup and set the Compiled simulation path to /Users/Shared/Vensim/comp. Now move to the advanced tab and set the compilation options to Query or Compile (you may want to skip this for normal Simulation, and just do it for Optimization and Sensitivity, where speed really counts).

OK, so I cheated a little on the step count, but it really is pretty easy. It’s worth it, too: I can run World3 1000 times in about 8 seconds interpreted; compiled gets that down to about 2.

Update: It turns out that an installer bug prevents 5.10d on the Mac from installing a needed file; you can get it here.

Vensim->Forio Simulate webinar tomorrow

Tomorrow I’ll be co-hosting a free webinar on development of web simulations using Vensim and Forio. Here’s the invite:

VENSIM/FORIO WEBINAR: How to create web simulations with Vensim using Forio Simulate

Vensim is ideally suited for creating sophisticated system dynamics simulation models, and Ventana UK’s Sable tool provides desktop deployment, but how can modelers make the insights from models accessible via the web?

Forio Simulate is a web hosting application that makes it easy for modelers to integrate Vensim models into end-user web applications. It allows modelers working in Vensim to publish VMF files to a server-based installation of Vensim hosted by Forio. Modelers can then use the interface design tool to create a web interface using a drag-and-drop application. No programming is necessary.

Date:
Wednesday, March 23rd @ 1 PM Eastern / 10 AM Pacific

Presenters:
Tom Fiddaman from Ventana Systems, Inc.
Billy Schoenberg from Forio Online Simulations

Cost:
Free

In this free webinar, Tom Fiddaman and Billy Schoenberg will show how Vensim modelers can combine interactive web applications with Vensim.

The webinar will cover:

1. Importing your Vensim model into Forio Simulate for use on the web.
2. Exploring your model with the Forio Simulate Model Explorer
3. Creating a web based user interface without writing code
4. Expanding past the drag and drop UI designer using Forio Simulate’s RESTful APIs

This webinar is suitable for all system dynamics modelers who would like to integrate their simulation into a web application.

There is no charge to attend the webinar. Reserve your spot now at https://www2.gotomeeting.com/register/474057034

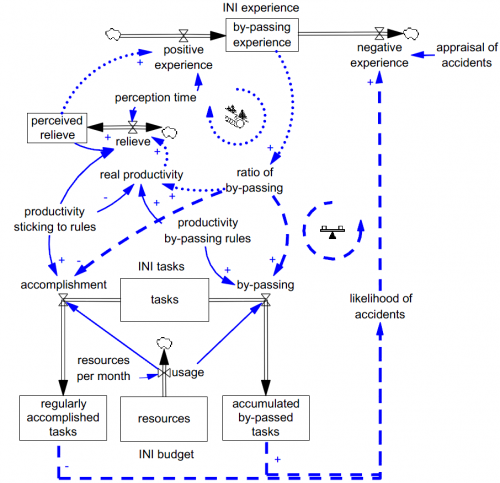
Nuclear systems thinking roundup

Mengers & Sirelli call for systems thinking in the nuclear industry in IEEE Xplore:

Need for Change Towards Systems Thinking in the U.S. Nuclear Industry

Until recently, nuclear has been largely considered as an established power source with no need for new developments in its generation and the management of its power plants. However, this idea is rapidly changing due to reasons discussed in this study. Many U.S. nuclear power plants are receiving life extensions decades beyond their originally planned lives, which requires the consideration of new risks and uncertainties. This research first investigates those potential risks and sheds light on how nuclear utilities perceive and plan for these risks. After that, it examines the need for systems thinking for extended operation of nuclear reactors in the U.S. Finally, it concludes that U.S. nuclear power plants are good examples of systems in need of change from a traditional managerial view to a systems approach.

In this talk from the MIT SDM conference, NRC commissioner George Apostolakis is already there:

Systems Issues in Nuclear Reactor Safety

This presentation will address the important role system modeling has played in meeting the Nuclear Regulatory Commission’s expectation that the risks from nuclear power plants should not be a significant addition to other societal risks. Nuclear power plants are designed to be fundamentally safe due to diverse and redundant barriers to prevent radiation exposure to the public and the environment. A summary of the evolution of probabilistic risk assessment of commercial nuclear power systems will be presented. The summary will begin with the landmark Reactor Safety Study performed in 1975 and continue up to the risk-informed Reactor Oversight Process. Topics will include risk-informed decision making, risk assessment limitations, the philosophy of defense-in-depth, importance measures, regulatory approaches to handling procedural and human errors, and the influence of safety culture as the next level of nuclear power safety performance improvement.

The presentation is interesting, in that it’s about 20% engineering and 80% human factors. Figuring out how people interact with a really complicated control system is a big challenge.

This thesis looks like an example of what Apostolakis is talking about:

Perfect plant operation with high safety and economic performance is based on both good physical design and successful organization. However, in comparison with the affection that has been paid to technology research, the effort that has been exerted to enhance NPP management and organization, namely human performance, seems pale and insufficient. There is a need to identify and assess aspects of human performance that are predictive of plant safety and performance and to develop models and measures of these performance aspects that can be used for operation policy evaluation, problem diagnosis, and risk-informed regulation. The challenge of this research is that: an NPP is a system that is comprised of human and physics subsystems. Every human department includes different functional workers, supervisors, and managers; while every physical component can be in normal status, failure status, or a being-repaired status. Thus, an NPP’s situation can be expressed as a time-dependent function of the interactions among a large number of system elements. The interactions between these components are often non-linear and coupled, sometime there are direct or indirect, negative or positive feedbacks, and hence a small interference input either can be suppressed or can be amplified and may result in a severe accident finally. This research expanded ORSIM (Nuclear Power Plant Operations and Risk Simulator) model, which is a quantitative computer model built by system dynamics methodology, on human reliability aspect and used it to predict the dynamic behavior of NPP human performance, analyze the contribution of a single operation activity to the plant performance under different circumstances, diagnose and prevent fault triggers from the operational point of view, and identify good experience and policies in the operation of NPPs.

The cool thing about this, from my perspective, is that it’s a blend of plant control with classic SD maintenance project management. It looks at the plant as a bunch of backlogs to be managed, and defines instability as a circumstance in which the rate of creation of new work exceeds the capacity to perform tasks. This is made operational through explicit work and personnel stocks, right down to the matter of who’s in charge of the control room. Advisor Michael Golay has written previously about SD in the nuclear industry.

Others in the SD community have looked at some of the “outer loops” operating around the plant, using group model building. Not surprisingly, this yields multiple perspectives and some counterintuitive insights – for example:

Regulatory oversight was initially and logically believed by the group to be independent of the organization and its activities. It was therefore identified as a policy variable.

However in constructing the very first model at the workshop it became apparent that for the event and system under investigation the degree of oversight was influenced by the number of event reports (notifications to the regulator of abnormal occurrences or substandard conditions) the organization was producing. …

The top loop demonstrates the reinforcing effect of a good safety culture, as it encourages compliance, decreases the normalisation of unauthorised changes, therefore increasing vigilance for any outlining unauthorised deviations from approved actions and behaviours, strengthening the safety culture. Or if the opposite is the case an erosion of the safety culture results in unauthorised changes becoming accepted as the norm, this normalisation disguises the inherent danger in deviating from the approved process. Vigilance to these unauthorised deviations and the associated potential risks decreases, reinforcing the decline of the safety culture by reducing the means by which it is thought to increase. This is however balanced by the paradoxical notion set up by the feedback loop involving oversight. As safety improves, the number of reportable events, and therefore reported events can decrease. The paradoxical behaviour is induced if the regulator perceives this lack of event reports as an indication that the system is safe, and reduces the degree of oversight it provides.

Tsuchiya et al. reinforce the idea that change management can be part of the problem as well as part of the solution,

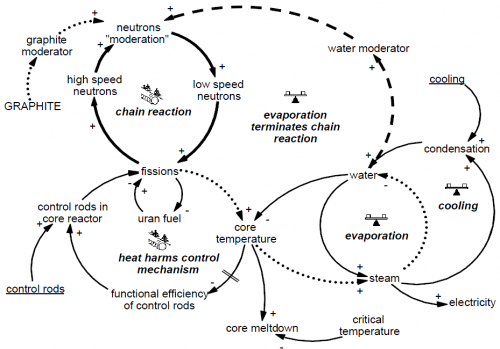
Markus Salge provides a nice retrospective on the Chernobyl accident, best summarized in pictures:

Salge Chernobyl

Key feedback structure of a graphite-moderated reactor like Chernobyl

Salge Flirting With Disaster

“Flirting with Disaster” dynamics

Others are looking at the nuclear fuel cycle and the role of nuclear power in energy systems.

How to be confused about nuclear safety

There’s been a long running debate about nuclear safety, which boils down to, what’s the probability of significant radiation exposure? That in turn has much to do with the probability of core meltdowns and other consequential events that could release radioactive material.

I asked my kids about an analogy to the problem: determining whether a die was fair. They concluded that it ought to be possible to simply roll the die enough times to observe whether the outcome was fair. Then I asked them how that would work for rare events – a thousand-sided die, for example. No one wanted to roll the dice that much, but they quickly hit on the alternative: use a computer. But then, they wondered, how do you know if the computer model is any good?

Those are basically the choices for nuclear safety estimation: observe real plants (slow, expensive), or use models of plants.

If you go the model route, you introduce an additional layer of uncertainty, because you have to validate the model, which in itself is difficult. It’s easy to misjudge reactor safety by doing five things:

  • Ignore the dynamics of the problem. For example, use a statistical model that doesn’t capture feedback. Presumably there have been a number of reinforcing feedbacks operating at the Fukushima site, causing spillovers from one system to another, or one plant to another:
    • Collateral damage (catastrophic failure of part A damages part B)
    • Contamination (radiation spewed from one reactor makes it unsafe to work on others)
    • Exhaustion of common resources (operators, boron)
  • Ignore the covariance matrix. This can arise in part from ignoring the dynamics above. But there are other possibilities as well: common design elements, or colocation of reactors, that render failure events non-independent.
  • Model an idealized design, not a real plant: ignore components that don’t perform to spec, nonlinearities in responses to extreme conditions, and operator error.
  • Draw a narrow boundary around the problem. Over the last week, many commentators have noted that reactor containment structures are very robust, and explicitly designed to prevent a major radiation release from a worst-case core meltdown. However, that ignores spent fuel stored outside of containment, which is apparently a big part of the Fukushima hazard now.
  • Ignore the passage of time. This can both help and hurt: newer reactor designs should benefit from learning about problems with older ones; newer designs might introduce new problems; life extension of old reactors introduces its own set of engineering issues (like neutron embrittlement of materials).
  • Ignore the unknown unknowns (easy to say, hard to avoid).

I haven’t read much of the safety literature, so I can’t say to what extent the above issues apply to existing risk analyses based on statistical models or detailed plant simulation codes. However, I do see a bit of a disconnect between actual performance and risk numbers that are often bandied about from such studies: the canonical risk of 1 meltdown per 10,000 reactor years, and other even smaller probabilities on the order of 1 per 100,000 or 1,000,000 reactor years.

I built myself a little model to assess the data, using WNA data to estimate reactor-years of operation and a wiki list of accidents. One could argue at length which accidents should be included. Only light water reactors? Only modern designs? I tend to favor a liberal policy for including accidents. As soon as you start coming up with excuses to exclude things, you’re headed toward an idealized world view, where operators are always faithful, plants are always shiny and new, or at least retired on schedule, etc. Still, I was a bit conservative: I counted 7 partial or total meltdown accidents in commercial or at least quasi-commercial reactors, including Santa Susana, Fermi, TMI, Chernobyl, and Fukushima (I think I missed Chapelcross). Then I looked at maximum likelihood estimates of meltdown frequency over various intervals. Using all the data, assuming Poisson arrivals of meltdowns, you get .6 failures per thousand reactor-years (95% confidence interval .3 to 1). That’s up from .4 [.1,.8] before Fukushima. Even if you exclude the early incidents and Fukushima, you’re looking at .2 [.04,.6] meltdowns per thousand reactor years – twice the 1-per-10,000 target. For the different subsets of the data, the estimates translate to an expected meltdown frequency of about once to thrice per decade, assuming continuing operations of about 450 reactors. That seems pretty bad.

In other words, the actual experience of rolling the dice seems to be yielding a riskier outcome than risk models suggest. One could argue that most of the failing reactors were old, built long ago, or poorly designed. Maybe so, but will we ever have a fleet of young rectors, designed and operated by demigods? That’s not likely, but surely things will get somewhat better with the march of technology. So, the question is, how much better? Areva’s 10x improvement seems inadequate if it’s measured against the performance of existing plants, at least if we plan to grow the plant fleet by much more than a factor of 10 to replace fossil fuels. There are newer designs around, but they depart from the evolutionary path of light water reactors, which means that “past performance is no indication of future returns” applies – will greater passive safety outweigh the effects of jumping to a new, less mature safety learning curve?

It seems to me that we need models of plant safety that square with the actual operational history of plants, to reconcile projected risk with real-world risk experience. If engineers promote analysis that appears unjustifiably optimistic, the public will do what it always does: discount the results of formal models, in favor of mental models that may be informed by superstition and visions of mushroom clouds.

Nuclear safety follies

I find panic-fueled iodine marketing and disingenuous comparisons of Fukushima to Chernobyl deplorable.

iodineBut those are balanced by pronouncements like this:

Telephone briefing from Sir John Beddington, the UK’s chief scientific adviser, and Hilary Walker, deputy director for emergency preparedness at the Department of Health.“Unequivocally, Tokyo will not be affected by the radiation fallout of explosions that have occurred or may occur at the Fukushima nuclear power stations.”

Surely the prospect of large scale radiation release is very low, but it’s not approximately zero, which is my interpretation of “unequivocally not.”

On my list of the seven deadly sins of complex systems management, number four is,

Certainty. Planning for it leads to fragile strategies. If you can’t imagine a way you could be wrong, you’re probably a fanatic.

Nuclear engineers disagree, but some seem to have a near-fanatic faith in plant safety. Normal Accidents documents some bizarrely cheerful post-accident reflections on safety. I found another when reading up over the last few days:

again Continue reading “Nuclear safety follies”