Math >> Calculating

This TED talk by Conrad Wolfram, of Wolfram Research, will really resonate with anyone who follows system dynamics and learner-directed learning.

He asks, “what is math?” and decomposes it into four steps:

  1. Posing the right questions
  2. Translating the real world problem into a mathematical formulation
  3. Computation
  4. Map the mathematical answer back to the real world, and verify it

He argues that 80% of conventional education is expended on step 3, which is boring if you do it by itself. Instead, he says, we should use increasingly-ubiquitous computers for step 3, and focus on the fun parts – 1, 2 & 4.

This is basically a generalization of the modeling process and the SD approach to education. I do millions of calculations per day, but not more than a few by hand or mind. The real wrangling is with steps 1,2 & 4 – real world problems that Conrad describes as knotty and horrible, with hair all over them.

There's more than one way to aggregate cats

After getting past the provocative title, Robert Axtell’s presentation on the pitfalls of aggregation proved to be very interesting. The slides are posted here:

http://winforms.chapter.informs.org/presentation/Pathologies_of_System_Dynamics_Models-Axtell-20101021.pdf

A comment on my last post on this summed things up pretty well:

… the presentation really focused on the challenges that aggregation brings to the modeling disciplines. Axtell presents some interesting mathematical constructs that could and should form the basis for conversations, thinking, and research in the SD and other aggregate modeling arenas.

It’s worth a look.

Also, as I linked before, check out Hazhir Rahmandad’s work on agent vs. aggregate models of an infection process. His models and articles with John Sterman are here. His thesis is here.

Hazhir’s work explores two extremes – an aggregate model of infection (which is the analog of typical Bass diffusion models in marketing science) compared to agent based versions of the same process. The key difference is that the aggregate model assumes well-mixed victims, while the agent versions explicitly model contacts across various network topologies. The well-mixed assumption is often unrealistic, because it matters who is infected, not just how many. In the real world, the gain of an infection process can vary with the depth of penetration of the social network, and only the agent model can capture this in all circumstances.

However, in modeling there’s often a middle road: an aggregation approach that captures the essence of a granular process at a higher level. That’s fortunate, because otherwise we’d always be building model-maps as big as the territory. I just ran across an interesting example.

A new article in PLoS Computational Biology models obesity as a social process:

Many behavioral phenomena have been found to spread interpersonally through social networks, in a manner similar to infectious diseases. An important difference between social contagion and traditional infectious diseases, however, is that behavioral phenomena can be acquired by non-social mechanisms as well as through social transmission. We introduce a novel theoretical framework for studying these phenomena (the SISa model) by adapting a classic disease model to include the possibility for ‘automatic’ (or ‘spontaneous’) non-social infection. We provide an example of the use of this framework by examining the spread of obesity in the Framingham Heart Study Network. … We find that since the 1970s, the rate of recovery from obesity has remained relatively constant, while the rates of both spontaneous infection and transmission have steadily increased over time. This suggests that the obesity epidemic may be driven by increasing rates of becoming obese, both spontaneously and transmissively, rather than by decreasing rates of losing weight. A key feature of the SISa model is its ability to characterize the relative importance of social transmission by quantitatively comparing rates of spontaneous versus contagious infection. It provides a theoretical framework for studying the interpersonal spread of any state that may also arise spontaneously, such as emotions, behaviors, health states, ideas or diseases with reservoirs.

The very idea of modeling obesity as an infectious social process is interesting in itself. But from a technical standpoint, the interesting innovation is that they capture some of the flavor of a disaggregate representation of the population by introducing an approximation, Continue reading “There's more than one way to aggregate cats”

Positively pathological

When I see oscillatory behavior, I instinctively think “delayed negative feedback.” Normally, that’s a good guess, but not always. Sometimes it’s a limit cycle or chaos, involving nonlinearity and a blend of positive and negative feedback, but today it’s something simpler, yet weirder.

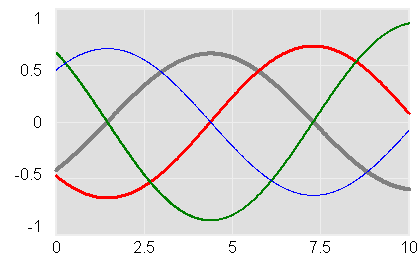
oscillation

Mohammad Mojtahedzadeh just sent me a classic model, replicated from Alan Graham’s thesis on Principles on the Relationship Between Structure and Behavior of Dynamic Systems. It’s a single positive feedback loop that doesn’t yield exponential growth, but oscillates.

What’s the trick? The loop is composed of pure integrations. The rate of change of each stock is the value of the previous stock in the loop multiplied by a constant. The pure integrations each add 90 degrees of phase lag (i.e. delay), so by the time a disturbance transits the loop, it arrives at its origin ready for a repeat performance.

The same thing occurs in a frictionless spring-mass system (think of an idealized hanging slinky), which oscillates because it is an undamped second order negative feedback loop. The states in the loop are position and momentum of the mass. Position is the integral of velocity, and momentum integrates the force that is a linear function of position. Each link is a pure integration (as long as there’s no friction, which adds a minor first-order negative loop).

So far so good, but the 4th order system is still a positive loop, so why doesn’t it grow? The trick is to initialize the system in such a way as to suppress the growth mode. To do that, we just have to initialize the system in a state that contains no component of the eigenvector corresponding with the growth mode, which is the positive real eigenvalue.

Continue reading “Positively pathological”

Market Growth

John Morecroft’s implementation of Jay Forrester’s Market Growth model, replicated by an MIT colleague whose name is lost to the mists of time, from:

Morecroft, J. D. W. (1983). System Dynamics: Portraying Bounded Rationality. Omega, 11(2), 131-142.

This paper examines the linkages between system dynamics and the Carnegie school in their treatment of human decision making. It is argued that the structure of system dynamics models implicitly assumes bounded rationality in decision making and that recognition of this assumption would aid system dynamicists in model construction and in communication to other social science disciplines. The paper begins by examining Simon’s “Principle of Bounded Rationality” which draws attention to the cognitive limitations on the information gathering and processing powers of human decision makers. Forrester’s “Market Growth Model” is used to illustrate the central theme that system dynamics models are portrayals of bounded rationality. Close examination of the model formulation reveals decision functions involving simple rules of thumb and limited information content. …

Continue reading “Market Growth”

Oscillation from a purely positive loop

Replicated by Mohammad Mojtahedzadeh from Alan Graham’s thesis, or created anew with the same inspiration. He created these models in the course of his thesis work on structural analysis through pathway participation matrices.

Alan Graham, 1977. Principles on the Relationship Between Structure and Behavior of Dynamic Systems. MIT Thesis. Page 76+

These models are pure positive feedback loops that don’t exhibit exponential growth (under the right initial conditions). See my blog post for a discussion of the details.

These are generic models, and therefore don’t have units. All should run with Vensim PLE, except the generic gain matrix version which uses arrays and therefore requires an advanced version or the Model Reader.

The original 4th order model, replicated from Alan’s thesis: PurePosOscill4.vpm – note that this includes a .cin file with an alternate stable initialization.

My slightly modified version, permitting initialization with different gains at each level: PurePosOscill4alt.vpm

Loops of different orders: 3.vpm 6.vpm 8.vpm 12.vpm (I haven’t spent much time with these. It appears that the high-order versions transition to growth rather quickly – my guess is that this is an artifact of numerical precision, i.e. any tiny imprecision in the initialization introduces a bit of the growth eigenvector, which quickly swamps the oscillatory signal. It would be interesting to try these in double precision Vensim to see if I’m right.)

Stable initializations: 2stab.vpm 12stab.vpm

A generic version, representing a system as a generic gain matrix, so you can use it to explore any linear unforced variant: Generic.vpm

A billion prices

Econbrowser has an interesting article on the Billion Prices Project, which looks for daily price movements on items across the web. This yields a price index that’s free of quality change assumptions, unlike hedonic CPI measures, but introduces some additional issues due to the lack of control over the changing portfolio of measured items.

A couple of years ago we built the analytics behind the RPX index of residential real estate prices, and grappled with many of the same problems. The competition was the CSI – the Case-Shiller indes, which uses the repeat-sales method. With that approach, every house serves as its own control, so changes in neighborhoods or other quality aspects wash out. However, the clever statistical control introduces some additional problems. First, it reduces the sample of viable data points, necessitating a 3x longer reporting lag. Second, the processing steps reduce transparency. Third, one step in particular involves downweighting of homes with (possibly implausibly) large price movements, which may have the side effect of reducing sensitivity to real extreme events. Fourth, users may want to see effects of a changing sales portfolio.

For the RPX, we chose instead a triple power law estimate, ignoring quality and mix issues entirely. The TPL is basically a robust measure of the central tendency of prices. It’s not too different from the median, except that it provides some diagnostics of data quality issues from the distribution of the tails. The payoff is a much more responsive index, which can be reported daily with a short lag. We spent a lot of time comparing the RPX to the CSI, and found that, while changes in quality and mix of sales could matter in principle, in practice the two approaches yield essentially the same answer, even over periods of years. My (biased)  inclination, therefore, is to prefer the RPX approach. Your mileage may vary.

One interesting learning for me from the RPX project was that traders don’t want models. We went in thinking that sophisticated dynamics coupled to data would be a winner. Maybe it is a winner, but people want their own sophisticated dynamics. They wanted us to provide only a datastream that maximized robustness and transparency, and minimized lag. Those are sensible design principles. But I have to wonder whether a little dynamic insight would have been useful as well since, after all, many data consumers evidently did not have an adequate model of the housing market.

Return of the Afghan spaghetti

The Afghanistan counterinsurgency causal loop diagram makes another appearance in this TED talk, in which Eric Berlow shows the hypnotized chickens the light:
https://www.ted.com/talks/eric_berlow_simplifying_complexity/transcript?language=en

I’m of two minds about this talk. I love that it embraces complexity rather than reacting with the knee-jerk “eeewww … gross” espoused by so many NYT commenters. The network view of the system highlights some interesting relationships, particularly when colored by the flavor of each sphere (military, ethnic, religious … ). Also, the generic categorization of variables that are actionable (unlike terrain) is useful. The insights from ecosystem simplification are potentially quite interesting, though we really only get a tantalizing hint at what might lie beneath.

However, I think the fundamental analogy between the system CLD and a food web or other network may only partially hold. That means that the insight, that influence typically lies within a few degrees of connectivity of the concept of interest, may not be generalizable. Generically, a dynamic model is a network of gains among state variables, and there are perhaps some reasons to think that, due to signal attenuation and so forth, that most influences are local. However, there are some important differences between the Afghan CLD and typical network diagrams.

In a food web, the nodes are all similar agents (species) which have a few generic relationships (eat or be eaten) with associated flows of information or resources. In a CLD, the nodes are a varied mix of agents, concepts, and resources. As a result, their interactions may differ wildly: the interaction between “relative popularity of insurgents” and “funding for insurgents” (from the diagram) is qualitatively different from that between “targeted strikes” and “perceived damages.” I suspect that in many models, the important behavior modes are driven by dynamics that span most of the diagram or model. That may be deliberate, because we’d like to construct models that describe a dynamic hypothesis, without a lot of extraneous material.

Probably the best way to confirm or deny my hypothesis would be to look at eigenvalue analysis of existing models. I don’t have time to dig into this, but Kampmann & Oliva’s analysis of Mass’ economic model is an interesting case study. In that model, the dominant structures responsible for oscillatory modes in the economy are a real mixed bag, with important contributions from both short and longish loops.

This bears further thought … please share yours, especially if you have a chance to look at Berlow’s PNAS article on food webs.

Cheese is Murder

Needlessly provocative title notwithstanding, the dairy industry has to be one of the most spectacular illustrations of the battle for control of system leverage points. In yesterday’s NYT:

Domino’s Pizza was hurting early last year. Domestic sales had fallen, and a survey of big pizza chain customers left the company tied for the worst tasting pies.

Then help arrived from an organization called Dairy Management. It teamed up with Domino’s to develop a new line of pizzas with 40 percent more cheese, and proceeded to devise and pay for a $12 million marketing campaign.

Consumers devoured the cheesier pizza, and sales soared by double digits. “This partnership is clearly working,” Brandon Solano, the Domino’s vice president for brand innovation, said in a statement to The New York Times.

But as healthy as this pizza has been for Domino’s, one slice contains as much as two-thirds of a day’s maximum recommended amount of saturated fat, which has been linked to heart disease and is high in calories.

And Dairy Management, which has made cheese its cause, is not a private business consultant. It is a marketing creation of the United States Department of Agriculture — the same agency at the center of a federal anti-obesity drive that discourages over-consumption of some of the very foods Dairy Management is vigorously promoting.

Urged on by government warnings about saturated fat, Americans have been moving toward low-fat milk for decades, leaving a surplus of whole milk and milk fat. Yet the government, through Dairy Management, is engaged in an effort to find ways to get dairy back into Americans’ diets, primarily through cheese.

Now recall Donella Meadows’ list of system leverage points:

Leverage points to intervene in a system (in increasing order of effectiveness)
12. Constants, parameters, numbers (such as subsidies, taxes, standards)
11. The size of buffers and other stabilizing stocks, relative to their flows
10. The structure of material stocks and flows (such as transport network, population age structures)
9. The length of delays, relative to the rate of system changes
8. The strength of negative feedback loops, relative to the effect they are trying to correct against
7. The gain around driving positive feedback loops
6. The structure of information flow (who does and does not have access to what kinds of information)
5. The rules of the system (such as incentives, punishment, constraints)
4. The power to add, change, evolve, or self-organize system structure
3. The goal of the system
2. The mindset or paradigm that the system – its goals, structure, rules, delays, parameters – arises out of
1. The power to transcend paradigms

The dairy industry has become a master at exercising these points, in particular using #4 and #5 to influence #6, resulting in interesting conflicts about #3.

Specifically, Dairy Management is funded by a “checkoff” (effectively a tax) on dairy output. That money basically goes to marketing of dairy products. A fair amount of that is done in stealth mode, through programs and information that appear to be generic nutrition advice, but happen to be funded by the NDC, CNFI, or other arms of Dairy Management. For example, there’s http://www.nutritionexplorations.org/ – for kids, they serve up pizza:

nutritionexplorations

That slice of “combination food” doesn’t look very nutritious to me, especially if it’s from the new Dominos line DM helped create. Notice that it’s cheese pizza, devoid of toppings. And what’s the gratuitous bowl of mac & cheese doing there? Elsewhere, their graphics reweight the food pyramid (already a grotesque product of lobbying science), to give all components equal visual weight. This systematic slanting of nutrition information is a nice example of my first deadly sin of complex system management.

A conspicuous target of dubious dairy information is school nutrition programs. Consider this, from GotMilk:

Flavored milk contributes only small amounts of added sugars to children ‘s diets. Sodas and fruit drinks are the number one source of added sugars in the diets of U.S. children and adolescents, while flavored milk provides only a small fraction (< 2%) of the total added sugars consumed.

It’s tough to fact-check this, because the citation doesn’t match the journal. But it seems likely that the statement that flavored milk provides only a small fraction of sugars is a red herring, i.e. that it arises because flavored milk is a small share of intake, rather than because the marginal contribution of sugar per unit flavored milk is small. Much of the rest of the information provided is a similar riot of conflated correlation and causation and dairy-sponsored research. I have to wonder whether innovations like flavored milk are helpful, because they displace sugary soda, or just one more trip around a big eroding goals loop that results in kids who won’t eat anything without sugar in it.

Elsewhere in the dairy system, there are price supports for producers at one end of the supply chain. At the consumer end, their are price ceilings, meant to preserve the affordability of dairy products. It’s unclear what this bizarre system of incentives at cross-purposes really delivers, other than confusion.

The fundamental problem, I think, is that there’s no transparency: no immediate feedback from eating patterns to health outcomes, and little visibility of the convoluted system of rules and subsidies. That leaves marketers and politicians free to push whatever they want.

So, how to close the loop? Unfortunately, many eaters appear to be uninterested in closing the loop themselves by actively seeking unbiased information, or even actively resist information contrary to their current patterns as the product of some kind of conspiracy. That leaves only natural selection to close the loop. Not wanting to experience that personally, I implemented my own negative feedback loop. I bought a cholesterol meter and modified my diet until I routinely tested OK. Sadly, that meant no more dairy.

Stimulus response

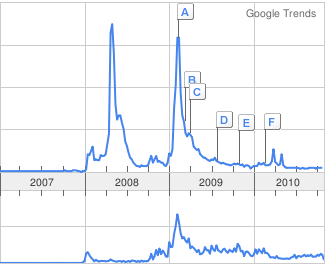
It looks like public interest in the stimulus has a two to three month time constant.

stimulusTrendThat’s interesting, because it takes much longer than three months for the stimulus to take effect. It also seems that news media (bottom trace) have slightly more durable interest than the public (searches, top trace), which is not what they’re normally accused of.