Danish text analysis

In response to a couple of requests for details, I’ve attached a spreadsheet containing my numbers from the last post on the Danish text: Danish text analysis v3 (updated).

Here it is in words, with a little rounding to simplify:

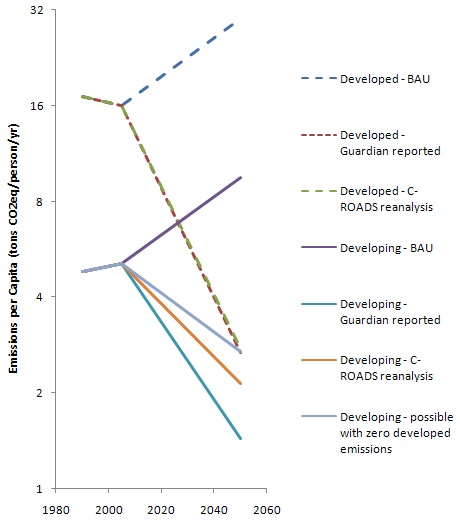
In 1990, global emissions were about 40 GtCO2eq/year, split equally between developed and developing countries. Due to population disparities, developed emissions per capita were 3.5 times bigger than developing at that point.

The Danish text sets a global target of 50% of 1990 emissions in 2050, which means that the global target is 20 GtCO2eq/year. It also sets a target of 80% (or more) below 1990 for the developed countries, which means their target is 4 GtCO2eq/year. That leaves 16 GtCO2eq/year for the developing world.

According to the “confidential analysis of the text by developing countries” cited in the Guardian, developed countries are emitting 2.7 tonsCO2eq/person/year in 2050, while developing countries emit about half as much: 1.4 tonsCO2eq/person/year. For the developed countries, that’s in line with what I calculate using C-ROADS data and projections. For the developing countries, to get 16 gigatons per year emissions at 1.4 tons per cap, you need 11 billion people emitting. That’s an addition of 6 billion people between 2005 and 2050, implying a growth rate above recent history and way above UN projections.

If you redo the analysis with a more plausible population forecast, per capita emissions convergence is nearly achieved, with developing country emissions per capita within about 25% of developed.

Danish text chart

Note log scale to emphasize proportional differences.

Biofuel Indirection

A new paper in Science on biofuel indirect effects indicates significant emissions, and has an interesting perspective on how to treat them:

The CI of fuel was also calculated across three time periods [] so as to compare with displaced fossil energy in a LCFS and to identify the GHG allowances that would be required for biofuels in a cap-and-trade program. Previous CI estimates for California gasoline [] suggest that values less than ~96 g CO2eq MJ–1 indicate that blending cellulosic biofuels will help lower the carbon intensity of California fuel and therefore contribute to achieving the LCFS. Entries that are higher than 96 g CO2eq MJ–1 would raise the average California fuel carbon intensity and thus be at odds with the LCFS. Therefore, the CI values for case 1 are only favorable for biofuels if the integration period extends into the second half of the century. For case 2, the CI values turn favorable for biofuels over an integration period somewhere between 2030 and 2050. In both cases, the CO2 flux has approached zero by the end of the century when little or no further land conversion is occurring and emissions from decomposition are approximately balancing carbon added to the soil from unharvested components of the vegetation (roots). Although the carbon accounting ends up as a nearly net neutral effect, N2O emissions continue. Annual estimates start high, are variable from year to year because they depend on climate, and generally decline over time.

Variable Case 1 Case 2

Time period 2000–2030 2000–2050 2000–2100 2000–2030 2000–2050 2000–2100
Direct land C 11 27 0 –52 –24 –7
Indirect land C 190 57 7 181 31 1
Fertilizer N2O 29 28 20 30 26 19
Total 229 112 26 158 32 13

One of the perplexing issues for policy analysts has been predicting the dynamics of the CI over different integration periods []. If one integrates over a long enough period, biofuels show a substantial greenhouse gas advantage, but over a short period they have a higher CI than fossil fuel []. Drawing on previous analyses [], we argue that a solution need not be complex and can avoid valuing climate damages by using the immediate (annual) emissions (direct and indirect) for the CI calculation. In other words, CI estimates should not integrate over multiple years but rather simply consider the fuel offset for the policy time period (normally a single year). This becomes evident in case 1. Despite the promise of eventual long-term economic benefits, a substantial penalty—in fact, possibly worse than with gasoline—in the first few decades may render the near-term cost of the carbon debt difficult to overcome in this case.

You can compare the carbon intensities in the table to the indirect emissions considered in California standards, at roughly 30 to 46 gCO2eq/MJ.

Originally published in Science Express on 22 October 2009
Science 4 December 2009:
Vol. 326. no. 5958, pp. 1397 – 1399
DOI: 10.1126/science.1180251

Reports

Indirect Emissions from Biofuels: How Important?

Jerry M. Melillo,1,* John M. Reilly,2 David W. Kicklighter,1 Angelo C. Gurgel,2,3 Timothy W. Cronin,1,2 Sergey Paltsev,2 Benjamin S. Felzer,1,4 Xiaodong Wang,2,5 Andrei P. Sokolov,2 C. Adam Schlosser2

A global biofuels program will lead to intense pressures on land supply and can increase greenhouse gas emissions from land-use changes. Using linked economic and terrestrial biogeochemistry models, we examined direct and indirect effects of possible land-use changes from an expanded global cellulosic bioenergy program on greenhouse gas emissions over the 21st century. Our model predicts that indirect land use will be responsible for substantially more carbon loss (up to twice as much) than direct land use; however, because of predicted increases in fertilizer use, nitrous oxide emissions will be more important than carbon losses themselves in terms of warming potential. A global greenhouse gas emissions policy that protects forests and encourages best practices for nitrogen fertilizer use can dramatically reduce emissions associated with biofuels production.

1 The Ecosystems Center, Marine Biological Laboratory (MBL), 7 MBL Street, Woods Hole, MA 02543, USA.
2 Joint Program on the Science and Policy of Global Change, Massachusetts Institute of Technology (MIT), 77 Massachusetts Avenue, MIT E19-411, Cambridge, MA 02139-4307, USA.
3 Department of Economics, University of São Paulo, Ribeirão Preto 4EES, Brazil.
4 Department of Earth and Environmental Sciences, Lehigh University, 31 Williams Drive, Bethlehem, PA 18015, USA.
5 School of Public Administration, Zhejiang University, Hangzhou 310000, Zhejiang Province, People’s Republic of China (PRC).

* To whom correspondence should be addressed. E-mail: jmelillo@mbl.edu

Expanded use of bioenergy causes land-use changes and increases in terrestrial carbon emissions (1, 2). The recognition of this has led to efforts to determine the credit toward meeting low carbon fuel standards (LCFS) for different forms of bioenergy with an accounting of direct land-use emissions as well as emissions from land use indirectly related to bioenergy production (3, 4). Indirect emissions occur when biofuels production on agricultural land displaces agricultural production and causes additional land-use change that leads to an increase in net greenhouse gas (GHG) emissions (2, 4). The control of GHGs through a cap-and-trade or tax policy, if extended to include emissions (or credits for uptake) from land-use change combined with monitoring of carbon stored in vegetation and soils and enforcement of such policies, would eliminate the need for such life-cycle accounting (5, 6). There are a variety of concerns (5) about the practicality of including land-use change emissions in a system designed to reduce emissions from fossil fuels, and that may explain why there are no concrete proposals in major countries to do so. In this situation, fossil energy control programs (LCFS or carbon taxes) must determine how to treat the direct and indirect GHG emissions associated with the carbon intensity of biofuels.

The methods to estimate indirect emissions remain controversial. Quantitative analyses to date have ignored these emissions (1), considered those associated with crop displacement from a limited area (2), confounded these emissions with direct or general land-use emissions (68), or developed estimates in a static framework of today’s economy (3). Missing in these analyses is how to address the full dynamic accounting of biofuel carbon intensity (CI), which is defined for energy as the GHG emissions per megajoule of energy produced (9), that is, the simultaneous consideration of the potential of net carbon uptake through enhanced management of poor or degraded lands, nitrous oxide (N2O) emissions that would accompany increased use of fertilizer, environmental effects on terrestrial carbon storage [such as climate change, enhanced carbon dioxide (CO2) concentrations, and ozone pollution], and consideration of the economics of land conversion. The estimation of emissions related to global land-use change, both those on land devoted to biofuel crops (direct emissions) and those indirect changes driven by increased demand for land for biofuel crops (indirect emissions), requires an approach to attribute effects to separate land uses.

We applied an existing global modeling system that integrates land-use change as driven by multiple demands for land and that includes dynamic greenhouse gas accounting (10, 11). Our modeling system, which consists of a computable general equilibrium (CGE) model of the world economy (10, 12) combined with a process-based terrestrial biogeochemistry model (13, 14), was used to generate global land-use scenarios and explore some of the environmental consequences of an expanded global cellulosic biofuels program over the 21st century. The biofuels scenarios we focus on are linked to a global climate policy to control GHG emissions from industrial and fossil fuel sources that would, absent feedbacks from land-use change, stabilize the atmosphere’s CO2 concentration at 550 parts per million by volume (ppmv) (15). The climate policy makes the use of fossil fuels more expensive, speeds up the introduction of biofuels, and ultimately increases the size of the biofuel industry, with additional effects on land use, land prices, and food and forestry production and prices (16).

We considered two cases in order to explore future land-use scenarios: Case 1 allows the conversion of natural areas to meet increased demand for land, as long as the conversion is profitable; case 2 is driven by more intense use of existing managed land. To identify the total effects of biofuels, each of the above cases is compared with a scenario in which expanded biofuel use does not occur (16). In the scenarios with increased biofuels production, the direct effects (such as changes in carbon storage and N2O emissions) are estimated only in areas devoted to biofuels. Indirect effects are defined as the differences between the total effects and the direct effects.

At the beginning of the 21st century, ~31.5% of the total land area (133 million km2) was in agriculture: 12.1% (16.1 million km2) in crops and 19.4% (25.8 million km2) in pasture (17). In both cases of increased biofuels use, land devoted to biofuels becomes greater than all area currently devoted to crops by the end of the 21st century, but in case 2 less forest land is converted (Fig. 1). Changes in net land fluxes are also associated with how land is allocated for biofuels production (Fig. 2). In case 1, there is a larger loss of carbon than in case 2, especially at mid-century. Indirect land use is responsible for substantially greater carbon losses than direct land use in both cases during the first half of the century. In both cases, there is carbon accumulation in the latter part of the century. The estimates include CO2 from burning and decay of vegetation and slower release of carbon as CO2 from disturbed soils. The estimates also take into account reduced carbon sequestration capacity of the cleared areas, including that which would have been stimulated by increased ambient CO2 levels. Smaller losses in the early years in case 2 are due to less deforestation and more use of pasture, shrubland, and savanna, which have lower carbon stocks than forests and, once under more intensive management, accumulate soil carbon. Much of the soil carbon accumulation is projected to occur in sub-Saharan Africa, an attractive area for growing biofuels in our economic analyses because the land is relatively inexpensive (10) and simple management interventions such as fertilizer additions can dramatically increase crop productivity (18).

Figure 1
View larger version (19K):
[in this window]
[in a new window]
Fig. 1. Projected changes in global land cover for land-use case 1 (A) and case 2 (B). In either case, biofuels supply most of the world’s liquid fuel needs by 2100. In case 1, 365 EJ of biofuel is produced in 2100, using 16.2% (21.6 million km2) of the total land area; natural forest area declines from 34.4 to 15.1 million km2 (56%), and pasture area declines from 25.8 to 22.1 million km2 (14%). In case 2, 323 EJ of biofuels are produced in 2100, using 20.6 million km2 of land; pasture areas decrease by 10.3 million km2 (40%), and forest area declines by 8.4 million km2 (24% of forest area). Simulations show that these major land-use changes will take place in the tropics and subtropics, especially in Africa and the Americas (fig. S2).

Figure 2
View larger version (14K):
[in this window]
[in a new window]
Fig. 2. Partitioning of direct (dark gray) and indirect effects (light gray) on projected cumulative land carbon flux since the year 2000 (black line) from cellulosic biofuel production for land-use case 1 (A) and case 2 (B). Positive values represent carbon sequestration, whereas negative values represent carbon emissions by land ecosystems. In case 1, the cumulative loss is 92 Pg CO2eq by 2100, with the maximum loss (164 Pg CO2eq) occurring in the 2050 to 2055 time frame, indirect losses of 110 Pg CO2eq, and direct losses of 54 Pg CO2eq. In the second half of the century, there is net accumulation of 72 Pg CO2eq mostly in the soil in response to the use of nitrogen fertilizers. In case 2, land areas are projected to have a net accumulation of 75 Pg CO2eq as a result of biofuel production, with maximum loss of 26 Pg CO2eq in the 2035 to 2040 time frame, followed by substantial accumulation.

Estimates of land devoted to biofuels in our two scenarios (15 to 16%) are well below the estimate of ~50% in a recent analysis (6) that does not control land-use emissions. The higher number is based on an analysis that has a lower concentration target (450 ppmv CO2), does not account for price-induced intensification of land use, and does not explicitly consider concurrent changes in other environmental factors. In analyses that include land-use emissions as part of the policy (68), less area is estimated to be devoted to biofuels (3 to 8%). The carbon losses associated with the combined direct and indirect biofuel emissions estimated for our case 1 are similar to a previous estimate (7), which shows larger losses of carbon per unit area converted to biofuels production. These larger losses per unit area result from a combination of factors, including a greater simulated response of plant productivity to changes in climate and atmospheric CO2 (15) and the lack of any negative effects on plant productivity of elevated tropospheric ozone (19, 20).

We also simulated the emissions of N2O from additional fertilizer that would be required to grow biofuel crops. Over the century, the N2O emissions become larger in CO2 equivalent (CO2eq) than carbon emissions from land use (Fig. 3). The net GHG effect of biofuels also changes over time; for case 1, the net GHG balance is –90 Pg CO2eq through 2050 (a negative sign indicates a source; a positive sign indicates a sink), whereas it is +579 through 2100. For case 2, the net GHG balance is +57 Pg CO2eq through 2050 and +679 through 2100. We estimate that by the year 2100, biofuels production accounts for about 60% of the total annual N2O emissions from fertilizer application in both cases, where the total for case 1 is 18.6 Tg N yr–1 and for case 2 is 16.1 Tg N yr–1. These total annual land-use N2O emissions are about 2.5 to 3.5 times higher than comparable estimates from an earlier study (8). Our larger estimates result from differences in the assumed proportion of nitrogen fertilizer lost as N2O (21) as well as differences in the amount of land devoted to food and biofuel production. Best practices for the use of nitrogen fertilizer, such as synchronizing fertilizer application with plant demand (22), can reduce N2O emissions associated with biofuels production.

Figure 3
View larger version (16K):
[in this window]
[in a new window]
Fig. 3. Partitioning of greenhouse gas balance since the year 2000 (black line) as influenced by cellulosic biofuel production for land-use case 1 (A) and case 2 (B) among fossil fuel abatement (yellow), net land carbon flux (blue), and fertilizer N2O emissions (red). Positive values are abatement benefits, and negative values are emissions. Net land carbon flux is the same as in Fig. 2. For case 1, N2O emissions over the century are 286 Pg CO2eq; for case 2, N2O emissions are 238 Pg CO2eq.

The CI of fuel was also calculated across three time periods (Table 1) so as to compare with displaced fossil energy in a LCFS and to identify the GHG allowances that would be required for biofuels in a cap-and-trade program. Previous CI estimates for California gasoline (3) suggest that values less than ~96 g CO2eq MJ–1 indicate that blending cellulosic biofuels will help lower the carbon intensity of California fuel and therefore contribute to achieving the LCFS. Entries that are higher than 96 g CO2eq MJ–1 would raise the average California fuel carbon intensity and thus be at odds with the LCFS. Therefore, the CI values for case 1 are only favorable for biofuels if the integration period extends into the second half of the century. For case 2, the CI values turn favorable for biofuels over an integration period somewhere between 2030 and 2050. In both cases, the CO2 flux has approached zero by the end of the century when little or no further land conversion is occurring and emissions from decomposition are approximately balancing carbon added to the soil from unharvested components of the vegetation (roots). Although the carbon accounting ends up as a nearly net neutral effect, N2O emissions continue. Annual estimates start high, are variable from year to year because they depend on climate, and generally decline over time.

Companies – also not on track yet

The Carbon Disclosure Project has a unique database of company GHG emissions, projections and plans. Many companies are doing a good job of disclosure; remarkably, the 1309 US firms reporting account for 31% of US emissions [*]. However, the overall emissions picture doesn’t look like a plan for deep cuts. CDP calls this the “Carbon Chasm.”

Based on current reduction targets, the world’s largest companies are on track to reach the scientifically-recommended level of greenhouse gas cuts by 2089 ’“ 39 years too late to avoid dangerous climate change, reveals a research report ’“ The Carbon Chasm ’“ released today by the Carbon Disclosure Project (CDP).

It shows that the Global 100 are currently on track for an annual reduction of just 1.9% per annum which is below the 3.9% needed in order to cut emissions in developed economies by 80% in 2050. According to the Intergovernmental Panel for Climate Change (IPCC), developed economies must reduce greenhouse gas emissions by 80-95% by 2050 in order to avoid dangerous climate change. [*]

Of course there are many pitfalls here: limited sampling, selection bias, greenwash, incomplete coverage of indirect emissions, … Still, I find it quite encouraging that companies plan net cuts at all, when many governments haven’t yet managed the same feat, so top-down policy isn’t in place to support their actions.

More climate models you can run

Following up on my earlier post, a few more on the menu:

SiMCaP – A simple tool for exploring emissions pathways, climate sensitivity, etc.

PRIMAP 2C Check Tool – A dirt-simple spreadsheet, exploiting the fact that cumulative emissions are a pretty good predictor of temperature outcomes along plausible emissions trajectories.

EdGCM – A full 3D model, for those who feel the need to get physical.

Last but not least, C-LEARN runs on the web. Desktop C-ROADS software is in the development pipeline.

Constraints vs. Complements

If you look at recent energy/climate regulatory plans in a lot of places, you’ll find an emerging model: an overall market-based umbrella (cap & trade) with a host of complementary measures targeted at particular sectors. The AB32 Scoping Plan, for example, has several options in each of eleven areas (green buildings, transport, …).

I think complementary policies have an important role: unlocking mitigation that’s bottled up by misperceptions, principal-agent problems, institutional constraints, and other barriers, as discussed yesterday. That’s hard work; it means changing the way institutions are regulated, or creating new institutions and information flows.

Unfortunately, too many of the so-called complementary policies take the easy way out. Instead of tackling the root causes of problems, they just mandate a solution – ban the bulb. There are some cases where standards make sense – where transaction costs of other approaches are high, for example – and they may even improve welfare. But for the most part such measures add constraints to a problem that’s already hard to solve. Sometimes those constraints aren’t even targeting the same problem: is our objective to minimize absolute emissions (cap & trade), minimize carbon intensity (LCFS), or maximize renewable content (RPS)?

You can’t improve the solution to an optimization problem by adding constraints. Even if you don’t view society as optimizing (probably a good idea), these constraints stand in the way of a good solution in several ways. Today’s sensible mandate is tomorrow’s straightjacket. Long permitting processes for land use and local air quality make it harder to adapt to a GHG price signal, for example.  To the extent that constraints can be thought of as property rights (as in the LCFS), they have high transaction costs or are illiquid. The proper level of the constraint is often subject to large uncertainty. The net result of pervasive constraints is likely to be nonuniform, and often unknown, GHG prices throughout the economy – contrary to the efficiency goal of emissions trading or taxation.

My preferred alternative: Start with pricing. Without a pervasive price on emissions, attempts to address barriers are really shooting in the dark – it’s difficult to identify the high-leverage micro measures in an environment where indirect effects and unintended consequences are large, absent a global signal. With a price on emissions, pain points will be more evident. Then they can be addressed with complementary policies, using the following sieve: for each area of concern, first identify the barrier that prevents the market from achieving a good outcome. Then fix the institution or decision process responsible for the barrier (utility regulation, for example), foster the creation of a new institution (to solve the landlord-tenant principal-agent problem, for example), or create a new information stream (labeling or metering, but less perverse than Energy Star). Only if that doesn’t work should we consider a mandate or auxiliary tradable permit system. Even then, we should also consider whether it’s better to simply leave the problem alone, and let the GHG price rise to harvest offsetting reductions elsewhere.

I think it’s reluctance to face transparent prices that drives politics to seek constraining solutions, which hide costs and appear to “stick it to the man.” Unfortunately, we are “the man.” Ultimately that problem rests with voters. Time for us to grow up.

MAC Attack

John Sterman just pointed me to David Levy’s newish blog, Climate Inc., which has some nice thoughts on Marginal Abatement Cost curves: How to get free mac lunches, and Whacking the MAC. They reminded me of my own thoughts on The elusive MAC curve. Climate Inc. also has a very interesting post on the psychology of US and European oil companies’ climate strategies, Back to Petroleum?.

The conclusion from How to get free mac lunches:

Of course, these solutions are not cost free ’“ they involve managerial time, some capital, and transaction costs. Some of the barriers are complex and would require large scale institutional restructuring, requiring government-business collaboration. But one person’s transaction costs are another’s business opportunity (the transaction costs of carbon markets will keep financial firms smiling). The key point here is that there are creative organizational and managerial approaches to unlock the doors to low-cost or even negative-cost carbon reductions. The carbon price is, by itself, an inefficient and ineffective tool ’“ the price would have to be at a politically infeasible level to achieve the desired goal. But we don’t have to rely just on the carbon price or on command and control; a multi-pronged attack is needed.

and Whacking the MAC:

Simply put, it will take a lot more than a market-based carbon price and a handout of free allowances to utilities to unlock the potential of conservation and energy efficiency investments.  It will take some serious innovation, a great deal of risk-taking and capital, and a coordinated effort by policy-makers, investors, and entrepreneurs to jump the significant institutional and legal hurdles currently in the way.  Until then, it will continue to be a real stretch to bend over the hurdles in an effort to reach all the elusive fruit lying on the ground.

Here’s my bottom line on MAC curves:

The existence of negative cost energy efficiency and mitigation options has been debated for decades. The arguments are more nuanced than they used to be, but this will not be settled any time soon. Still, there is an obvious way to proceed. First, put a price on carbon and other externalities. We’d make immediate progress on some fronts, where there are no barriers or misperceptions. In the stickier areas, there would be a financial incentive to solve the institutional, informational and transaction cost barriers that prevented implementation when energy was cheap and emissions were free. Service providers would emerge, and consumers and producers could gang up to push bureaucrats in the right direction. MAC curves would be a useful roadmap for action.

Strategic Excess? Breakthrough's Nightmare?

Since it was the Breakthrough analysis that got me started on this topic, I took a quick look at it again. Their basic objection is:

Therein lies a Catch-22 of ACES: if the annual use of up to 2 billion tons of offsets permitted by the bill is limited due to a restricted supply of affordable offsets, the government will pick up the slack by selling reserve allowances, and “refill” the reserve pool with international forestry offset allowances later. […]

The strategic allowance reserve would be established by taking a certain percentage of allowances originally reserved for the future — 1% of 2012-2019 allowances, 2% of 2020-2029 allowances, and 3% of 2030-2050 allowances — for a total size of 2.7 billion allowances. Every year throughout the cap and trade program, a certain portion of this reserve account would be available for purchase by polluters as a “safety valve” in case the price of emission allowances rises too high.

How much of the reserve account would be available for purchase, and for what price? The bill defines the reserve auction limit as 5 percent of total emissions allowances allocated for any given year between 2012-2016, and 10 percent thereafter, for a total of 12 billion cumulative allowances. For example, the bill specifies that 5.38 billion allowances are to be allocated in 2017 for “capped” sectors of the economy, which means 538 million reserve allowances could be auctioned in that year (10% of 5.38 billion). In other words, the emissions “cap” could be raised by 10% in any year after 2016.

First, it’s not clear to me that international offset supply for refilling the reserve is unlimited. Section 726 doesn’t say they’re unlimited, and a global limit of 1 to 1.5 GtCO2eq/yr applies elsewhere. Anyhow, given the current scale of the offset market, it’s likely that reserve refilling will be competing with market participants for a limited supply of allowances.

Second, even if offset refills do raise the de facto cap, that doesn’t raise global emissions, except to the extent that offsets aren’t real, additional and all that. With perfect offsets, global emissions would go down due to the 5:4 exchange ratio of offsets for allowances. If offsets are really rip-offsets, then W-M has bigger problems than the strategic reserve refill.

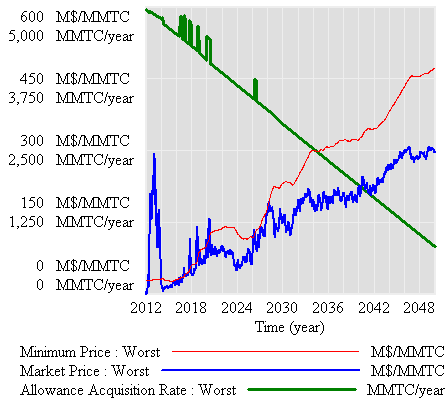
Third, and most importantly, the problem isn’t oversupply of allowances through the reserve. Instead, it’s hard to get allowances out of the reserve – they check in, and never check out. Simple math suggests, and simulations confirm, that it’s hard to generate a price trajectory yielding sustained auction release. Here’s a test with 3%/yr BAU emissions growth and 10% underlying demand volatility:

worstcase.png

Even with these implausibly high drivers, it’s hard to get a price trajectory that triggers a sustained auction flow, and total allowance supply (green) and emissions hardly differ from from the no-reserve case.

My preliminary simulation experiments suggest that it’s very unlikely that Breakthrough’s nightmare, a 10% cap violation, could really occur. To make that happen overall, you’d need sustained price increases of over 20% per year – i.e., an allowance price of $56,000/TonCO2eq in 2050. However, there are lesser nightmares hidden in the convoluted language – a messy program to administer, that in the end fails to mitigate volatility.

Strategic Excess? Insights

Model in hand, I tried some experiments (actually I built the model iteratively, while experimenting, but it’s hard to write that way, so I’m retracing my steps).

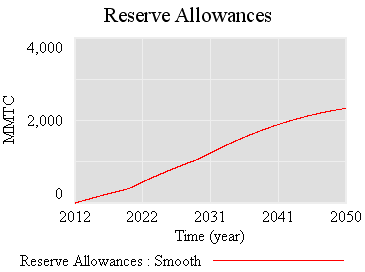
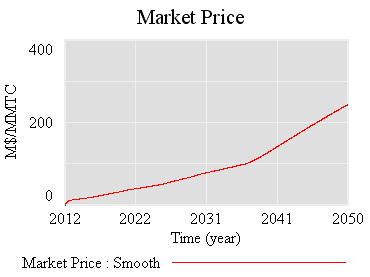
First, the “general equilbrium equivalent” version: no volatility, no SR marginal cost penalty for surprise, and firms see the policy coming. Result: smooth price escalation, and the strategic reserve is never triggered. Allowances just pile up in the reserve:

smoothallow.png

smoothprice.png

Since allowances accumulate, the de facto cap is 1-3% lower (by the share of allowances allocated to the reserve).

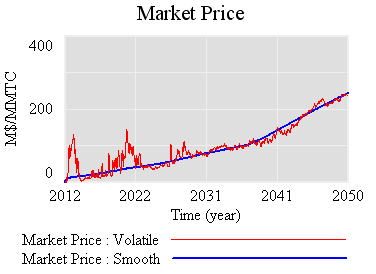
If there’s noise (SD=4.4%, comparable to petroleum demand), imperfect foresight, and short run adjustment costs, the market is more volatile:

volatileprice.png

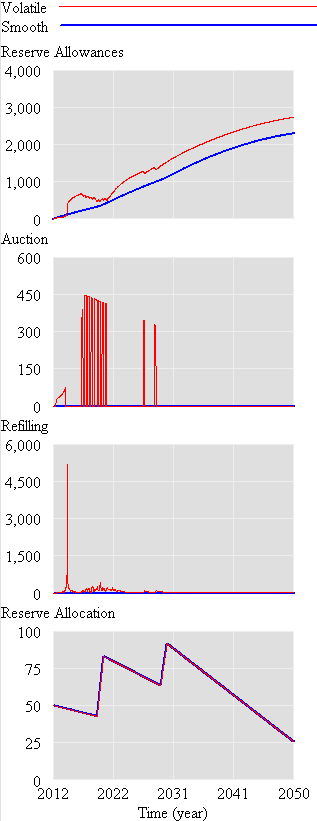
However, something strange happens. The stock of reserve allowances actually increases, even though some reserves are auctioned intermittently. That’s due to the refilling mechanism. An early auction, plus overreaction by firms, triggers a near-collapse in allowance prices (as happened in the ETS). Thus revenues generated in the reserve auction at high prices used to buy a lot of forestry offsets at very low prices:

volatileallow.png

Could this happen in reality? I’m not sure – it depends on timing, behavior, and details of the recycling implementation. I think it’s safe to say that the current design is not robust to such phenomena. Fortunately, the market impact over the long haul is not great, because the extra accumulated allowances don’t get used (they pile up, as in the smooth case).

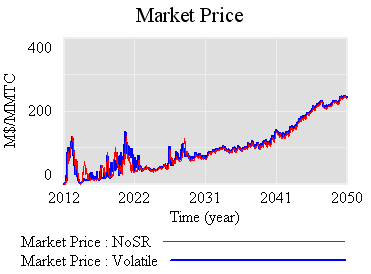
So, what is the reserve really accomplishing? Not much, it seems. Here’s the same trajectory, with volatility but no strategic reserve system:

noreserveprice.png

The mean price with the reserve (blue) is actually slightly higher, because the reserve mainly squirrels away allowances, without ever releasing them. Volatility is qualitatively the same, if not worse. That doesn’t seem like a good trade (unless you like the de facto emissions cut, which could be achieved more easily by lowering the cap and scrapping the reserve mechanism).

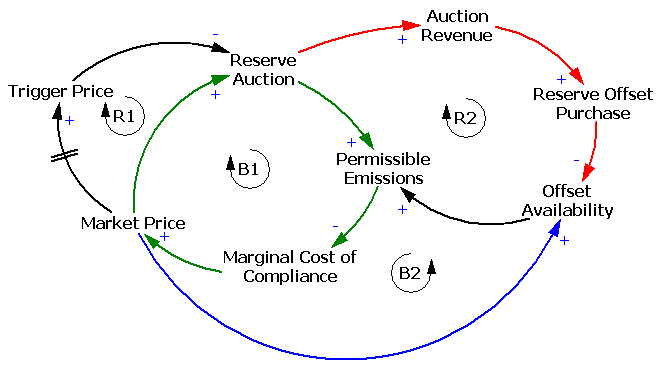
One reason the reserve fails to achieve its objectives is the recycling mechanism, which creates a perverse feedback loop that offsets the strategic reserve’s intended effect:

allowcld.png

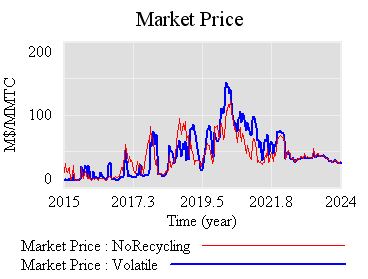
The intent of the reserve is to add a balancing feedback loop (B2, green) that stabilizes price. The problem is, the recycling mechanism (R2, red) consumes international forestry offsets that would otherwise be available for compliance, thus working against normal market operations (B2, blue). Thus the mechanism is only helpful to the extent that it exploits clever timing (doubtful), has access to offsets unavailable to the broad market (also doubtful), or doesn’t recycle revenue to refill the reserve. If you have a reserve, but don’t refill, you get some benefit:

norecycleprice.png

Still, the reserve mechanism seems like a lot of complexity yielding little benefit. At best, it can iron out some wrinkles, but it does nothing about strong, sustained price excursions (due to picking an infeasible target, for example). Perhaps there is some other design that could perform better, by releasing and refilling the reserve in a more balanced fashion. That ideal starts to sound like “buy low, sell high” – which is what speculators in the market are supposed to do. So, again, why bother?

I suspect that a more likely candidate for stabilization, robust to uncertainty, involves some possible violation of the absolute cap (gasp!). Realistically, if there are sustained price excursions, congress will violate it for us, so perhaps its better to recognize that up front and codify some orderly process for adaptation. At the least, I think congress should scrap the current reserve, and write the legislation in such a way as to kick the design problem to EPA, subject to a few general goals. That way, at least there’d be time to think about the design properly.

Strategic Excess? The Model

It’s hard to get an intuitive grasp on the strategic reserve design, so I built a model (which I’m not posting because it’s still rather crude, but will describe in some detail). First, I’ll point out that the model has to be behavioral, dynamic, and stochastic. The whole point of the strategic reserve is to iron out problems that surface due to surprises or the cumulative effects of agent misperceptions of the allowance market. You’re not going to get a lot of insight about this kind of situation from a CGE or intertemporal optimization model – which is troubling because all the W-M analysis I’ve seen uses equilibrium tools. That means that the strategic reserve design is either intuitive or based on some well-hidden analysis.

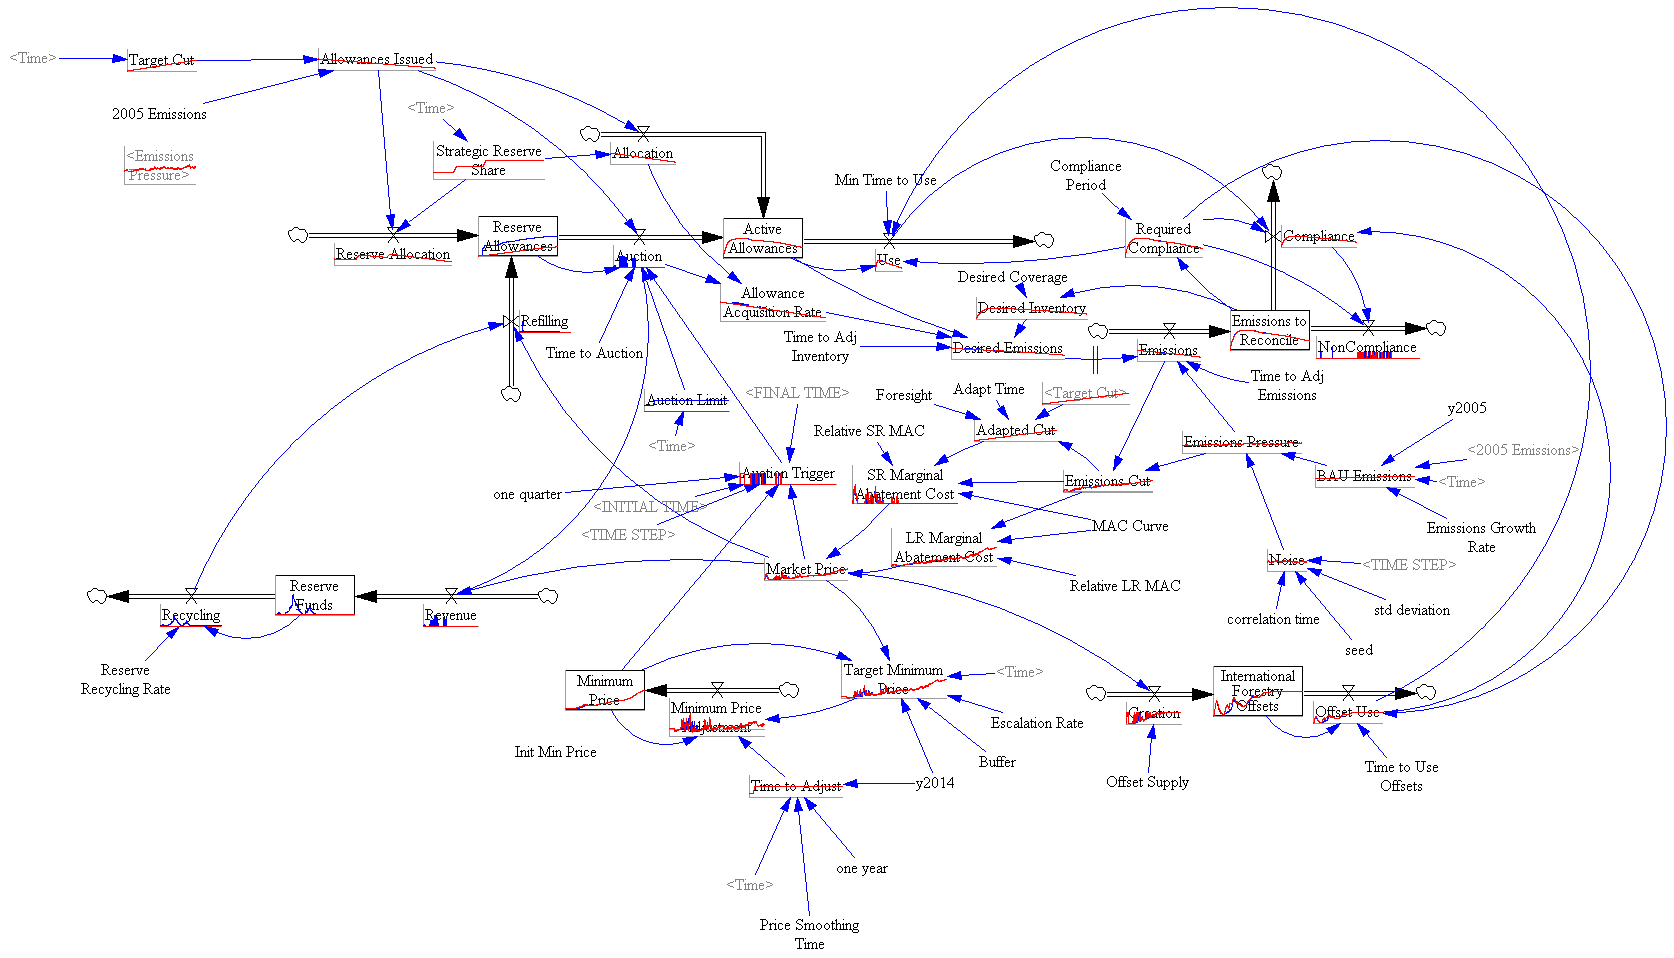
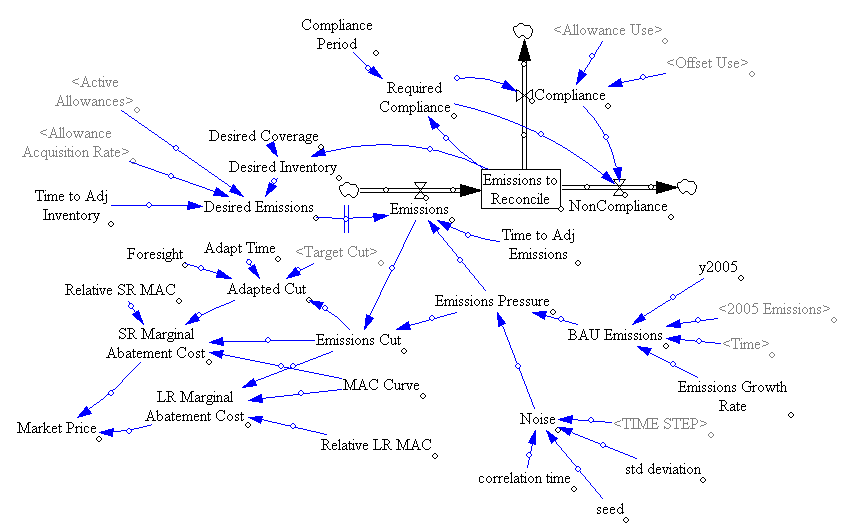
Here’s one version of my sketch of market operations (click to enlarge):
Strategic reserve structure

It’s already complicated, but actually less complicated than the mechanism described in W-M. For one thing, I’ve made some process continuous (compliance on a rolling basis, rather than at intervals) that sound like they will be discrete in the real implementation.

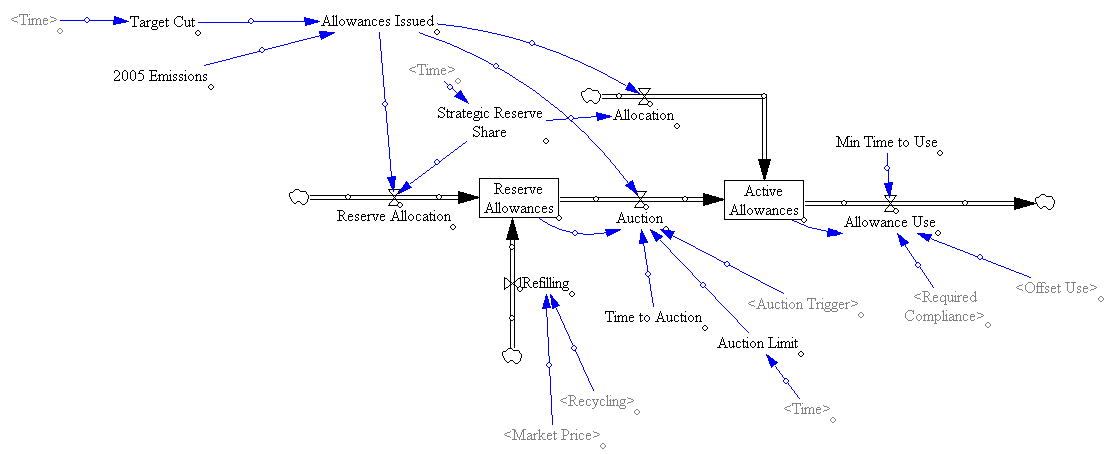
The strategic reserve is basically a pool of allowances withheld from the market, until need arises, at which point they are auctioned and become part of the active allowance pool, usable for compliance:

m-allowances.png

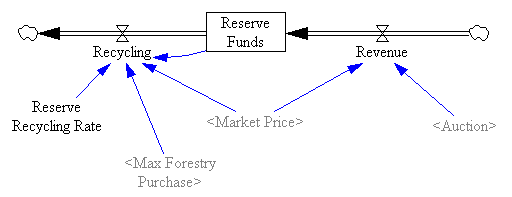
Reserves auctioned are – to some extent – replaced by recycling of the auction revenue:

m-funds.png

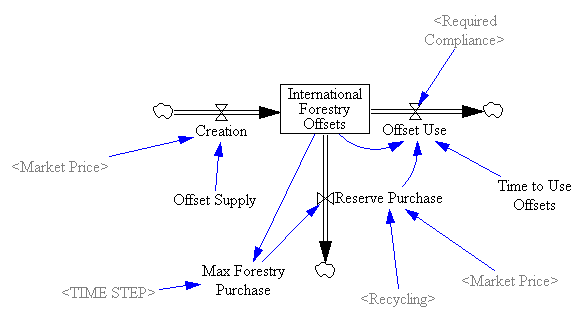
Refilling the strategic reserve consumes international forestry offsets, which may also be consumed by firms for compliance. Offsets are created by entrepreneurs, with supply dependent on market price.

m-offsets.png

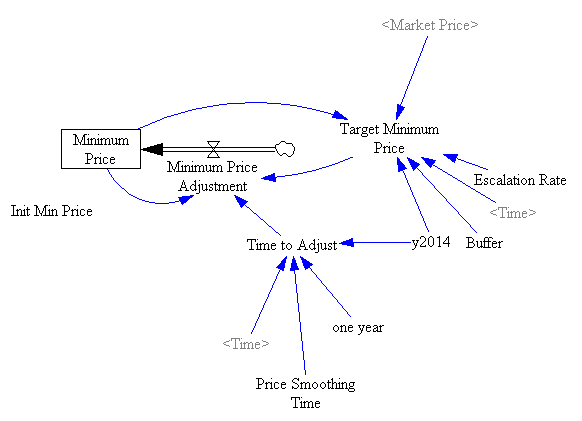
Auctions are triggered when market prices exceed a threshold, set according to smoothed actual prices:

m-trigger.png

(Actually I should have labeled this Maximum, not Minimum, since it’s a ceiling, not a floor.)

The compliance market is a bit complicated. Basically, there’s an aggregate firm that emits, and consumes offsets or allowances to cover its compliance obligation for those emissions (non-compliance is also possible, but doesn’t occur in practice; presumably W-M specifies a penalty). The firm plans its emissions to conform to the expected supply of allowances. The market price emerges from the marginal cost of compliance, which has long run and short run components. The LR component is based on eyeballing the MAC curve in the EPA W-M analysis. The SR component is arbitrarily 10x that, i.e. short term compliance surprises are 10x as costly (or the SR elasticity is 10x lower). Unconstrained firms would emit at a BAU level which is driven by a trend plus pink noise (the latter presumably originating from the business cyle, seasonality, etc.).

m-market.png

So far, so good. Next up: experiments.

Strategic Excess? Simple Math

Before digging into a model, I pondered the reserve mechanism a bit. The idea of the reserve is to provide cost containment. The legislation sets a price trigger at 60% above a 36-month moving average of allowance trade prices. When the current allowance price hits the trigger level, allowances held in the reserve are sold quarterly, subject to an upper limit of 5% to 20% of current-year allowance issuance.

To hit the +60% trigger point, the current price would have to rise above the average through some combination of volatility and an underlying trend. If there’s no volatility, the the trigger point permits a very strong trend. If the moving average were a simple exponential smooth, the basis for the trigger would follow the market price with a 36-month lag. That means the trigger would be hit when 60% = (growth rate)*(3 years), i.e. the market price would have to grow 20% per year to trigger an auction. In fact, the moving average is a simple average over a window, which follows an exponential input more closely, so the effective lag is only 1.5 years, and thus the trigger mechanism would permit 40%/year price increases. If you accept that the appropriate time trajectory of prices is more like an increase at the interest rate, it seems that the strategic reserve is fairly useless for suppressing any strong underlying exponential signal.

That leaves volatility. If we suppose that the underlying rate of increase of prices is 10%/year, then the standard deviation of the market price would have to be (60%-(10%/yr*1.5yr))/2 = 22.5% in order to trigger the reserve. That’s not out of line with the volatility of many commodities, but it seems like a heck of a lot of volatility to tolerate when there’s no reason to. Climate damages are almost invariant to whether a ton gets emitted today or next month, so any departure from a smooth price trajectory imposes needless costs (but perhaps worthwhile if cap & trade is really the only way to get a climate policy in place).

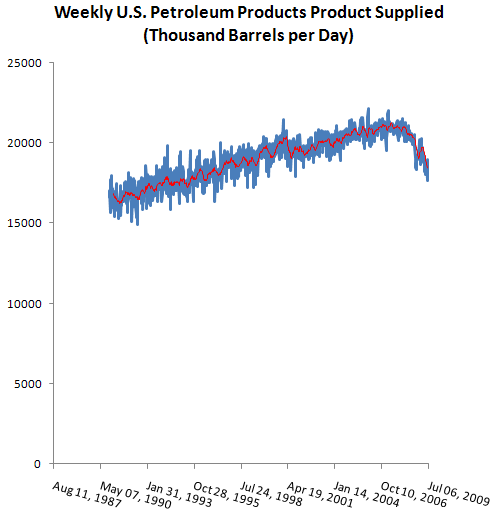
The volatility of allowance prices can be translated to a volatility of allowance demand by assuming an elasticity of allowance demand. If elasticity is -0.1 (comparable to short run gasoline estimates), then the underlying demand volatility would be 2.25%. The actual volatility of weekly petroleum consumption around a 1 quarter average is just about twice that:

Weekly petroleum products supplied

So, theoretically the reserve might shave some of these peaks, but one would hope that the carbon market wouldn’t be transmitting this kind of noise in the first place.