I linked some newish work on sea level by Aslak Grinsted et al. in my last post. There are some other new developments:
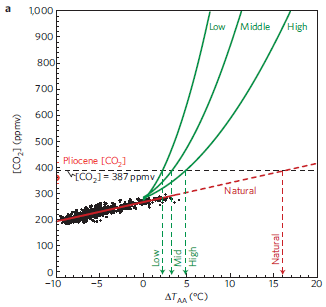
On the data front, Rohling et al. investigate sea level over the last half a million years and in the Pliocene (3+ million years ago). Here’s the relationship between CO2 and Antarctic temperatures:

Two caveats and one interesting observation here:
- The axes are flipped; if you think causally with CO2 on the x-axis, you need to mentally reflect this picture.
- TAA refers to Antarctic temperature, which is subject to polar amplification
- Notice that the empirical line (red) is much shallower than the relationship in model projections (green). Since the axes are flipped, that means that empirical Antarctic temperatures are much more sensitive to CO2 than projections, if it’s valid to extrapolate, and we wait long enough.
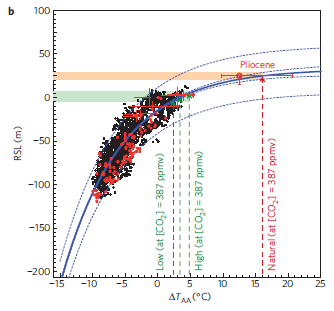
Looking at the temperature-sea level relationship, they find this:

The takeaway is:
Regardless of the uncertainties surrounding the use of any one of the specific scenarios in Fig. 2, it is clear that equilibrium sea level for the present-day TCO2U of 387 ppmv resides within a broad range between 0 and C25 (+/-5) m. The lower limit of that range derives from model projections3, whereas the upper limit derives from data describing the Earth system’s pre-anthropogenic behaviour over the past 0.5-3.5 Myr (this study).
In other words, if paleo analogies apply, sea level rise might not be fast, but it could get very big.
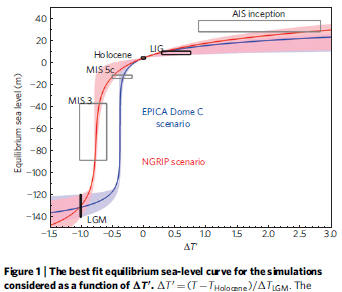
Siddall, Stocker and Clark develop a similar nonlinear relationship between temperature and sea level, and use that in yet another simple-model simulation experiment:

I haven’t had a chance to replicate this yet, but it looks like there are two innovations over the Grinsted approach. First, the equilibrium temperature-sea level relationship is nonlinear (s-shaped), as shown above. Second, the time constant of adjustment is asymmetric (potentially faster for ice sheet decay than for growth).
Siddall et al. find 21st century sea level rise for the A1FI scenario to be 0.82m – a little lower than the Rahmstorf (2007) and Grinsted et al. results I last considered, but still higher than AR4’s 0.59m.
Update: Whoops, the projections have just been retracted.
Vermeer and Rahmstorf revisit the 2007 Rahmstorf model, and extend it by including an instantaneous response term. The new model is:
dH/dt = a * (T – T0) + b * dT/dt
The first term, with parameter a, is the initial linear approximation of sea level’s exponential adjustment to a new equilibrium with a very long time constant. The second term is new, and represents fast processes. One interpretation of the “instantaneous” second term is as thermal expansion of the mixed ocean layer as it takes up heat.
V&R find that the slow/fast model fits data and GCM simulations better. But the fit is a bit weird: the b parameter winds up negative, though one can interpret that as the net effect of a positive value with a delay. The resulting sea level projections are generally higher than Siddall et al. – 1.43m for A1FI.
I’ll be taking a look at these new papers soon, with a few questions in mind:
- Are the Rohling and Siddall equilibrium relationships comparable? (This is basically just a matter of overlaying the figures and adjusting for polar amplification.)
- How well supported is the right tail of the nonlinear temp-sea level relationship in Siddall, and how does that matter to projections?
- Is there a more physical dual-time-constant version of Vermeer and Rahmstorf that solves the negative-b problem?
- Does the V&R dual model solve the problem of hindcasting inconsistency, identified by Grinsted?

I like Rohling and Siddalls work and their approach to use paleo data to constrain sea level response. Too bad that the Siddall paper had to be retracted as the projections no longer could be supported. I have also tried to re-plot Rohlings graph using global temperatures, in order to make a new version of ‘the Archer graph’:
http://www.glaciology.net/Home/Miscellaneous-Debris/relationshipbetweensealevelriseandglobaltemperature