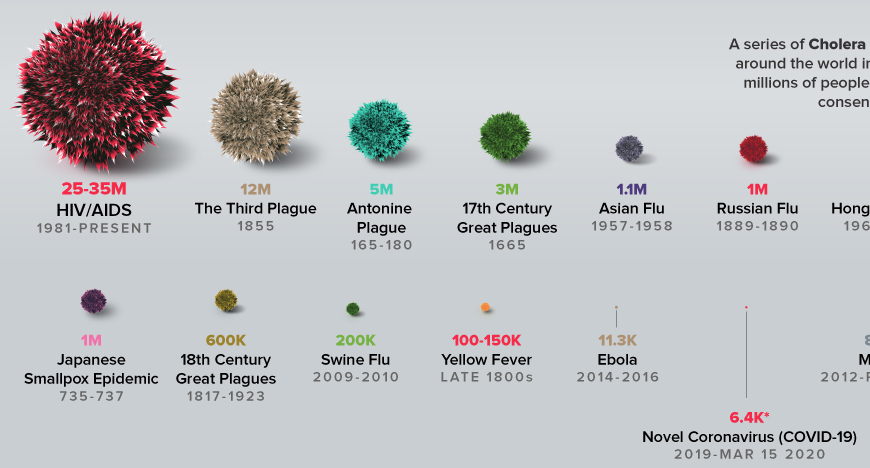
The ‘net is awash with questionable coronavirus memes. The most egregiously flawed offender I’ve seen is this one from visualcapitalist:

It’s interesting data, but the visualization really fails to put COVID19 in a proper perspective.
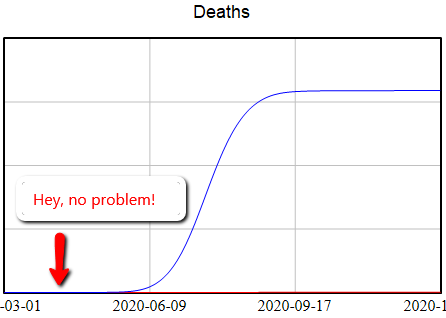
Exponential Growth
The biggest problem is obvious: the bottom of the curve is nothing like the peak for a quantity that grows exponentially.

Comparing the current death toll from COVID19, a few months old, to the final values from other epidemics over years to decades, is just spectacularly misleading. It beggars belief that anyone could produce such a comparison.
Perspective
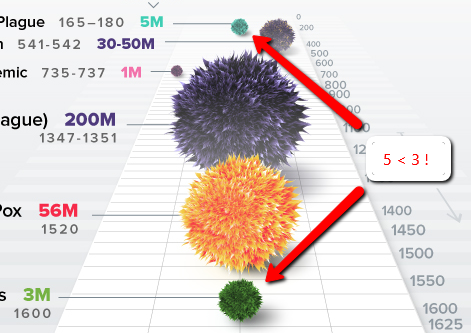
Speaking of perspective, charts like this are rarely a good idea. This one gives the impression that 5M < 3M:

Reliance on our brains to map 2D to 3D is even more problematic when you consider the next problem.
2D or 3D?
Measuring the fur-blob sizes shows that the mapping of the data to the blobs is two-dimensional: the area of the blob on the page represents the magnitude. But the blobs are clearly rendered in 3D. That means the visual impression of the relationship between the Black Death (200M) and Japanese Smallpox (1M) is off by a factor of 15. The distortion is even more spectacular for COVID19.
You either have to go all the way with 3D, in which case COVID19 looks bigger, even with the other distortions unaddressed, or you need to make a less-sexy but more-informative flat 2D chart.
Stocks vs. Flows
The fourth problem here is that the chart neglects time. The disruption from an epidemic is not simply a matter of its cumulative death toll. The time distribution also matters: a large impact concentrated in a brief time frame has much greater ripple effects, as we are now experiencing.

Hi, Tom.
You’ve probably seen this?
https://medium.com/@tomaspueyo/coronavirus-act-today-or-people-will-die-f4d3d9cd99ca
Yes – a good counterpoint to some of the junk.