Rental car stochastic dynamics

This is a little experimental model that I developed to investigate stochastic allocation of rental cars, in response to a Vensim forum question.

There’s a single fleet of rental cars distributed around 50 cities, connected by a random distance matrix (probably not physically realizable on a 2D manifold, but good enough for test purposes). In each city, customers arrive at random, rent a car if available, and return it locally or in another city. Along the way, the dawdle a bit, so returns are essentially a 2nd order delay of rentals: a combination of transit time and idle time.

The two interesting features here are:

  • Proper use of Poisson arrivals within each time step, so that car flows are dimensionally consistent and preserve the integer constraint (no fractional cars)
  • Use of Vensim’s ALLOC_P/MARKETP functions to constrain rentals when car availability is low. The usual approach, setting actual = MIN(desired, available/TIME STEP), doesn’t work because available is subscripted by 50 cities, while desired has 50 x 50 origin-destination pairs. Therefore the constrained allocation could result in fractional cars. The alternative approach is to set up a randomized first-come, first-served queue, so that any shortfall preserves the integer constraint.

The interesting experiment with this model is to lower the fleet until it becomes a constraint (at around 10,000 cars).

Documentation is sparse, but units balance.

Requires an advanced Vensim version (for arrays) or the free Model Reader.

carRental.vpm carRental.vmf

Update, with improved distribution choice and smaller array dimensions for convenience:

carRental2.mdl carRental2.vpm

Pink Noise

In a continuous time dynamic model, representing noise as a random draw at every time step can be problematic. As the time step is decreased, the high frequency power of the noise spectrum increases accordingly, potentially changing the behavior. In the limit of small time steps, the resulting white noise has infinite power, which is not physically realistic.

The solution is to use pink noise, which is essentially white noise filtered to cut off high frequencies. SD models from the bad old days typically employed a pink noise generating structure that employed uniformly distributed white noise, relying on the central limit theorem to yield a normally distributed output. Ed Anderson improved that structure to incorporate a normally distributed input, which works better, especially if the cutoff frequency is close to the inverse of the time step.

Two versions of the model are attached: one for advanced versions of Vensim, which permit implementation as a :MACRO:, for efficient reuse. The other works with Vensim PLE.

PinkNoise2010.mdl PinkNoise2010.vmf PinkNoise2010.vpm

PinkNoise2010-PLE.vmf PinkNoise2010-PLE.vpm

Contributed by Ed Anderson, updated by Tom Fiddaman

Notes (also in the model files):

Description: The pink noise molecule described generates a simple random series with autocorrelation. This is useful in representing time series, like rainfall from day to day, in which today’s value has some correlation with what happened yesterday. This particular formulation will also have properties such as standard deviation and mean that are insensitive both to the time step and the correlation (smoothing) time. Finally, the output as a whole and the difference in values between any two days is guaranteed to be Gaussian (normal) in distribution.

Behavior: Pink noise series will have both a historical and a random component during each period. The relative “trend-to-noise” ratio is controlled by the length of the correlation time. As the correlation time approaches zero, the pink noise output will become more independent of its historical value and more “noisy.” On the other hand, as the correlation time approaches infinity, the pink noise output will approximate a continuous time random walk or Brownian motion. Displayed above are two time series with correlation times of 1 and 8 months. While both series have approximately the same standard deviation, the 1-month correlation time series is less smooth from period to period than the 8-month series, which is characterized by “sustained” swings in a given direction. Note that this behavior will be independent of the time-step. The “pink” in pink noise refers to the power spectrum of the output. A time series in which each period’s observation is independent of the past is characterized by a flat or “white” power spectrum. Smoothing a time series attenuates the higher or “bluer” frequencies of the power spectrum, leaving the lower or “redder” frequencies relatively stronger in the output.

Caveats: This assumes the use of Euler integration with a time step of no more than 1/4 of the correlation time. Very long correlation times should be avoided also as the multiplication in the scaled white noise will become progressively less accurate.

Technical Notes: This particular form of pink noise is superior to that of Britting presented in Richardson and Pugh (1981) because the Gaussian (Normal) distribution of the output does not depend on the Central Limit Theorem. (Dynamo did not have a Gaussian random number generator and hence R&P had to invoke the CLM to get a normal distribution.) Rather, this molecule’s normal output is a result of the observations being a sum of Gaussian draws. Hence, the series over short intervals should better approximate normality than the macro in R&P.

MEAN: This is the desired mean for the pink noise.

STD DEVIATION: This is the desired standard deviation for the pink noise.

CORRELATION TIME: This is the smooth time for the noise, or for the more technically minded this is the inverse of the filter’s cut-off frequency in radians.

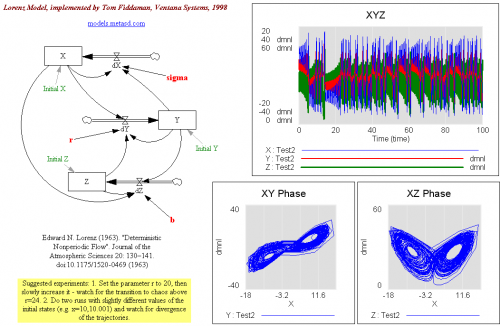
Lorenz Attractor

This is an implementation of Lorenz’ groundbreaking model that exhibits continuous-time chaos.

A google search turns up lots of good information on this model. For more advanced material, try google scholar.

I didn’t replicate this from Lorenz’ original 1963 article, Deterministic Nonperiodic Flow, but you can find a copy here.

Updated!

lorenz2.vmf

lorenz2.vpm

Logistic Chaos

This is an implementation of the logistic model – a very simple example of discrete time chaotic behavior. It’s sometimes used to illustrate chaotic dynamics of insect populations.

There’s a nice description here, and the other top links on google tend to be good.

Note that this version corrects an equation error in previous versions.

Logistic (Vensim .vpm)

Logistic (Vensim .vmf)

Heat Trap

Replicated by: Tom Fiddaman

Citation: Hatlebakk, Magnus, & Moxnes, Erling (1992). Misperceptions and Mismanagement of the Greenhouse Effect? The Simulation Model . Report # CMR-92-A30009, December). Christian Michelsen Research.

Units: no

Format: Vensim

This is a climate-economy model, of about the same scale and vintage as Nordhaus’ original DICE model. It’s more interesting in some respects, because it includes path-dependent reversible and irreversible emissions reductions. As I recall, the original also had some stochastic elements, not active here. This version has no units; hopefully I can get an improved version online at some point.

Heat trap (Vensim .vmf)

World3 Population Sector

Population sector extracted from the World3 model.

Documented in Dynamics of Growth in a Finite World, by Dennis L. Meadows, William W. Behrens III, Donella H. Meadows, Roger F. Naill, Jorgen Randers, and Erich K.O. Zahn. 1974 ISBN 0-9600294-4-3 . See also Limits to Growth, The 30-Year Update, by Dennis Meadows and Eric Tapley. ISBN 1-931498-85-7 .

See my article at The other bathtubs – population

World3-Population (Vensim .vpm)

World3-Population (Vensim .mdl)

World3-Population (Vensim .vmf)

Ultradian Oscillations of Insulin and Glucose

Citation: Jeppe Sturis, Kenneth S. Polonsky, Erik Mokilde, and Eve van Cauter. Computer Model for Mechanisms Underlying Ultradian Oscillations of Insulin and Glucose. Am. J. Physiol. 260 (Endocrinol. Metab. 23): E801-E809, 1991.

Source: Replicated by Hank Taylor

Units: No Yes!

Format: Vensim

Ultradian Oscillations of Insulin and Glucose (Vensim .vpm)

Update, 10/2017:

Refreshed, with units defined (mathematically the same as before): ultradia2.vpm ultradia2.mdl

Further refined, for initialization in equilibrium (insulin by analytic expression; glucose by parameter). Glucose infusion turned on by default. Graphs added.

ultradia-enhanced-3.mdl ultradia-enhanced-3.vpm

Sea Level Rise

Citations: Rahmstorf 2007, “A semi-empirical approach to projecting future sea level rise.” Science 315. Grinsted, Moore & Jevrejeva 2009. “Reconstructing sea level from paleo and projected temperatures 200 to 2100 AD.” Climate Dynamics [1]

Source: Replicated by Tom Fiddaman based on an earlier replication of Rahmstorf provided by John Sterman

Units balance: Yes

Format: Vensim; requires Model Reader or an advanced version

Notes: See discussion at metasd.

Files:

Grinsted_v3b‎ – first model; default calibration replicates Rahmstorf, and optimization is set up to adjust constant terms to fit Rahmstorf slope to data

Grinsted_v3c – second model; updated data and calibration, as in Part III

Grinsted_v3c-k2 – third model; set up for Kalman filtering, as in Part V