Constraints vs. Complements

If you look at recent energy/climate regulatory plans in a lot of places, you’ll find an emerging model: an overall market-based umbrella (cap & trade) with a host of complementary measures targeted at particular sectors. The AB32 Scoping Plan, for example, has several options in each of eleven areas (green buildings, transport, …).

I think complementary policies have an important role: unlocking mitigation that’s bottled up by misperceptions, principal-agent problems, institutional constraints, and other barriers, as discussed yesterday. That’s hard work; it means changing the way institutions are regulated, or creating new institutions and information flows.

Unfortunately, too many of the so-called complementary policies take the easy way out. Instead of tackling the root causes of problems, they just mandate a solution – ban the bulb. There are some cases where standards make sense – where transaction costs of other approaches are high, for example – and they may even improve welfare. But for the most part such measures add constraints to a problem that’s already hard to solve. Sometimes those constraints aren’t even targeting the same problem: is our objective to minimize absolute emissions (cap & trade), minimize carbon intensity (LCFS), or maximize renewable content (RPS)?

You can’t improve the solution to an optimization problem by adding constraints. Even if you don’t view society as optimizing (probably a good idea), these constraints stand in the way of a good solution in several ways. Today’s sensible mandate is tomorrow’s straightjacket. Long permitting processes for land use and local air quality make it harder to adapt to a GHG price signal, for example.  To the extent that constraints can be thought of as property rights (as in the LCFS), they have high transaction costs or are illiquid. The proper level of the constraint is often subject to large uncertainty. The net result of pervasive constraints is likely to be nonuniform, and often unknown, GHG prices throughout the economy – contrary to the efficiency goal of emissions trading or taxation.

My preferred alternative: Start with pricing. Without a pervasive price on emissions, attempts to address barriers are really shooting in the dark – it’s difficult to identify the high-leverage micro measures in an environment where indirect effects and unintended consequences are large, absent a global signal. With a price on emissions, pain points will be more evident. Then they can be addressed with complementary policies, using the following sieve: for each area of concern, first identify the barrier that prevents the market from achieving a good outcome. Then fix the institution or decision process responsible for the barrier (utility regulation, for example), foster the creation of a new institution (to solve the landlord-tenant principal-agent problem, for example), or create a new information stream (labeling or metering, but less perverse than Energy Star). Only if that doesn’t work should we consider a mandate or auxiliary tradable permit system. Even then, we should also consider whether it’s better to simply leave the problem alone, and let the GHG price rise to harvest offsetting reductions elsewhere.

I think it’s reluctance to face transparent prices that drives politics to seek constraining solutions, which hide costs and appear to “stick it to the man.” Unfortunately, we are “the man.” Ultimately that problem rests with voters. Time for us to grow up.

MAC Attack

John Sterman just pointed me to David Levy’s newish blog, Climate Inc., which has some nice thoughts on Marginal Abatement Cost curves: How to get free mac lunches, and Whacking the MAC. They reminded me of my own thoughts on The elusive MAC curve. Climate Inc. also has a very interesting post on the psychology of US and European oil companies’ climate strategies, Back to Petroleum?.

The conclusion from How to get free mac lunches:

Of course, these solutions are not cost free ’“ they involve managerial time, some capital, and transaction costs. Some of the barriers are complex and would require large scale institutional restructuring, requiring government-business collaboration. But one person’s transaction costs are another’s business opportunity (the transaction costs of carbon markets will keep financial firms smiling). The key point here is that there are creative organizational and managerial approaches to unlock the doors to low-cost or even negative-cost carbon reductions. The carbon price is, by itself, an inefficient and ineffective tool ’“ the price would have to be at a politically infeasible level to achieve the desired goal. But we don’t have to rely just on the carbon price or on command and control; a multi-pronged attack is needed.

and Whacking the MAC:

Simply put, it will take a lot more than a market-based carbon price and a handout of free allowances to utilities to unlock the potential of conservation and energy efficiency investments.  It will take some serious innovation, a great deal of risk-taking and capital, and a coordinated effort by policy-makers, investors, and entrepreneurs to jump the significant institutional and legal hurdles currently in the way.  Until then, it will continue to be a real stretch to bend over the hurdles in an effort to reach all the elusive fruit lying on the ground.

Here’s my bottom line on MAC curves:

The existence of negative cost energy efficiency and mitigation options has been debated for decades. The arguments are more nuanced than they used to be, but this will not be settled any time soon. Still, there is an obvious way to proceed. First, put a price on carbon and other externalities. We’d make immediate progress on some fronts, where there are no barriers or misperceptions. In the stickier areas, there would be a financial incentive to solve the institutional, informational and transaction cost barriers that prevented implementation when energy was cheap and emissions were free. Service providers would emerge, and consumers and producers could gang up to push bureaucrats in the right direction. MAC curves would be a useful roadmap for action.

Hottest Day Ever

A few weeks ago, Seattle racked up its hottest day ever, at 103 degrees F. I was there for the fun. Normally I argue that air conditioning in the Pacific Northwest is for wimps, but we weren’t too thrilled about experiencing the record heat in a hotel without functioning AC. The next day (still hot) I was at a hotel that did have AC (the Crowne Plaza), and found this amazing scene:

Crowne Plaza fire

AC on full blast … and people huddled around a gas fire in the lobby?!

Don’t even get me started on the ice machinein a 100 degree closet, with an electric fan venting its waste heat into the hall, only to be expelled to the great outdoors by the building AC…

Incidentally, while it’s been mercifully cool and wet here in Montana, satellite records indicate that July 19 was possibly the hottest day ever recorded worldwide.

Polar Bears & Principles

Amstrup et al. have just published a rebuttal of the Armstrong, Green & Soon critique of polar bear assessments. Polar bears aren’t my area, and I haven’t read the original, so I won’t comment on the ursine substance. However, Amstrup et al. reinforce many of my earlier objections to (mis)application of forecasting principles, so here are some excerpts:

The Principles of Forecasting and Their Use in Science

… AGS based their audit on the idea that comparison to their self-described principles of forecasting could produce a valid critique of scientific results. AGS (p. 383) claimed their principles ‘summarize all useful knowledge about forecasting.’ Anyone can claim to have a set of principles, and then criticize others for violating their principles. However, it takes more than a claim to create principles that are meaningful or useful. In concluding our rejoinder, we point out that the principles espoused by AGS are so deeply flawed that they provide no reliable basis for a rational critique or audit.

Failures of the Principles

Armstrong (2001) described 139 principles and the support for them. AGS (pp. 382’“383) claimed that these principles are evidence based and scientific. They fail, however, to be evidence based or scientific on three main grounds: They use relative terms as if they were absolute, they lack theoretical and empirical support, and they do not follow the logical structure that scientific criticisms require.

Using Relative Terms as Absolute

Many of the 139 principles describe properties that models, methods, and (or) data should include. For example, the principles state that data sources should be diverse, methods should be simple, approaches should be complex, representations should be realistic, data should be reliable, measurement error should be low, explanations should be clear, etc. … However, it is impossible to look at a model, a method, or a datum and decide whether its properties meet or violate the principles because the properties of these principles are inherently relative.

Consider diverse. AGS faulted H6 for allegedly failing to use diverse sources of data. However, H6 used at least six different sources of data (mark-recapture data, radio telemetry data, data from the United States and Canada, satellite data, and oceanographic data). Is this a diverse set of data? It is more diverse than it would have been if some of the data had not been used. It is less diverse than it would have been if some (hypothetical) additional source of data had been included. To criticize it as not being diverse, however, without providing some measure of comparison, is meaningless.

Consider simple. What is simple? Although it might be possible to decide which of two models is simpler (although even this might not be easy), it is impossible’”in principle’”to say whether any model considered in isolation is simple or not. For example, H6 included a deterministic time-invariant population model. Is this model simple? It is certainly simpler than the stationary, stochastic model, or the nonstationary stochastic model also included in H6. However, without a measure of comparison, it is impossible to say which, if any, are ‘simple.’ For AGS to criticize the report as failing to use simple models is meaningless.

A Lack of Theoretical and Empirical Support

If the principles of forecasting are to serve as a basis for auditing the conclusions of scientific studies, they must have strong theoretical and (or) empirical support. Otherwise, how do we know that these principles are necessary for successful forecasts? Closer examination shows that although Armstrong (2001, p. 680) refers to evidence and AGS (pp. 382’“383) call the principles evidence based, almost half (63 of 139) are supported only by received wisdom or common sense, with no additional empirical or theoretical support. …

Armstrong (2001, p. 680) defines received wisdom as when ‘the vast majority of experts agree,’ and common sense as when ‘it is difficult to imagine that things could be otherwise.’ In other words, nearly half of the principles are supported only by opinions, beliefs, and imagination about the way that forecasting should be done. This is not evidence based; therefore, it is inadequate as a basis for auditing scientific studies. … Even Armstrong’s (2001) own list includes at least three cases of principles that are supported by what he calls strong empirical evidence that ‘refutes received wisdom’’”that is, at least three of the principles contradict received wisdom. …

Forecasting Audits Are Not Scientific Criticism

The AGS audit failed to distinguish between scientific forecasts and nonscientific forecasts. Scientific forecasts, because of their theoretical basis and logical structure based upon the concept of hypothesis testing, are almost always projections. That is, they have the logical form of ‘if X happens, then Y will follow.’ The analyses in AMD and H6 take exactly this form. A scientific criticism of such a forecast must show that even if X holds, Y does not, or need not, follow.

In contrast, the AGS audit simply scored violations of self-defined principles without showing how the identified violation might affect the projected result. For example, the accusation that H6 violated the commandment to use simple models is not a scientific criticism, because it says nothing about the relative simplicity of the model with respect to other possible choices. It also says nothing about whether the supposedly nonsimple model in question is in error. A scientific critique on the grounds of simplicity would have to identify a complexity in the model, and show that the complexity cannot be defended scientifically, that the complexity undermines the credibility of the model, and that a simpler model can resolve the issue. AGS did none of these.

There’s some irony to all this. Armstrong & Green criticize climate predictions as mere opinions cast in overly-complex mathematical terms, lacking predictive skill. The instrument of their critique is a complex set of principles, mostly derived from opinions, with undemonstrated ability to predict the skill of models and forecasts.

Unprincipled Forecast Evaluation

I hadn’t noticed until I heard it here, but Armstrong & Green are back at it, with various claims that climate forecasts are worthless. In the Financial Post, they criticize the MIT Joint Program model,

… No more than 30% of forecasting principles were properly applied by the MIT modellers and 49 principles were violated. For an important problem such as this, we do not think it is defensible to violate a single principle.

As I wrote in some detail here, the Forecasting Principles are a useful seat-of-the-pants guide to good practices, but there’s no evidence that following them all is necessary or sufficient for a good outcome. Some are likely to be counterproductive in many situations, and key elements of good modeling practice are missing (for example, balancing units of measure).

It’s not clear to me that A&G really understand models and modeling. They seem to view everything through the lens of purely statistical methods like linear regression. Green recently wrote,

Another important principle is that the forecasting method should provide a realistic representation of the situation (Principle 7.2). An interesting statement in the MIT report that implies (as one would expect given the state of knowledge and omitted relationships) that the modelers have no idea to what extent their models provide a realistic representation of reality is as follows:

‘Changes in global surface average temperature result from a combination of emissions and climate parameters, and therefore two runs that look similar in terms of temperature may be very different in detail.’ (MIT Report p. 28)

While the modelers have sufficient latitude in their parameters to crudely reproduce a brief period of climate history, there is no reason to believe the models can provide useful forecasts.

What the MIT authors are saying, in essence, is that

T = f(E,P)

and that it is possible to achieve the same future temperature T with different combinations of emissions E and parameters P. Green seems to be taking a leap, to assume that historic T does not provide much constraint on P. First, that’s not necessarily true, given that historic E cannot be chosen freely. It could still be the case that the structure of f(E,P) means that historic T provides a weak constraint on P given E. But if that’s true (as it basically is), the problem is self-diagnosing: estimates of P will have broad confidence bounds, as will forecasts of T. Green completely ignores the MIT authors’ explicit characterization of this uncertainty. He also ignores the fact that the output of the model is not just T, and that we have priors for many elements of P (from more granular models or experiments, for example). Thus we have additional lines of evidence with which to constrain forecasts. Green also neglects to consider the implications of uncertainties in P that are jointly distributed in an offsetting manner (as is likely for climate sensitivity, ocean circulation, and aerosol forcing).

A&G provide no formal method to distinguish between situations in which models yield useful or spurious forecasts. In an earlier paper, they claimed rather broadly,

‘To our knowledge, there is no empirical evidence to suggest that presenting opinions in mathematical terms rather than in words will contribute to forecast accuracy.’ (page 1002)

This statement may be true in some settings, but obviously not in general. There are many situations in which mathematical models have good predictive power and outperform informal judgments by a wide margin.

A&G’s latest paper with Willie Soon, Validity of Climate Change Forecasting for Public Policy Decision Making, apparently forthcoming in IJF, is an attempt to make the distinction, i.e. to determine whether climate models have any utility as predictive tools. An excerpt from the abstract summarizes their argument:

Policymakers need to know whether prediction is possible and if so whether any proposed forecasting method will provide forecasts that are substantively more accurate than those from the relevant benchmark method. Inspection of global temperature data suggests that it is subject to irregular variations on all relevant time scales and that variations during the late 1900s were not unusual. In such a situation, a ‘no change’ extrapolation is an appropriate benchmark forecasting method. … The accuracy of forecasts from the benchmark is such that even perfect forecasts would be unlikely to help policymakers. … We nevertheless demonstrate the use of benchmarking with the example of the Intergovernmental Panel on Climate Change’s 1992 linear projection of long-term warming at a rate of 0.03°C-per-year. The small sample of errors from ex ante projections at 0.03°C-per-year for 1992 through 2008 was practically indistinguishable from the benchmark errors. … Again using the IPCC warming rate for our demonstration, we projected the rate successively over a period analogous to that envisaged in their scenario of exponential CO2 growth’”the years 1851 to 1975. The errors from the projections were more than seven times greater than the errors from the benchmark method. Relative errors were larger for longer forecast horizons. Our validation exercise illustrates the importance of determining whether it is possible to obtain forecasts that are more useful than those from a simple benchmark before making expensive policy decisions.

There are many things wrong here:

  1. Demonstrating that unforced variability (history) can be adequately forecasted by a naive benchmark has no bearing on whether future forced variability will continue to be well-represented, or whether models can predict future emergence of a signal from noise. AG&S’ procedure is like watching an airplane taxi, concluding that aerodynamics knowledge is of no advantage, and predicting that the plane will remain on the ground forever.
  2. Comparing a naive forecast for global mean temperature against models amounts to a rejection of a vast amount of information. What is the naive forecast for the joint behavior of temperature, preciptiation, lapse rates, sea level, and their spatial and seasonal patterns? These have been evaluated for models, but AG&S do not suggest benchmarks.
  3. A no-change forecast is not necessarily the best naive forecast for a series with unknown variability, if that series has some momentum or structure which can be exploited to do better. The particular no change forecast selected byAG&S is suboptimal, because it uses a single year as a forecast, unneccesarily projecting annual variation into the future. In general, a stronger naive forecast (e.g., a smoothed value of a few recent years) would strengthen AG&S’ case, so it’s unclear why they’ve chosen an excessively naive benchmark. Fortunately, their base year, 1991, was rather “average”.
  4. The first exhibit presented is the EPICA ice core temperature. Roughly 85% of the data shown has a time interval too long to show century-scale temperature variations, and none of it could be expected to fully reveal decadal-scale variations, so it’s mostly irrelevant with respect to the kind of forecasts they seek to evaluate.
  5. The mere fact that a series has unknown historic variability does not mean that it cannot be forecast [corrected 8/18/09]. The EPICA and Vostok CO2 records look qualitatively much like the temperature record, yet CO2 accumulation in the atmosphere is quite predictable over decadal time scales, and models could handily beat a naive forecast.
  6. AG&S’ method of forecast evaluation unduly weights the short term, like the A&G sucker bet does. This is not strictly a problem, but it does make interpretation of the bounds on AG&S’ alternate forecast (“The benchmark forecast is that the global mean temperature for each year for the rest of this century will be within 0.5°C of the 2008 figure.”) a little tricky.
  7. The retrospective evaluation of the 1990/1992 IPCC projection of 0.3C/decade ignores many factors. First, 0.3C/decade over a century does not imply a smooth trend over short time scales; models and reality have substantial unforced variability which must be taken into account. The paragraph cited by AG&S includes the statement, “The rise will not be steady because of the influence of other factors.” Second, the 1992 report (in the very paragraph AG&S cite) notes that projections do not account for aerosols, so 0.3C/decade can’t be taken as a point prediction for the future, even if contingency on GHG emissions is resolved. Third, the IPCC projection stated approximate bounds – 0.2 to 0.5 C/decade – that should be accounted for in the evaluation, but are not. Still, the IPCC projection beats the naive benchmark.
  8. AG&S’ evaluation of the 0.3C/decade future BAU projection as a backcast over 1851-1975 is absurd. They write, “It is not unreasonable, then, to suppose for the purposes of our validation illustration that scientists in 1850 had noticed that the increasing industrialization of the world was resulting in exponential growth in ‘greenhouse gases’ and to project that this would lead to global warming of 0.03°C per year.” Actually, it’s completely unreasonable. Many figures in the 1990 FAR clearly indicate that the 0.3C/decade projection was not valid on [-infinity,infinity]. For example, figures 6, 8, and 9 from the SPM – just a few pages from material cited by AG&S – clearly show a gentle trend <0.05C/decade through 1950. Furthermore, even the most rudimentary understanding of the dynamics of GHG and heat accumulation is sufficient to realize that one would not expect a linear historic temperature trend to emerge from the emissions signal.

How do AG&S arrive at this sorry state? Their article embodies a “sh!t happens” epistemology. They write, “The belief that ‘things have changed’ and the future cannot be judged by the past is common, but invalid.” The problem is, one can say with equal confidence that, “the belief that ‘things never change’ and the past reveals the future is common, but invalid.” In reality, there are predictable phenomena (the orbits of the planets) and unpredictable ones (the fall of the Berlin wall). AG&S have failed to establish that climate is unpredictable or to provide us with an appropriate method for deciding whether it is predictable or not. Nor have they given us any insight into how to know or what to do if we can’t decide. Doing nothing because we think we don’t know anything is probably better than sacrificing virgins to the gods, but it doesn’t strike me as a robust strategy.

Bolivia Barking

I recently wondered whether developing countries were asking for the wrong thing in Bonn. Now Bolivia is barking up the right tree with a proposed “climate debt” concept. The idea’s actually quite old; it’s already well developed in the Greenhouse Development Rights framework.

The trick is, how to achieve an equitable outcome that’s consistent with the physics of climate? Consider this reaction to ideas like climate debt:

Obama’s Global Tax

By INVESTOR’S BUSINESS DAILY | Posted Tuesday, July 29, 2008 4:20 PM PT

Election ’08: A plan by Barack Obama to redistribute American wealth on a global level is moving forward in the Senate. It follows Marxist theology – from each according to his ability, to each according to his need.

Obama would give them all a fish without teaching them how to fish. Pledging to cut global poverty in half on the backs of U.S. taxpayers is a ridiculous and impossible goal.

We already transfer too much national wealth to the United Nations and its busybody agencies. …

If you’re worried abut gasoline and heating oil prices now, think what they’ll be like when the U.S. is subjected in an Obama administration to global energy consumption and production taxes. Obama’s Global Poverty Act is the “international community’s” foot in the door.

Obama has called on the U.S. to “lead by example” on global warming and probably would submit to a Kyoto-like agreement that would sock Americans with literally trillions of dollars in costs over the next half century for little or no benefit.

“We can’t drive our SUVs and eat as much as we want and keep our homes on 72 degrees at all times . . . and then just expect that other countries are going to say OK,” Obama has said. “That’s not leadership. That’s not going to happen.”

Oh, really? Who’s to say we can’t load up our SUV and head out in search of bacon double cheeseburgers at the mall? China? India? Bangladesh? The U.N.?

I suspect that these sentiments are quite prevalent, at least in the US. I’m even sympathetic in at least one respect: transfers from the global rich to poor are beneficial in principle, but difficult to execute. Transfers from country to country are susceptible to capture by elites. Direct transfers among individuals could be facilitated by a global carbon market with allowances allocated to individuals (one of the few good arguments for emissions trading in my mind), but would undemocratic regimes permit their citizens to participate?

I don’t see agreement on this front any time soon. I could see things going a different way: the US, EU and a few other developed nations move to reduce, then goad developing nations along with a mixture of carrot (offset projects and other transfers) and stick (border carbon adjustments).

Strategic Excess? Breakthrough's Nightmare?

Since it was the Breakthrough analysis that got me started on this topic, I took a quick look at it again. Their basic objection is:

Therein lies a Catch-22 of ACES: if the annual use of up to 2 billion tons of offsets permitted by the bill is limited due to a restricted supply of affordable offsets, the government will pick up the slack by selling reserve allowances, and “refill” the reserve pool with international forestry offset allowances later. […]

The strategic allowance reserve would be established by taking a certain percentage of allowances originally reserved for the future — 1% of 2012-2019 allowances, 2% of 2020-2029 allowances, and 3% of 2030-2050 allowances — for a total size of 2.7 billion allowances. Every year throughout the cap and trade program, a certain portion of this reserve account would be available for purchase by polluters as a “safety valve” in case the price of emission allowances rises too high.

How much of the reserve account would be available for purchase, and for what price? The bill defines the reserve auction limit as 5 percent of total emissions allowances allocated for any given year between 2012-2016, and 10 percent thereafter, for a total of 12 billion cumulative allowances. For example, the bill specifies that 5.38 billion allowances are to be allocated in 2017 for “capped” sectors of the economy, which means 538 million reserve allowances could be auctioned in that year (10% of 5.38 billion). In other words, the emissions “cap” could be raised by 10% in any year after 2016.

First, it’s not clear to me that international offset supply for refilling the reserve is unlimited. Section 726 doesn’t say they’re unlimited, and a global limit of 1 to 1.5 GtCO2eq/yr applies elsewhere. Anyhow, given the current scale of the offset market, it’s likely that reserve refilling will be competing with market participants for a limited supply of allowances.

Second, even if offset refills do raise the de facto cap, that doesn’t raise global emissions, except to the extent that offsets aren’t real, additional and all that. With perfect offsets, global emissions would go down due to the 5:4 exchange ratio of offsets for allowances. If offsets are really rip-offsets, then W-M has bigger problems than the strategic reserve refill.

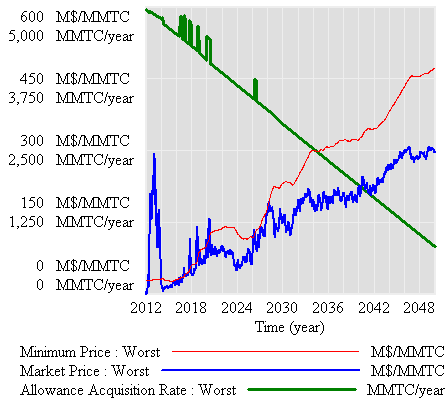
Third, and most importantly, the problem isn’t oversupply of allowances through the reserve. Instead, it’s hard to get allowances out of the reserve – they check in, and never check out. Simple math suggests, and simulations confirm, that it’s hard to generate a price trajectory yielding sustained auction release. Here’s a test with 3%/yr BAU emissions growth and 10% underlying demand volatility:

worstcase.png

Even with these implausibly high drivers, it’s hard to get a price trajectory that triggers a sustained auction flow, and total allowance supply (green) and emissions hardly differ from from the no-reserve case.

My preliminary simulation experiments suggest that it’s very unlikely that Breakthrough’s nightmare, a 10% cap violation, could really occur. To make that happen overall, you’d need sustained price increases of over 20% per year – i.e., an allowance price of $56,000/TonCO2eq in 2050. However, there are lesser nightmares hidden in the convoluted language – a messy program to administer, that in the end fails to mitigate volatility.

Strategic Excess? Insights

Model in hand, I tried some experiments (actually I built the model iteratively, while experimenting, but it’s hard to write that way, so I’m retracing my steps).

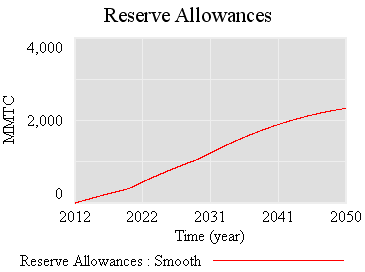
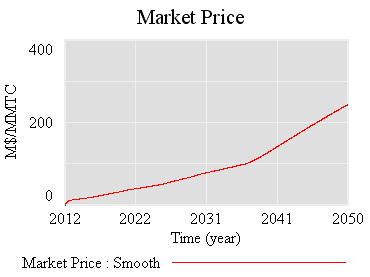
First, the “general equilbrium equivalent” version: no volatility, no SR marginal cost penalty for surprise, and firms see the policy coming. Result: smooth price escalation, and the strategic reserve is never triggered. Allowances just pile up in the reserve:
smoothallow.png

smoothprice.png

Since allowances accumulate, the de facto cap is 1-3% lower (by the share of allowances allocated to the reserve).

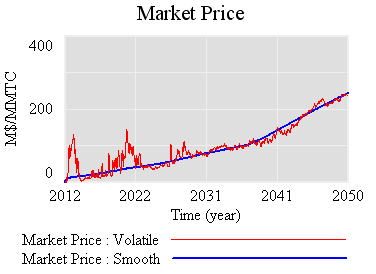
If there’s noise (SD=4.4%, comparable to petroleum demand), imperfect foresight, and short run adjustment costs, the market is more volatile:
volatileprice.png

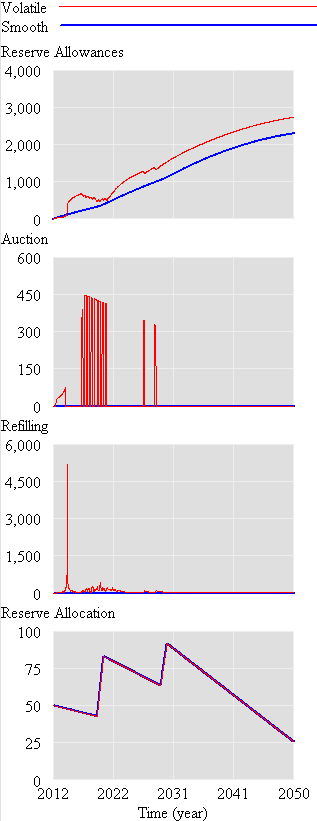
However, something strange happens. The stock of reserve allowances actually increases, even though some reserves are auctioned intermittently. That’s due to the refilling mechanism. An early auction, plus overreaction by firms, triggers a near-collapse in allowance prices (as happened in the ETS). Thus revenues generated in the reserve auction at high prices used to buy a lot of forestry offsets at very low prices:
volatileallow.png

Could this happen in reality? I’m not sure – it depends on timing, behavior, and details of the recycling implementation. I think it’s safe to say that the current design is not robust to such phenomena. Fortunately, the market impact over the long haul is not great, because the extra accumulated allowances don’t get used (they pile up, as in the smooth case).

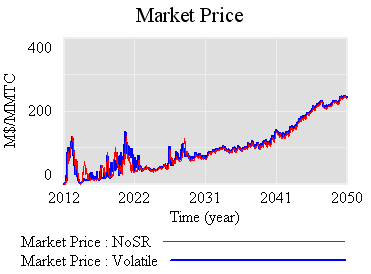
So, what is the reserve really accomplishing? Not much, it seems. Here’s the same trajectory, with volatility but no strategic reserve system:
noreserveprice.png

The mean price with the reserve (blue) is actually slightly higher, because the reserve mainly squirrels away allowances, without ever releasing them. Volatility is qualitatively the same, if not worse. That doesn’t seem like a good trade (unless you like the de facto emissions cut, which could be achieved more easily by lowering the cap and scrapping the reserve mechanism).

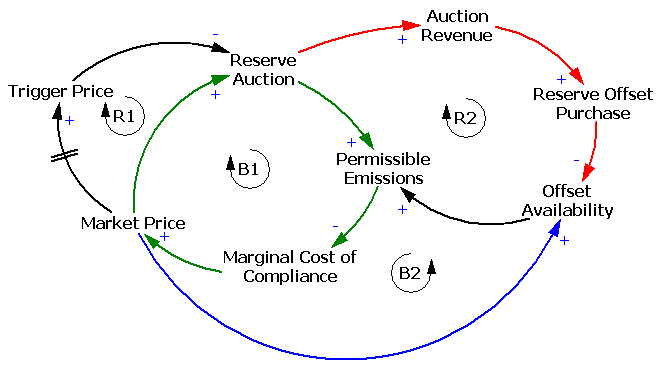
One reason the reserve fails to achieve its objectives is the recycling mechanism, which creates a perverse feedback loop that offsets the strategic reserve’s intended effect:
allowcld.png

The intent of the reserve is to add a balancing feedback loop (B2, green) that stabilizes price. The problem is, the recycling mechanism (R2, red) consumes international forestry offsets that would otherwise be available for compliance, thus working against normal market operations (B2, blue). Thus the mechanism is only helpful to the extent that it exploits clever timing (doubtful), has access to offsets unavailable to the broad market (also doubtful), or doesn’t recycle revenue to refill the reserve. If you have a reserve, but don’t refill, you get some benefit:
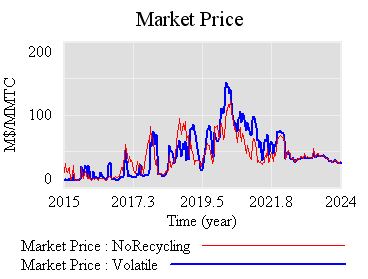
norecycleprice.png

Still, the reserve mechanism seems like a lot of complexity yielding little benefit. At best, it can iron out some wrinkles, but it does nothing about strong, sustained price excursions (due to picking an infeasible target, for example). Perhaps there is some other design that could perform better, by releasing and refilling the reserve in a more balanced fashion. That ideal starts to sound like “buy low, sell high” – which is what speculators in the market are supposed to do. So, again, why bother?

I suspect that a more likely candidate for stabilization, robust to uncertainty, involves some possible violation of the absolute cap (gasp!). Realistically, if there are sustained price excursions, congress will violate it for us, so perhaps its better to recognize that up front and codify some orderly process for adaptation. At the least, I think congress should scrap the current reserve, and write the legislation in such a way as to kick the design problem to EPA, subject to a few general goals. That way, at least there’d be time to think about the design properly.

Strategic Excess? The Model

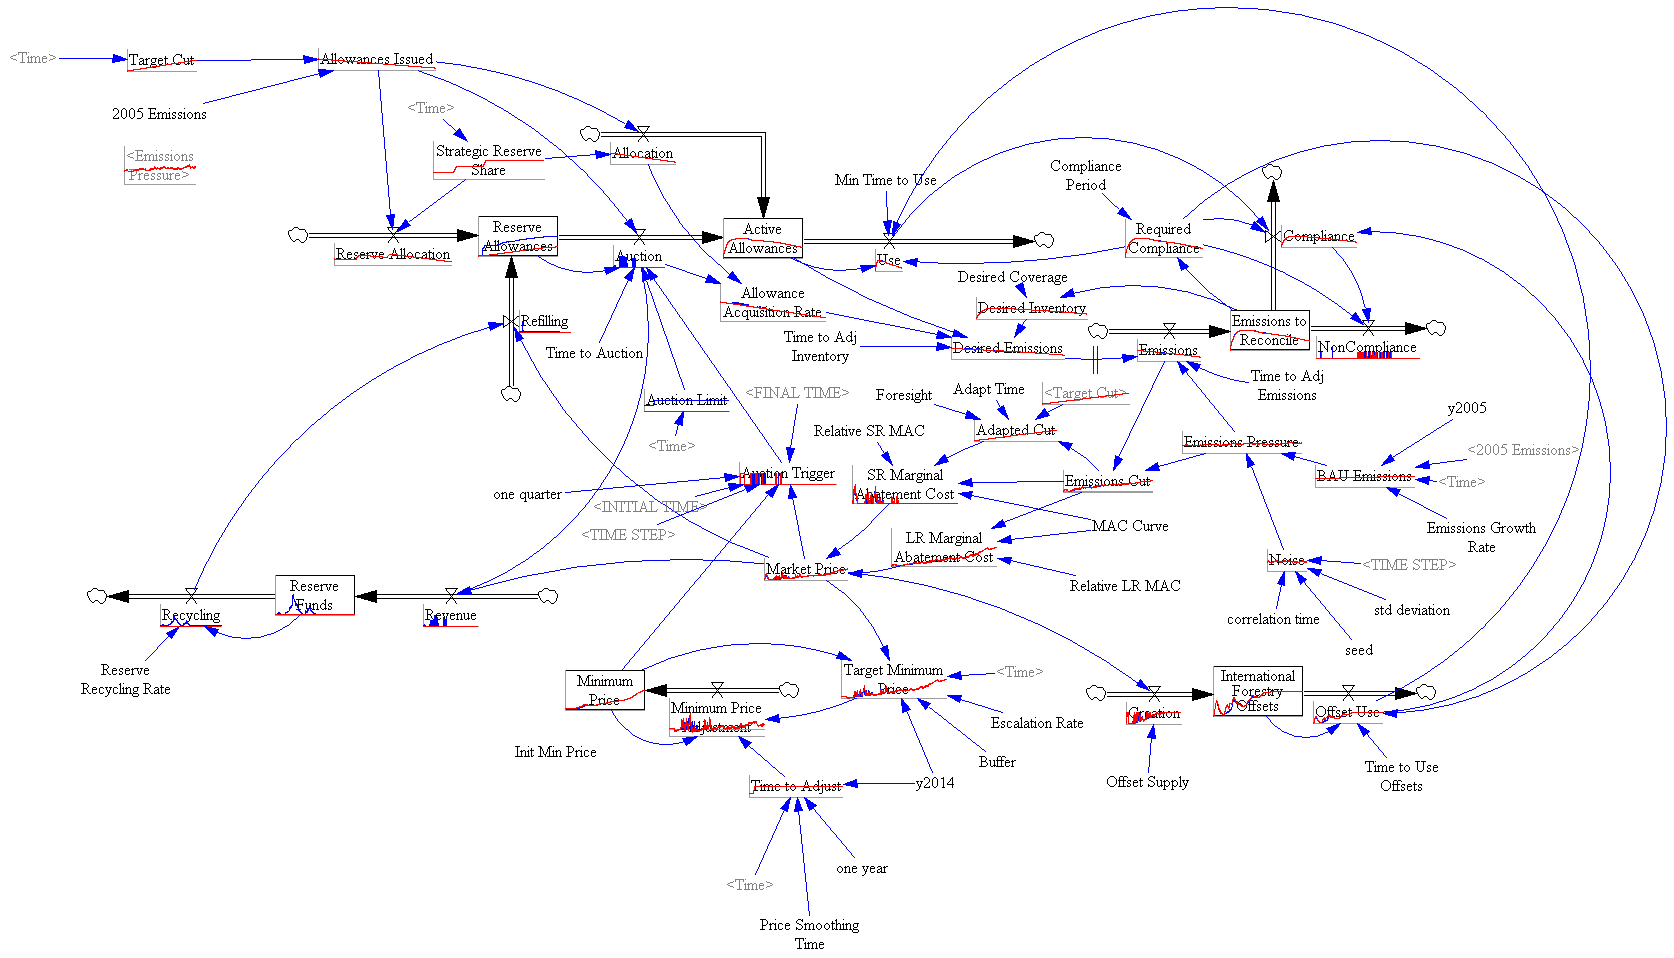
It’s hard to get an intuitive grasp on the strategic reserve design, so I built a model (which I’m not posting because it’s still rather crude, but will describe in some detail). First, I’ll point out that the model has to be behavioral, dynamic, and stochastic. The whole point of the strategic reserve is to iron out problems that surface due to surprises or the cumulative effects of agent misperceptions of the allowance market. You’re not going to get a lot of insight about this kind of situation from a CGE or intertemporal optimization model – which is troubling because all the W-M analysis I’ve seen uses equilibrium tools. That means that the strategic reserve design is either intuitive or based on some well-hidden analysis.

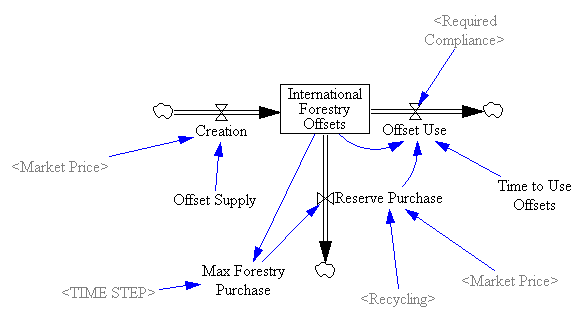
Here’s one version of my sketch of market operations (click to enlarge):
Strategic reserve structure

It’s already complicated, but actually less complicated than the mechanism described in W-M. For one thing, I’ve made some process continuous (compliance on a rolling basis, rather than at intervals) that sound like they will be discrete in the real implementation.

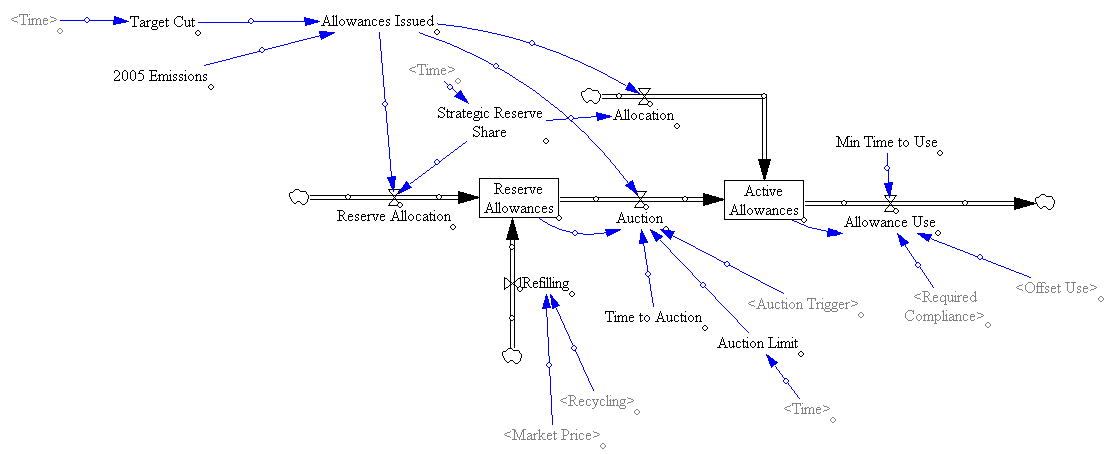
The strategic reserve is basically a pool of allowances withheld from the market, until need arises, at which point they are auctioned and become part of the active allowance pool, usable for compliance:

m-allowances.png

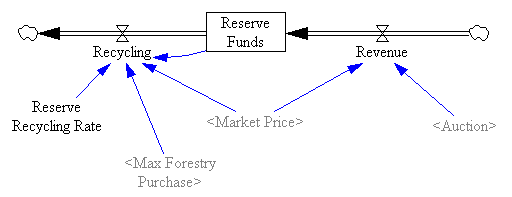
Reserves auctioned are – to some extent – replaced by recycling of the auction revenue:

m-funds.png

Refilling the strategic reserve consumes international forestry offsets, which may also be consumed by firms for compliance. Offsets are created by entrepreneurs, with supply dependent on market price.

m-offsets.png

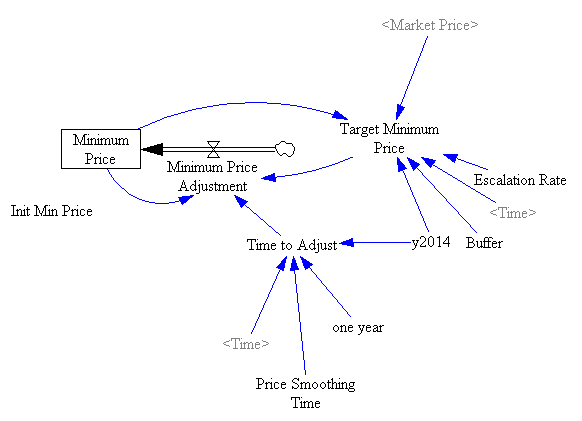
Auctions are triggered when market prices exceed a threshold, set according to smoothed actual prices:

m-trigger.png

(Actually I should have labeled this Maximum, not Minimum, since it’s a ceiling, not a floor.)

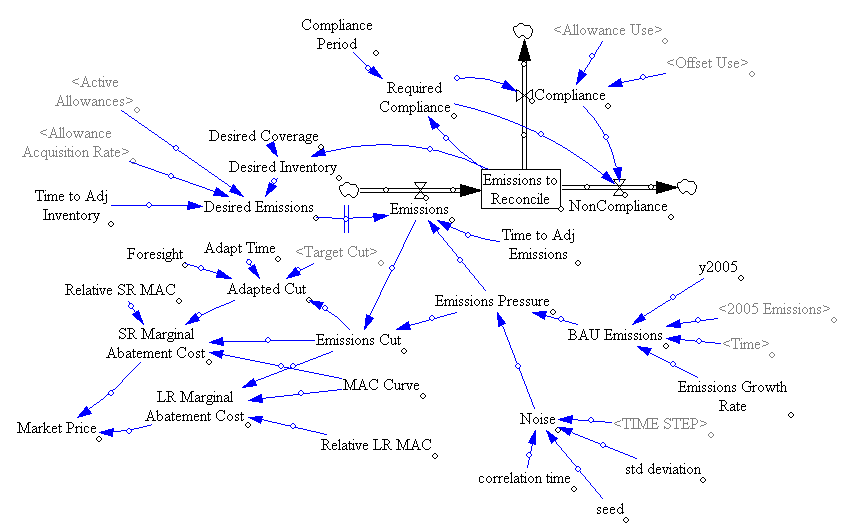
The compliance market is a bit complicated. Basically, there’s an aggregate firm that emits, and consumes offsets or allowances to cover its compliance obligation for those emissions (non-compliance is also possible, but doesn’t occur in practice; presumably W-M specifies a penalty). The firm plans its emissions to conform to the expected supply of allowances. The market price emerges from the marginal cost of compliance, which has long run and short run components. The LR component is based on eyeballing the MAC curve in the EPA W-M analysis. The SR component is arbitrarily 10x that, i.e. short term compliance surprises are 10x as costly (or the SR elasticity is 10x lower). Unconstrained firms would emit at a BAU level which is driven by a trend plus pink noise (the latter presumably originating from the business cyle, seasonality, etc.).

m-market.png

So far, so good. Next up: experiments.

Strategic Excess? Simple Math

Before digging into a model, I pondered the reserve mechanism a bit. The idea of the reserve is to provide cost containment. The legislation sets a price trigger at 60% above a 36-month moving average of allowance trade prices. When the current allowance price hits the trigger level, allowances held in the reserve are sold quarterly, subject to an upper limit of 5% to 20% of current-year allowance issuance.

To hit the +60% trigger point, the current price would have to rise above the average through some combination of volatility and an underlying trend. If there’s no volatility, the the trigger point permits a very strong trend. If the moving average were a simple exponential smooth, the basis for the trigger would follow the market price with a 36-month lag. That means the trigger would be hit when 60% = (growth rate)*(3 years), i.e. the market price would have to grow 20% per year to trigger an auction. In fact, the moving average is a simple average over a window, which follows an exponential input more closely, so the effective lag is only 1.5 years, and thus the trigger mechanism would permit 40%/year price increases. If you accept that the appropriate time trajectory of prices is more like an increase at the interest rate, it seems that the strategic reserve is fairly useless for suppressing any strong underlying exponential signal.

That leaves volatility. If we suppose that the underlying rate of increase of prices is 10%/year, then the standard deviation of the market price would have to be (60%-(10%/yr*1.5yr))/2 = 22.5% in order to trigger the reserve. That’s not out of line with the volatility of many commodities, but it seems like a heck of a lot of volatility to tolerate when there’s no reason to. Climate damages are almost invariant to whether a ton gets emitted today or next month, so any departure from a smooth price trajectory imposes needless costs (but perhaps worthwhile if cap & trade is really the only way to get a climate policy in place).

The volatility of allowance prices can be translated to a volatility of allowance demand by assuming an elasticity of allowance demand. If elasticity is -0.1 (comparable to short run gasoline estimates), then the underlying demand volatility would be 2.25%. The actual volatility of weekly petroleum consumption around a 1 quarter average is just about twice that:

Weekly petroleum products supplied

So, theoretically the reserve might shave some of these peaks, but one would hope that the carbon market wouldn’t be transmitting this kind of noise in the first place.