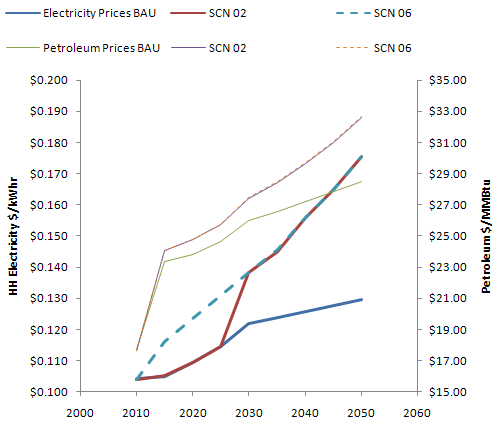
Mining my hard drive for stuff I did a few weeks back, when the Waxman Markey draft was just out, I ran across this graph:
It shows prices for electricity and petroleum from the ADAGE model in the June EPA analysis. BAU = business-as-usual; SCN 02 = updated Waxman-Markey scenario; SCN 06 = W-M without allowance allocations for consumer rate relief and a few other provisions. Notice how the retail price signal on electricity is entirely defeated until the 2025-2030 allowance phaseout. On the other hand, petroleum prices are up in either scenario, because there is no rate relief.
Four questions:
- Isn’t it worse to have a big discontinuity electricity prices in 2025-2030, rather than a smaller one in 2010-2015?
- Is your average household even going to notice a 1 or 2 c/kwh change over 5 years, given the volatility of other expenses?
- Since the NPV of the rate relief by 2025 is not much, couldn’t the phaseout happen a little faster?
- How does it help to defeat the price signal to the residential sector, a large energy consumer with low-hanging mitigation fruit?
Things might not be as bad as all this, if the goal (not mandate) of serving up rate relief as flat or fixed rebates is actually met. Then the cost of electricity at the margin will go up regardless of allowance allocation, and there would be some equity benefit. But my guess is that, even if that came to pass, consumers would watch their total bills, not the marginal cost, and thus defeat the price signal behaviorally. Also, will people with two addresses and two meters, like me, get a double rebate? Yippee!

