Category: Climate
The BEST of times, the worst of times
Climate skeptics’ opinions about global temperatures and the BEST project are a moving target:
August 27, 2010 (D’Aleo & Watts), there is no warming:
SUMMARY FOR POLICY MAKERS
1. Instrumental temperature data for the pre-satellite era (1850-1980) have been so widely, systematically, and uni-directionally tampered with that it cannot be credibly asserted there has been any significant “global warming” in the 20th century.
February 11, 2011 (Watts), an initial lovefest with the Berkeley Earth Surface Temperature (BEST) project:
Good news travels fast. I’m a bit surprised to see this get some early coverage, as the project isn’t ready yet. However since it has been announced by press, I can tell you that this project is partly a reaction and result of what we’ve learned in the surfacesations project, but mostly, this project is a reaction to many of the things we have been saying time and again, only to have NOAA and NASA ignore our concerns, or create responses designed to protect their ideas, rather than consider if their ideas were valid in the first place. …Note: since there’s been some concern in comments, I’m adding this: Here’s the thing, the final output isn’t known yet. There’s been no “peeking” at the answer, mainly due to a desire not to let preliminary results bias the method. It may very well turn out to agree with the NOAA surface temperature record, or it may diverge positive or negative. We just don’t know yet.
February 19, 2011 (Fred Singer @ wattsupwiththat):
The Berkeley Earth Surface Temperature (BEST) Project aims to do what needs to be done: That is, to develop an independent analysis of the data from land stations, which would include many more stations than had been considered by the Global Historic Climatology Network. The Project is in the hands of a group of recognized scientists, who are not at all “climate skeptics” — which should enhance their credibility….
I applaud and support what is being done by the Project — a very difficult but important undertaking. I personally have little faith in the quality of the surface data, having been exposed to the revealing work by Anthony Watts and others. However, I have an open mind on the issue and look forward to seeing the results of the Project in their forthcoming publications.
… The approaches that I’ve seen during my visit give me far more confidence than the “homogenization solves all” claims from NOAA and NASA GISS, and that the BEST result will be closer to the ground truth that anything we’ve seen.
… I think, based on what I’ve seen, that BEST has a superior method. Of course that is just my opinion, with all of it’s baggage; it remains to be seen how the rest of the scientific community will react when they publish.
In the meantime, never mind the yipping from climate chihuahuas like Joe Romm over at Climate Progress who are trying to destroy the credibility of the project before it even produces a result (hmmm, where have we seen that before?) , it is simply the modus operandi of the fearful, who don’t want anything to compete with the “certainty” of climate change they have been pushing courtesy NOAA and GISS results.
…
But here’s the thing: I have no certainty nor expectations in the results. Like them, I have no idea whether it will show more warming, about the same, no change, or cooling in the land surface temperature record they are analyzing. Neither do they, as they have not run the full data set, only small test runs on certain areas to evaluate the code. However, I can say that having examined the method, on the surface it seems to be a novel approach that handles many of the issues that have been raised.
As a reflection of my increased confidence, I have provided them with my surfacestations.org dataset to allow them to use it to run a comparisons against their data. The only caveat being that they won’t release my data publicly until our upcoming paper and the supplemental info (SI) has been published. Unlike NCDC and Menne et al, they respect my right to first publication of my own data and have agreed.
And, I’m prepared to accept whatever result they produce, even if it proves my premise wrong. I’m taking this bold step because the method has promise. So let’s not pay attention to the little yippers who want to tear it down before they even see the results. I haven’t seen the global result, nobody has, not even the home team, but the method isn’t the madness that we’ve seen from NOAA, NCDC, GISS, and CRU, and, there aren’t any monetary strings attached to the result that I can tell. If the project was terminated tomorrow, nobody loses jobs, no large government programs get shut down, and no dependent programs crash either. That lack of strings attached to funding, plus the broad mix of people involved especially those who have previous experience in handling large data sets gives me greater confidence in the result being closer to a bona fide ground truth than anything we’ve seen yet. Dr. Fred Singer also gives a tentative endorsement of the methods.
My gut feeling? The possibility that we may get the elusive “grand unified temperature” for the planet is higher than ever before. Let’s give it a chance.
I still believe that BEST represents a very good effort, and that all parties on both sides of the debate should look at it carefully when it is finally released, and avail themselves to the data and code that is promised to allow for replication.
March 31, 2011 (Watts), beginning to grumble when the results don’t look favorable to the no-warming point of view:
There seems a bit of a rush here, as BEST hasn’t completed all of their promised data techniques that would be able to remove the different kinds of data biases we’ve noted. That was the promise, that is why I signed on (to share my data and collaborate with them). Yet somehow, much of that has been thrown out the window, and they are presenting some results today without the full set of techniques applied. Based on my current understanding, they don’t even have some of them fully working and debugged yet. Knowing that, today’s hearing presenting preliminary results seems rather topsy turvy. But, post normal science political theater is like that.
… I’ll point out that on the front page of the BEST project, they tout openness and replicability, but none of that is available in this instance, even to Dr. Pielke and I. They’ve had a couple of weeks with the surfacestations data, and now without fully completing the main theme of data cleaning, are releasing early conclusions based on that data, without providing the ability to replicate. I’ve seen some graphical output, but that’s it. What I really want to see is a paper and methods. Our upcoming paper was shared with BEST in confidence.
The Berkeley Earth Surface Temperature project puts PR before peer review
… [Lots of ranting, primarily about the use of a 60 year interval] …
So now (pending peer-review and publication) we have the interesting situation of a Koch institution, a left-wing boogy-man, funding an unbiased study that confirms the previous temperature estimates, “consistent with global land-surface warming results previously reported, but with reduced uncertainty.”
Oct. 21, 2011 (Keenan @ wattsupwiththat), an extended discussion of smoothing, AR(1) noise and other statistical issues, much of which appears to be founded on misconceptions*:
This problem seems to invalidate much of the statistical analysis in your paper.
Oct. 22, 2011 (Eschenbach @ wattsupwiththat), preceded by a lot of nonsense based on the fact that he’s too lazy to run BEST’s Matlab code:
PS—The world is warming. It has been for centuries.
* Update: or maybe not. Still, the paper has nothing to do with the validity of the BEST version of the observational record.
Climate Catastrophe
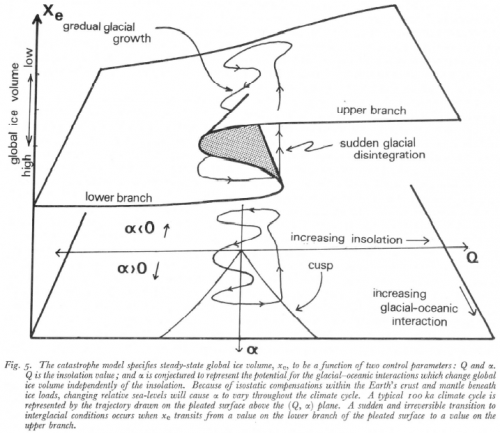
This is an interesting, simple model of global ice age dynamics, from:
It illustrates a pitchfork bifurcation as a slice through a cusp catastrophe. It’s conceptually related to earlier models by Budyko and Weertmans that demonstrated hysteresis in temperature and ice sheet dynamics.
The model is used qualitatively in the paper. I’ve assigned units of measure and parameter values that reveal the behavior of the catastrophe, but there’s no guarantee that they are physically realistic.
The .vpm package includes several .cin (changes) files that reproduce interesting tests on the model. The model runs in PLE, but you may want to use the Model Reader to access the .cin files in SyntheSim.
A natural driver of increasing CO2 concentration?
You wouldn’t normally look at a sink with the tap running and conclude that the water level must be rising because the drain is backing up. Nevertheless, a physically similar idea has been popular in climate skeptic circles lately.
You actually don’t need much more than a mass balance to conclude that anthropogenic emissions are the cause of rising atmospheric CO2, but with a model and some data you can really pound a lot of nails into the coffin of the idea that temperature is somehow responsible.
This notion has been adequately debunked already, but here goes:
This is another experimental video. As before, there’s a lot of fine detail, so you may want to head over to Vimeo to view in full screen HD. I find it somewhat astonishing that it takes 45 minutes to explore a first-order model.
Here’s the model: co2corr2.vpm (runs in Vensim PLE; requires DSS or Pro for calibration optimization)
Update: a new copy, replacing a GET DATA FIRST TIME call to permit running with simpler versions of Vensim. co2corr3.vpm
The seven-track melee
In boiled frogs I explored the implications of using local weather to reason about global climate. The statistical fallacies (local = global and weather = climate) are one example of the kinds of failures on my list of reasons for science denial.
As I pondered the challenge of upgrading mental models to cope with big problems like climate, I ran across a great paper by Barry Richmond (creator of STELLA, and my first SD teacher long ago). He inventories seven systems thinking skills, which nicely dovetail with my thinking about coping with complex problems.
Some excerpts:
Skill 1: dynamic thinking
Dynamic thinking is the ability to see and deduce behavior patterns rather than focusing on, and seeking to predict, events. It’s thinking about phenomena as resulting from ongoing circular processes unfolding through time rather than as belonging to a set of factors. …
Skill 2: closed-loop thinking
The second type of thinking process, closed-loop thinking, is closely linked to the first, dynamic thinking. As already noted, when people think in terms of closed loops, they see the world as a set of ongoing, interdependent processes rather than as a laundry list of one-way relations between a group of factors and a phenomenon that these factors are causing. But there is more. When exercising closed-loop thinking, people will look to the loops themselves (i.e., the circular cause-effect relations) as being responsible for generating the behavior patterns exhibited by a system. …
Skill 3: generic thinking
Just as most people are captivated by events, they are generally locked into thinking in terms of specifics. … was it Hitler, Napoleon, Joan of Arc, Martin Luther King who determined changes in history, or tides in history that swept these figures along on their crests? … Apprehending the similarities in the underlying feedback-loop relations that generate a predator-prey cycle, a manic-depressive swing, the oscillation in an L-C circuit, and a business cycle can demonstrate how generic thinking can be applied to virtually any arena.
Skill 4: structural thinking
Structural thinking is one of the most disciplined of the systems thinking tracks. It’s here that people must think in terms of units of measure, or dimensions. Physical conservation laws are rigorously adhered to in this domain. The distinction between a stock and a flow is emphasized. …
Skill 5: operational thinking
Operational thinking goes hand in hand with structural thinking. Thinking operationally means thinking in terms of how things really work—not how they theoretically work, or how one might fashion a bit of algebra capable of generating realistic-looking output. …
Skill 6: continuum thinking
Continuum thinking is nourished primarily by working with simulation models that have been built using a continuous, as opposed to discrete, modeling approach. … Although, from a mechanical standpoint, the differences between the continuous and discrete formulations may seem unimportant, the associated implications for thinking are quite profound. An “if, then, else” view of the world tends to lead to “us versus them” and “is versus is not” distinctions. Such distinctions, in turn, tend to result in polarized thinking.
Skill 7: scientific thinking
… Let me begin by saying what scientific thinking is not. My definition of scientific thinking has virtually nothing to do with absolute numerical measurement. … To me, scientific thinking has more to do with quantification than measurement. … Thinking scientifically also means being rigorous about testing hypotheses. … People thinking scientifically modify only one thing at a time and hold all else constant. They also test their models from steady state, using idealized inputs to call forth “natural frequency responses.”
When one becomes aware that good systems thinking involves working on at least these seven tracks simultaneously, it becomes a lot easier to understand why people trying to learn this framework often go on overload. When these tracks are explicitly organized, and separate attention is paid to develop each skill, the resulting bite-sized pieces make the fare much more digestible. …
The connections among the various physical, social, and ecological subsystems that make up our reality are tightening. There is indeed less and less “away,” both spatially and temporally, to throw things into. Unfortunately, the evolution of our thinking capabilities has not kept pace with this growing level of interdependence. The consequence is that the problems we now face are stubbornly resistant to our interventions. To “get back into the foot race,” we will need to coherently evolve our educational system
… By viewing systems thinking within the broader context of critical thinking skills, and by recognizing the multidimensional nature of the thinking skills involved in systems thinking, we can greatly reduce the time it takes for people to apprehend this framework. As this framework increasingly becomes the context within which we think, we will gain much greater leverage in addressing the pressing issues that await us …
Source: Barry Richmond, “Systems thinking: critical thinking skills for the 1990s and beyond” System Dynamics Review Volume 9 Number 2 Summer 1993
That was 18 years ago, and I’d argue that we’re still not back in the race. Maybe recognizing the inherent complexity of the challenge and breaking it down into digestible chunks will help though.
Another wine tasting with talking animals?
John Sterman takes time off from bathtub dynamics for a cameo appearance in a ScienceFriday cartoon:
Boiled frogs, pattern recognition and climate policy
A friend (who shall remain nameless to avoid persecution) relates:
I just have to share a somewhat funny, mostly frustrating story. XXX and I went to Montreal to see U2 last night …
So at the end of the show, it started raining. Not a light rain but a sharp, arctic windy rain to the point we were all saturated within minutes. No exaggeration. It took us 2 hours to get out of the stadium, to the Metro, and back to the hotel because there were 80,000 people trying to get out. It was purgatory. It was after 3 am before we finally got to sleep.
OK, that’s not the story either. My point, besides sharing the night with you, is to explain my state of mind leading up to the customs experience. At the border, things were going smoothly … until the security guard asked us what we do for work. When I told him what I do, he retorted, “Global warming is not happening. Have you seen the cold weather we’ve had for the past five years?” Of course, I couldn’t let that just sit there. I explained climate change is not just warmer weather but more extreme events and weather is different from climate. So then we actually started arguing about this and I got all fired up …
Now the frustrating part. As we drove away, though, I just felt so despondent that this is the battle with much of the public that we face. How can we convince people to act and to demand their government to act when they really don’t think there is a problem? I’ve been thinking we should utilize some of our time to reach out to the masses who are not looking to improve their mental models of climate change because they don’t even think such a thing exists. …
The fundamental problem, I think, is that evidence for climate change relies on a variety of measurements dispersed over the globe, and physics and models at a variety of levels of complexity. Yet neither of these is accessible to ordinary people. Therefore, when presented with a mix of inconvenience of reducing emissions, false balance, and pseudoscience, people default to a “trust no one” approach, only believing what they can perceive with their own senses: local weather.
That’s a problem, for several reasons. First, local weather is extremely noisy, and only loosely correlated with global energy balance. So, even a person with unbiased weather perception and perfect recall over a long time period really shouldn’t be drawing any conclusions about global conditions from local measurements.
Second, no one has unbiased perception and perfect recall over long periods. Consider the “cold weather we’ve had for the past five years.” Here’s the temperature from the USHCN Enosburg Falls, VT station, near the border crossing, from 1891 through the end of 2009, in degrees Fahrenheit:
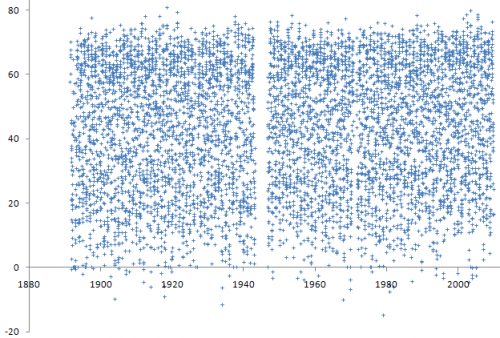
It’s hard to imagine something happening in 2010 and 2011 that could lead one to feel good about conclusively calling a 5-yr cold spell. In fact, almost the only thing you can see here is a slight upward trend.
Continue reading “Boiled frogs, pattern recognition and climate policy”
Et tu, EJ?
I’m not a cap & trade fan, but I find it rather bizarre that the most successful opposition to California’s AB32 legislation comes from the environmental justice (EJ) movement, on the grounds that cap & trade might make emissions go up in areas that are already disadvantaged, and that Air Resources failed to adequately consider alternatives like a carbon tax.
I think carbon taxes did get short shrift in the AB32 design. Taxes were a second-place favorite among economists in the early days, but ultimately the MAC analysis focused on cap & trade, because it provided environmental certainty needed to meet legal targets (oops), but also because it was political suicide to say “tax” out loud at the time.
While cap & trade has issues with dynamic stability, allocation wrangling and complexity, it’s hard to imagine any way that those drawbacks would change the fundamental relationship between the price signal’s effect on GHGs vs. criteria air pollutants. In fact, GHGs and other pollutant emissions are highly correlated, so it’s quite likely that cap & trade will have ancillary benefits from other pollutant reductions.
To get specific, think of large point sources like refineries and power plants. For the EJ argument to make sense, you’d have to think that emitters would somehow meet their greenhouse compliance obligations by increasing their emissions of nastier things, or at least concentrating them all at a few facilities in disadvantaged areas. (An analogy might be removing catalytic converters from cars to increase efficiency.) But this can’t really happen, because the air quality permitting process is not superseded by the cap & trade system. In the long run, it’s also inconceivable that it could occur, because there’s no way you could meet compliance obligations for deep cuts by increasing emissions. A California with 80% cuts by 2050 isn’t going to have 18 refineries, and therefore it’s not going to emit as much.
The ARB concludes as much in a supplement to the AB32 scoping plan, released yesterday. It considers alternatives to cap & trade. There’s some nifty stuff in the analysis, including a table of existing emissions taxes (page 89).
It seems that to some extent ARB has tilted the playing field a bit by evaluating a dumb tax, i.e. one that doesn’t adapt its price level to meet environmental objectives without legislative intervention, and heightening leakage concerns that strike me as equally applicable to cap & trade. But they do raise legitimate legal concerns – a tax is not a legal option for ARB without a vote of the legislature, which would likely fail because it requires a supermajority, and tax-equivalent fees are a dubious proposition.
If there’s no Plan B alternative to cap and trade, I wonder what the EJ opposition was after? Surely failure to address emissions is not compatible with a broad notion of justice.
Wedge furor
Socolow is quoted in Nat Geo as claiming the stabilization wedges were a mistake,
“With some help from wedges, the world decided that dealing with global warming wasn’t impossible, so it must be easy,” Socolow says. “There was a whole lot of simplification, that this is no big deal.”
Pielke quotes & gloats:
Socolow’s strong rebuke of the misuse of his work is a welcome contribution and, perhaps optimistically, marks a positive step forward in the climate debate.
Romm refutes,
I spoke to Socolow today at length, and he stands behind every word of that — including the carefully-worded title. Indeed, if Socolow were king, he told me, he’d start deploying some 8 wedges immediately. A wedge is a strategy and/or technology that over a period of a few decades ultimately reduces projected global carbon emissions by one billion metric tons per year (see Princeton website here). Socolow told me we “need a rising CO2 price” that gets to a serious level in 10 years. What is serious? “$50 to $100 a ton of CO2.”
Revkin weighs in with a broader view, but the tone is a bit Pielkeish,
From the get-go, I worried about the gushy nature of the word “solving,” particularly given that there was then, and remains, no way to solve the climate problem by 2050.
David Roberts wonders what the heck Socolow is thinking.
Who’s right? I think it’s best in Socolow’s own words (posted by Revkin):
1. Look closely at what is in quotes, which generally comes from my slides, and what is not in quotes. What is not in quotes is just enough “off” in several places to result in my messages being misconstrued. I have given a similar talk about ten times, starting in December 2010, and this is the first time that I am aware of that anyone in the audience so misunderstood me. I see three places where what is being attributed to me is “off.”
a. “It was a mistake, he now says.” Steve Pacala’s and my wedges paper was not a mistake. It made a useful contribution to the conversation of the day. Recall that we wrote it at a time when the dominant message from the Bush Administration was that there were no available tools to deal adequately with climate change. I have repeated maybe a thousand times what I heard Spencer Abraham, Secretary of Energy, say to a large audience in Alexandria. Virginia, early in 2004. Paraphrasing, “it will take a discovery akin to the discovery of electricity” to deal with climate change. Our paper said we had the tools to get started, indeed the tools to “solve the climate problem for the next 50 years,” which our paper defined as achieving emissions 50 years from now no greater than today. I felt then and feel now that this is the right target for a world effort. I don’t disown any aspect of the wedges paper.
b. “The wedges paper made people relax.” I do not recognize this thought. My point is that the wedges people made some people conclude, not surprisingly, that if we could achieve X, we could surely achieve more than X. Specifically, in language developed after our paper, the path we laid out (constant emissions for 50 years, emissions at stabilization levels after a second 50 years) was associated with “3 degrees,” and there was broad commitment to “2 degrees,” which was identified with an emissions rate of only half the current one in 50 years. In language that may be excessively colorful, I called this being “outflanked.” But no one that I know of became relaxed when they absorbed the wedges message.
c. “Well-?intentioned groups misused the wedges theory.” I don’t recognize this thought. I myself contributed the Figure that accompanied Bill McKibben’s article in National Geographic that showed 12 wedges (seven wedges had grown to eight to keep emissions level, because of emissions growth post-?2006 and the final four wedges drove emissions to half their current levels), to enlist the wedges image on behalf of a discussion of a two-?degree future. I am not aware of anyone misusing the theory.
2. I did say “The job went from impossible to easy.” I said (on the same slide) that “psychologists are not surprised,” invoking cognitive dissonance. All of us are more comfortable with believing that any given job is impossible or easy than hard. I then go on to say that the job is hard. I think almost everyone knows that. Every wedge was and is a monumental undertaking. The political discourse tends not to go there.
3. I did say that there was and still is a widely held belief that the entire job of dealing with climate change over the next 50 years can be accomplished with energy efficiency and renewables. I don’t share this belief. The fossil fuel industries are formidable competitors. One of the points of Steve’s and my wedges paper was that we would need contributions from many of the available option. Our paper was a call for dialog among antagonists. We specifically identified CO2 capture and storage as a central element in climate strategy, in large part because it represents a way of aligning the interests of the fossil fuel industries with the objective of climate change.
…
It is distressing to see so much animus among people who have common goals. The message of Steve’s and my wedges paper was, above all, ecumenical.
My take? It’s rather pointless to argue the merits of 7 or 14 or 25 wedges. We don’t really know the answer in any detail. Do a little, learn, do some more. Socolow’s $50 to $100 a ton would be a good start.
three
a. “It
It
time
available
thousand
audience
akin
the
tools
to
get
started,
indeed
the
tools
to
“solve
the
climate
problem
for
the
next
50
years,”
than
disown
any
aspect
of
the
wedges
paper.
b. “The
wedges
paper
made
people
relax.”
I
do
not
recognize
this
thought.
My
point
is
that
the
wedges
people
made
some
people
conclude,
not
surprisingly,
that
if
we
could
achieve
after
our
paper,
the
path
we
laid
out
(constant
emissions
for
50
years,
emissions
at
stabilization
was
only
half
the
current
one
in
50
years.
In
language
that
may
be
excessively
colorful,
I
called
this
being
“outflanked.”
But
no
one
that
I
know
of
became
relaxed
when
they
absorbed
the
wedges
message.
c.
“Well-?intentioned
myself
contributed
the
Figure
that
accompanied
Bill
McKibben’s
article
in
National
Geographic
emissions
emissions
discussion
Bigfoot II
I just rediscovered the Carnegie Mellon EIO-LCA tool, an online model for input-output lifecycle analysis. I ran it for the “Electronic computer manufacturing” sector to see how the results compare with Apple’s lifecycle analysis of my new MacBook.
The result: 284 tons CO2eq per million dollars of output. That translates to 340 kg for a $1200 computer. This is almost the same as Apple’s number, except that the Apple figure includes lifecycle emissions from use, for about a third of the total, so Apple’s manufacturing emissions are about a third lower than the generic computer sector in the EIO-LCA tool.
Directionally, it’s interesting that Apple’s estimate (presumably a process-based accounting) is lower, given that manufacturing happens in China, where electricity and GDP are both carbon-intensive on average. I wouldn’t read too much into the differences without digging much deeper though.


 (Click through for the full strip)