The Chartjunk Pandemic

So much junk, so little time.

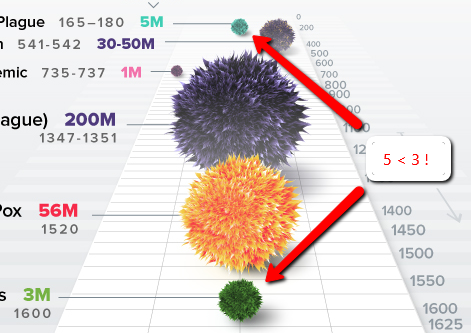
The ‘net is awash with questionable coronavirus memes. The most egregiously flawed offender I’ve seen is this one from visualcapitalist:

It’s interesting data, but the visualization really fails to put COVID19 in a proper perspective.


Exponential Growth

The biggest problem is obvious: the bottom of the curve is nothing like the peak for a quantity that grows exponentially.

Comparing the current death toll from COVID19, a few months old, to the final values from other epidemics over years to decades, is just spectacularly misleading. It beggars belief that anyone could produce such a comparison.

Perspective

Speaking of perspective, charts like this are rarely a good idea. This one gives the impression that 5M < 3M:

Reliance on our brains to map 2D to 3D is even more problematic when you consider the next problem.

2D or 3D?

Measuring the fur-blob sizes shows that the mapping of the data to the blobs is two-dimensional: the area of the blob on the page represents the magnitude. But the blobs are clearly rendered in 3D. That means the visual impression of the relationship between the Black Death (200M) and Japanese Smallpox (1M) is off by a factor of 15. The distortion is even more spectacular for COVID19.

You either have to go all the way with 3D, in which case COVID19 looks bigger, even with the other distortions unaddressed, or you need to make a less-sexy but more-informative flat 2D chart.

Stocks vs. Flows

The fourth problem here is that the chart neglects time. The disruption from an epidemic is not simply a matter of its cumulative death toll. The time distribution also matters: a large impact concentrated in a brief time frame has much greater ripple effects, as we are now experiencing.

Loopy

I just gave Loopy a try, after seeing Gene Bellinger’s post about it.

It’s cool for diagramming, and fun. There are some clever features, like drawing a circle to create a node (though I was too dumb to figure that out right away). Its shareability and remixing are certainly useful.

However, I think one must be very cautious about simulating causal loop diagrams directly. A causal loop diagram is fundamentally underspecified, which is why no method of automated conversion of CLDs to models has been successful.

In this tool, behavior is animated by initially perturbing the system (e.g, increase the number of rabbits in a predator-prey system). Then you can follow the story around a loop via animated arrow polarity changes – more rabbits causes more foxes, more foxes causes less rabbits. This is essentially the storytelling method of determining loop polarity, which I’ve used many times to good effect.

However, as soon as the system has multiple loops, you’re in trouble. Link polarity tells you the direction of change, but not the gain or nonlinearity. So, when multiple loops interact, there’s no way to determine which is dominant. Also, in a real system it matters which nodes are stocks; it’s not sufficient to assume that there must be at least one integration somewhere around a loop.

You can test this for yourself by starting with the predator-prey example on the home page. The initial model is a discrete oscillator (more rabbits -> more foxes -> fewer rabbits). But the real system is nonlinear, with oscillation and other possible behaviors, depending on parameters. In Loopy, if you start adding explicit births and deaths, which should get you closer to the real system, simulations quickly result in a sea of arrows in conflicting directions, with no way to know which tendency wins. So, the loop polarity simulation could be somewhere between incomprehensible and dead wrong.

Similarly, if you consider an SIR infection model, there are three loops of interest: spread of infection by contact, saturation from running out of susceptibles, and recovery of infected people. Depending on the loop gains, it can exhibit different behaviors. If recovery is stronger than spread, the infection dies out. If spread is initially stronger than recovery, the infection shifts from exponential growth to goal seeking behavior as dominance shifts nonlinearly from the spread loop to the saturation loop.

I think it would be better if the tool restricted itself to telling the story of one loop at a time, without making the leap to system simulations that are bound to be incorrect in many multiloop cases. With that simplification, I’d consider this a useful item in the toolkit. As is, I think it could be used judiciously for explanations, but for conceptualization it seems likely to prove dangerous.

My mind goes back to Barry Richmond’s approach to systems here. Causal loop diagrams promote thinking about feedback, but they aren’t very good at providing an operational description of how things work. When you’re trying to figure out something that you don’t understand a priori, you need the bottom-up approach to synthesize the parts you understand into the whole you’re grasping for, so you can test whether your understanding of processes explains observed behavior. That requires stocks and flows, explicit goals and actual states, and all the other things system dynamics is about. If we could get to that as elegantly as Loopy gets to CLDs, that would be something.

Dead buffalo diagrams

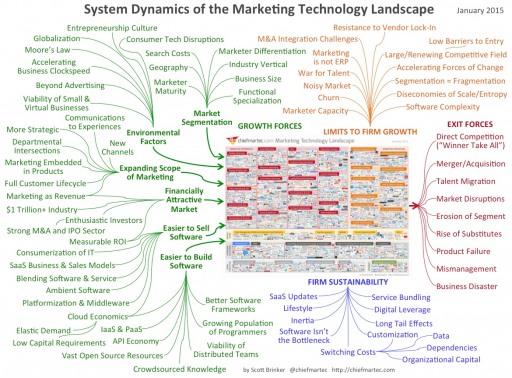
I think it was George Richardson who coined the term “dead buffalo” to refer to a diagram that surrounds a central concept with a hail of inbound causal arrows explaining it. This arrangement can be pretty useful as a list of things to think about, but it’s not much help toward solving a systemic problem from an endogenous point of view.

I recently found the granddaddy of them all:

dead_buffalo

Circling the Drain

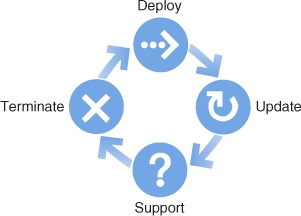
“It’s Time to Retire ‘Crap Circles’,” argues Gardiner Morse in the HBR. I wholeheartedly agree. He’s assembled a lovely collection of examples. Some violate causality amusingly:

“Through some trick of causality, termination leads to deployment.”

Morse ridicules one diagram that actually shows an important process,

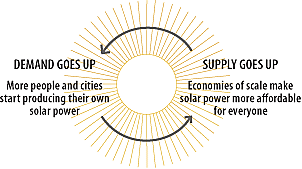
The friendly-looking sunburst that follows, captured from the website of a solar energy advocacy group, shows how to create an unlimited market for your product. Here, as the supply of solar energy increases, so does the demand — in an apparently endless cycle. If these folks are right, we’re all in the wrong business.

This is not a particularly well-executed diagram, but the positive feedback process (reinforcing loop) of increasing demand driving economies of scale, lowering costs and further increasing demand, is real. Obviously there are other negative loops that restrain this one from delivering infinite solar, but not every diagram needs to show every loop in a system.

Unfortunately, Morse’s prescription, “We could all benefit from a little more linear thinking,” is nearly as alarming as the illness. The vacuous linear processes are right there next to the cycles in PowerPoint’s Smart Art:

Linear thinking isn’t a get-out-of-chartjunk-free card. It’s an invitation to event-driven unidirectional causal thinking, laundry lists, and George Richardson’s Dead Buffalo Syndrome. What we really need is more understanding of causality and feedback, and more operational thinking, so that people draw meaningful graphics, employing cycles where they appropriately describe causality.

h/t John Sterman for pointing this out.

Disinfographics

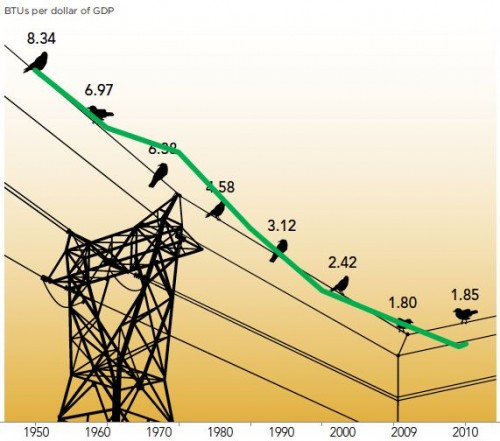
I cringed when I saw the awful infographics in a recent GreenBiz report, highlighted in a Climate Progress post. A site that (rightly) criticizes the scientific illiteracy of the GOP field shouldn’t be gushing over chartjunk that would make USA Today blush. Climate Progress dumped my mildly critical comment into eternal moderation queue purgatory, so I have to rant about this a bit.

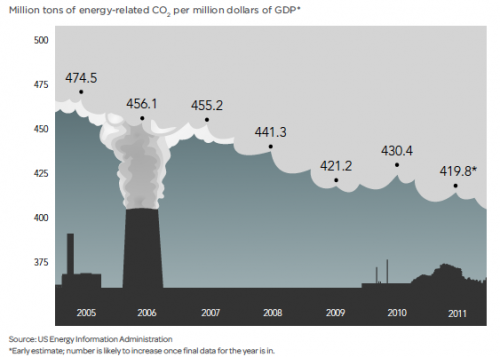
Here’s one of the graphics, with my overlay of the data plotted correctly (in green):

“What We Found: The energy consumed per dollar of gross domestic product grew slightly in 2010, the first increase after steady declines for more than half a century.”

Notice that:

  • No, there really wasn’t a great cosmic coincidence that caused energy intensity to progress at a uniform rate from 1950-1970 and 1980-2009, despite the impression given by the arrangements of points on the wire.
  • The baseline of the original was apparently some arbitrary nonzero value.
  • The original graphic vastly overstates the importance of the last two data points by using a nonuniform time axis.

The issues are not merely aesthetic; the bad graphics contribute to distorted interpretations of reality, as the caption above indicates. From another graphic (note the short horizon and nonzero baseline), CP extracts the headline, “US carbon intensity is flat lining.”

From any reasonably long sample of the data it should be clear that the 2009-2011 “flat lining” is just a blip, having little to do with the long term emission trends we need to modify to achieve deep emissions reductions.

The other graphics in the article are each equally horrific in their own special way.

My advice to analysts is simple. If you want to communicate information, find someone numerate who’s read Tufte to make your plots. If you must have a pretty picture for eye candy, use it as a light background to an accurate plot. If you want pretty pictures to persuade people without informing them, skip the data and use a picture of a puppy. Here, you can even use my puppy:

Diagramming for thinking

An article in Science asks,

Should science learners be challenged to draw more? Certainly making visualizations is integral to scientific thinking. Scientists do not use words only but rely on diagrams, graphs, videos, photographs, and other images to make discoveries, explain findings, and excite public interest. From the notebooks of Faraday and Maxwell to current professional practices of chemists, scientists imagine new relations, test ideas, and elaborate knowledge through visual representations.

Drawing to Learn in Science, Shaaron Ainsworth, Vaughan Prain, Russell Tytler (this link might not be paywalled)

Continuing,

However, in the science classroom, learners mainly focus on interpreting others’ visualizations; when drawing does occur, it is rare that learners are systematically encouraged to create their own visual forms to develop and show understanding. Drawing includes constructing a line graph from a table of values, sketching cells observed through a microscope, or inventing a way to show a scientific phenomenon (e.g., evaporation). Although interpretation of visualizations and other information is clearly critical to learning, becoming proficient in science also requires learners to develop many representational skills. We suggest five reasons why student drawing should be explicitly recognized alongside writing, reading, and talking as a key element in science education. …

The paper goes on to list a lot of reasons why this is important. Continue reading “Diagramming for thinking”

Debt crisis in the European Minifigure Union

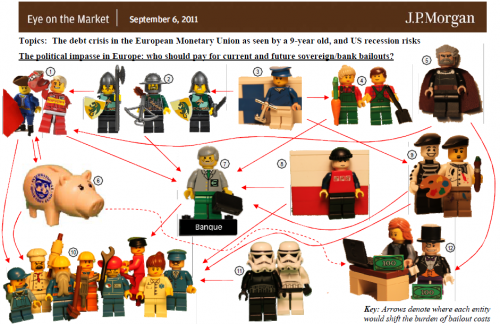
A clever visualization from a 9-year-old:


Click through to the original .pdf for the numbered legend.

This is isn’t quite a causal loop diagram; arrows indicate “where each entity would shift the burden of bailout costs,” but the network of relationships implies a lot of interesting dynamics.

Via 4D Pie Charts.