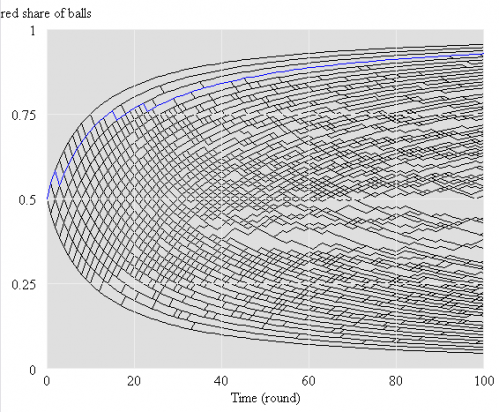
This set of models performs a variant of a Polya urn experiment, along the lines of that described in Bryan Arthur’s Increasing Returns and Path Dependence in the Economy, Chapter 10. There’s a small difference, which is that samples are drawn with replacement (Bernoulli distribution) rather than without (hypergeometric distribution).
The interesting dynamics arise from competing positive feedback loops through the stocks of red and white balls. There’s useful related reading at http://tuvalu.santafe.edu/~wbarthur/Papers/Papers.html
I did the physical version of this experiment with Legos with my kids:
I tried the Polya urns experiment over lunch. We put 5 red and 5 white legos in a bowl, then took turns drawing a sample of 5. We returned the sample to the bowl, plus one lego of whichever color dominated the sample. Iterate. At the start, and after 2 or 3 rounds, I solicited guesses about what would happen. Gratifyingly, the consensus was that the bowl would remain roughly evenly divided between red and white. After a few more rounds, the reality began to diverge, and we stopped when white had a solid 2:1 advantage. I wondered aloud whether using a larger or smaller sample would lead to faster convergence. With no consensus about the answer, we tried it – drawing samples of just 1 lego. I think the experimental outcome was somewhat inconclusive – we quickly reached dominance of red, but the sampling process was much faster, so it may have actually taken more rounds to achieve that. There’s a lot of variation possible in the outcome, which means that superstitious learning is a possible trap.
This model automates the experiment, which makes it easier and more reliable to explore questions like the sensitivity of the rate of divergence to the sample size.
This version works with Vensim PLE (though it’s not supposed to, because it uses the RANDOM BERNOULLI function). It performs a single experiment per run, but includes sensitivity control files for performing hundreds of runs at a time (requires PLE Plus). That makes for a nice map of outcomes:

