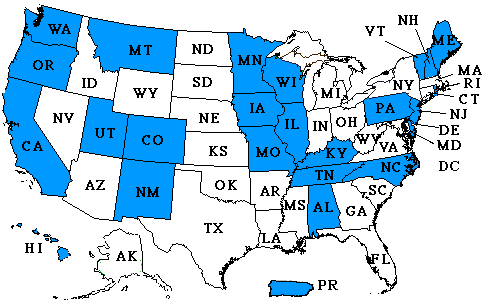
The Pew Climate Center has a roster of international, US federal, and US state & regional climate initiatives. Wikipedia has a list of climate initiatives. The EPA maintains a database of state and regional initiatives, which they’ve summarized on cool maps. The Center for Climate Strategies also has a map of links. All of these give some idea as to what regions are doing, but not always why. I’m more interested in the why, so this post takes a look at the models used in the analyses that back up various proposals.

In a perfect world, the why would start with analysis targeted at identifying options and tradeoffs for society. That analysis would inevitably involve models, due to the complexity of the problem. Then it would fall to politics to determine the what, by choosing among conflicting stakeholder values and benefits, subject to constraints identified by analysis. In practice, the process seems to run backwards: some idea about what to do bubbles up in the political sphere, which then mandates that various agencies implement something, subject to constraints from enabling legislation and other legacies that do not necessarily facilitate the best outcome. As a result, analysis and modeling jumps right to a detailed design phase, without pausing to consider the big picture from the top down. This tendency is somewhat reinforced by the fact that most models available to support analysis are fairly detailed and tactical; that makes them too narrow or too cumbersome to redirect at the broadest questions facing society. There isn’t necessarily anything wrong with the models; they just aren’t suited to the task at hand.
My fear is that the analysis of GHG initiatives will ultimately prove overconstrained and underpowered, and that as a result implementation will ultimately crumble when called upon to make real changes (like California’s ambitious executive order targeting 2050 emissions 80% below 1990 levels). California’s electric power market restructuring debacle jumps to mind. I think underpowered analysis is partly a function of history. Other programs, like emissions markets for SOx, energy efficiency programs, and local regulation of criteria air pollutants have all worked OK in the past. However, these activities have all been marginal, in the sense that they affect only a small fraction of energy costs and a tinier fraction of GDP. Thus they had limited potential to create noticeable unwanted side effects that might lead to damaging economic ripple effects or the undoing of the policy. Given that, it was feasible to proceed by cautious experimentation. Greenhouse gas regulation, if it is to meet ambitious goals, will not be marginal; it will be pervasive and obvious. Analysis budgets of a few million dollars (much less in most regions) seem out of proportion with the multibillion $/year scale of the problem.
One result of the omission of a true top-down design process is that there has been no serious comparison of proposed emissions trading schemes with carbon taxes, though there are many strong substantive arguments in favor of the latter. In California, for example, the CPUC Interim Opinion on Greenhouse Gas Regulatory Strategies states, “We did not seriously consider the carbon tax option in the course of this proceeding, due to the fact that, if such a policy were implemented, it would most likely be imposed on the economy as a whole by ARB.” It’s hard for CARB to consider a tax, because legislation does not authorize it. It’s hard for legislators to enable a tax, because a supermajority is required and it’s generally considered poor form to say the word “tax” out loud. Thus, for better or for worse, a major option is foreclosed at the outset.
With that little rant aside, here’s a survey of some of the modeling activity I’m familiar with:
Continue reading “US Regional Climate Initiatives – Model Roll Call”


