In response to a couple of requests for details, I’ve attached a spreadsheet containing my numbers from the last post on the Danish text: Danish text analysis v3 (updated).
Here it is in words, with a little rounding to simplify:
In 1990, global emissions were about 40 GtCO2eq/year, split equally between developed and developing countries. Due to population disparities, developed emissions per capita were 3.5 times bigger than developing at that point.
The Danish text sets a global target of 50% of 1990 emissions in 2050, which means that the global target is 20 GtCO2eq/year. It also sets a target of 80% (or more) below 1990 for the developed countries, which means their target is 4 GtCO2eq/year. That leaves 16 GtCO2eq/year for the developing world.
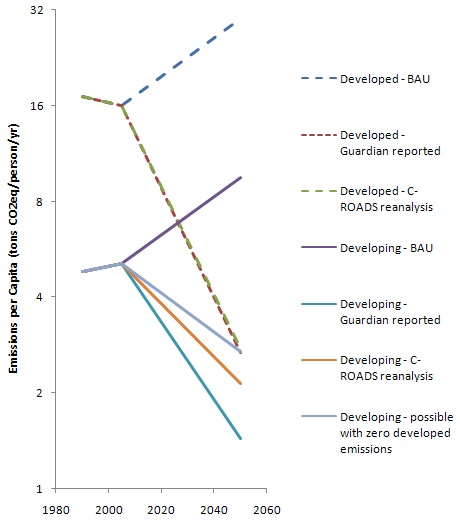
According to the “confidential analysis of the text by developing countries” cited in the Guardian, developed countries are emitting 2.7 tonsCO2eq/person/year in 2050, while developing countries emit about half as much: 1.4 tonsCO2eq/person/year. For the developed countries, that’s in line with what I calculate using C-ROADS data and projections. For the developing countries, to get 16 gigatons per year emissions at 1.4 tons per cap, you need 11 billion people emitting. That’s an addition of 6 billion people between 2005 and 2050, implying a growth rate above recent history and way above UN projections.
If you redo the analysis with a more plausible population forecast, per capita emissions convergence is nearly achieved, with developing country emissions per capita within about 25% of developed.
Note log scale to emphasize proportional differences.

