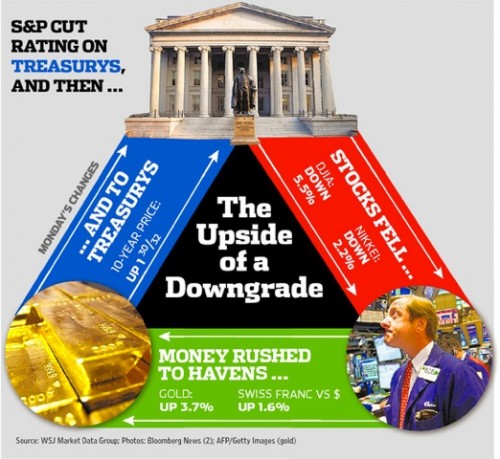
A sort of causal loop diagram made the cover of the WSJ today:
 Source: WSJ h/t Drew Jone
Is it useful, or chartjunk? When I started to look at it from the perspective of good SD diagramming practice, I realized that it’s the latter.
First off, this isn’t really a structural diagram at all. It depicts a sequence of events mixed up with icons depicting some entities involved in those events. From the chain of events, one might infer that there is causality, but that would be hazardous, particularly in this case where there is no operational description of what’s happening. Did money rush to havens because stocks fell, or did stocks fall because money was rushing to havens? How could we tell, without articulating the mechanics of stocks and flows of money in price formation?
A good diagram ought to include quantifiable elements that can vary, with clear directionality. Traders and bars of gold are clearly not helpful variables. Nor are events particularly useful; mental accounting for a “decrease in Stocks Fell” is difficult, for example.
A good diagram should also distinguish key states that describe a system, and distinguish actual states from desired states. Presumably the magnitude and direction of the “money rush to havens” is a function of desired and actual positions in various securities, but we won’t learn much about that from this picture.
Finally, a good diagram ought to give some indication of the polarity of relationships. But what exactly is happening at the top of this diagram, where blue seems to pass to red through the treasury building? Is the diagram arguing that rising treasuries caused falling stocks, so that this is a runaway positive feedback loop? (stock value down, flight to havens, treasuries up, stocks down…). Or are we to be reassured that rising treasuries lower yields, reversing the fall in stocks?
Personally, I preferred the old black & white all-text WSJ.
So far, the comedy coverage of the downgrade is more illuminating than some serious efforts:
