Suppose for the sake of argument that (a) maximizing standardized test scores is what we want teachers to do and (b) Value Added Modeling (VAM) does in fact measure teacher contributions to scores, perhaps with jaw-dropping noise, but at least no systematic bias.
Jaw-dropping noise isn’t as bad as it sounds. Other evaluation methods, like principal evaluations, aren’t necessarily less random, and if anything are more subject to various unknown biases. (Of course, one of those biases might be a desirable preference for learning not captured by standardized tests, but I won’t go there.) Also, other parts of society, like startup businesses, are subjected to jaw-dropping noise via markets, yet the economy still functions.
Further, imagine that we run a district with 1000 teachers, 10% of whom quit in a given year. We can fire teachers at will on the basis of low value added scores. We might not literally fire them; we might just deny them promotions or other benefits, thus encouraging them to leave. We replace teachers by hiring, and get performance given by a standard normal distribution (i.e. performance is an abstract index, ~ N(0,1)). We measure performance each year, with measurement error that’s as large as the variance in performance (i.e., measured VA = true VA + N(0,1)).
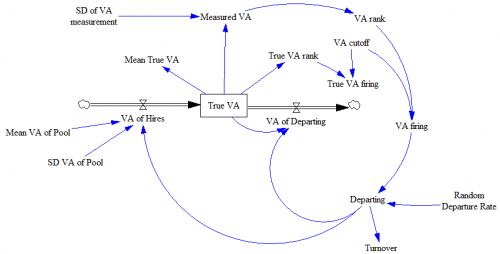 Structure of the system described. Note that this is essentially a discrete event simulation. Rather than a stock of teachers, we have an array of 1000 teacher positions, with each teacher represented by a performance score (“True VA”).
With such high noise, does VAM still work? The short answer is yes, if you don’t mind the side effects, and live in an open system.
If teachers depart at random, average performance across the district will be distributed N(0,.03); the large population of teachers smooths the noise inherited from the hiring process. Suppose, on top of that, that we begin to cull the bottom-scoring 5% of teachers each year. 5% doesn’t sound like a lot, but it probably is. For example, you’d have to hold a tenure review (or whatever) every 4 years and cut one in 5 teachers. Natural turnover probably isn’t really as high as 10%, but even so, this policy would imply a 50% increase in hiring to replace the greater outflow. Then suppose we can increase the accuracy of measurement from N(0,1) to N(0,0.5).
What happens to performance? It goes up quite a bit:
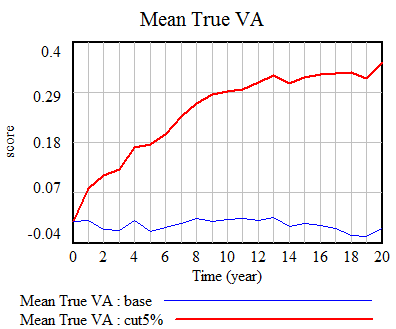
In our scenario (red), the true VA of teachers in the district goes up by about .35 standard deviations eventually. Note the eventually: quality is a stock, and it takes time to fill it up to a new equilibrium level. Initially, it’s easy to improve performance, because there’s low-hanging fruit – the bottom 5% of teachers is solidly poor in performance. But as performance improves, there are fewer poor performers, and it’s tougher to replace them with better new hires.
Surprisingly, doubling the accuracy of measurements (green) or making them perfect (gray) doesn’t increase performance much further. On the other hand, if noise exceeds the signal, ~N(0,5), performance is no longer increased much (black):
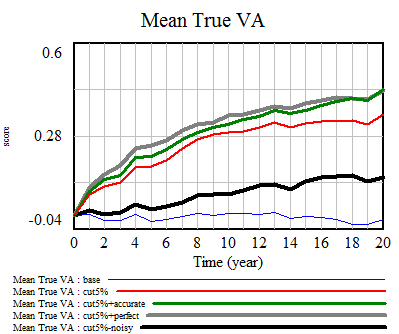
Extreme noise defeats the selection process, because firing becomes essentially random. There’s no expectation that a randomly-fired teacher can be replaced with a better randomly-hired teacher.
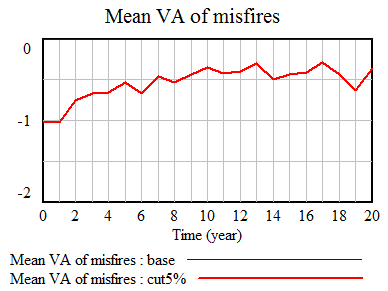
While aggregate performance goes up in spite of a noisy measurement process, the cost is a high chance of erroneously firing teachers, because their measured performance is in the bottom 5%, but their true performance is not. This is akin to the fundamental tradeoff between Type I and Type II errors in statistics. In our scenario (red), the error rate is about 70%, i.e. 70% of teachers fired aren’t truly in the bottom 5%:
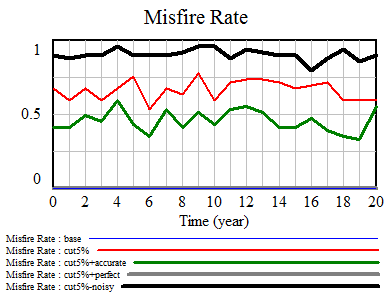
This means that, while evaluation errors come out in the wash at the district system level, they fall rather heavily on individuals. It’s not quite as bad as it seems, though. While a high fraction of teachers fired aren’t really in the bottom 5%, they’re still solidly below average. However, as aggregate performance rises, the false-positive firings get worse, and firings increasingly involve teachers near the middle of the population in performance terms:
Next post: why all of this this is limited by feedback.

1 thought on “Dynamics of teacher value added”