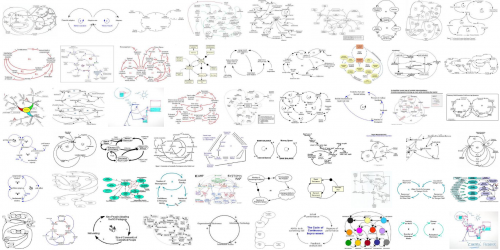
The new layout of google image searches makes quite a nice visual when you point it at causal loop diagram:
 Click through for the really big version.
While I’m at it, here’s an interesting link on the structure of earth system models.
The new layout of google image searches makes quite a nice visual when you point it at causal loop diagram:
 Click through for the really big version.
While I’m at it, here’s an interesting link on the structure of earth system models.
Hi Tom,
I was wondering if you knew of any software that can be used to generate causal loop diagrams – particularly interested in the CLD format rather than the stock-flow diagram format, e.g. like Foresight/Shiftn’s obesity systems/causal loop diagram (see http://www.shiftn.com/obesity/Full-Map.html ). Thanks!
I use Vensim for CLDs. It’s not as visually refined as your link, but it’s fairly fast and does have + and – tags for arrows, delay indicators, etc. There are actually two ways to do it – you can build a model without defining any equations, or use the comment fields (with “no cause” and “arrow junction” checked) if you want to have some redundancy in naming (i.e. use a name twice on the same screen without displaying as a shadow variable).
You could prototype something in Vensim, then export to ppt or whatever to edit the vector graphics.
I’ve looked at a lot of mindmapping and process diagramming tools and not found a good alternative. If you run across anything I’d be interested to hear about it here.