Found on the packing list for a computer part I just received:
Proudly Picked by UPLGLHOA
Proudly Verified by UPLGPBIEL

Don't just do something, stand there! Reflections on the counterintuitive behavior of complex systems, seen through the eyes of System Dynamics, Systems Thinking and simulation.
That’s the title of a post today at The Progressive Economics Forum, introducing a new report from the Canadian Centre for Policy Alternatives.
The bottom line:
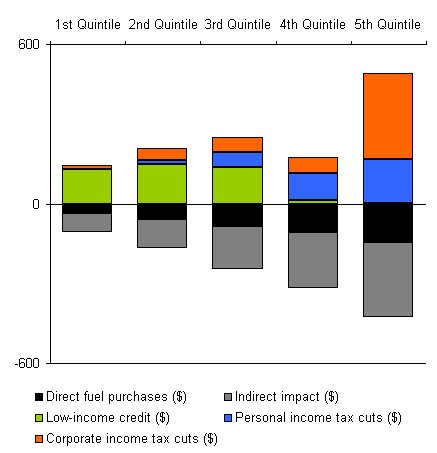
In this study, we model the distribution of BC’s carbon tax and recycling measures. Our results conirm that BC’s carbon tax, in and of itself, is regressive. However, the overall carbon tax and recycling framework is modestly progressive in 2008/09 ’” that is, low-income families get back more in credits, on average, than they pay in carbon taxes. If the low-income credit is not expanded, however, the regime will shift to become regressive by 2010/11. It is important for policy makers to rectify this situation in the 2009 and future budgets by minimally ensuring that the credit grows in line with the carbon tax.
A related problem:
A second concern with the carbon tax regime is that tax cuts undermine a progressive outcome at the top of the income scale. In 2008/09, personal and corporate income tax cuts lead to an average net gain for the top 20% of households that is larger in dollar terms than for the bottom 40%.
I plotted the results in the report’s tables to show some of these effects. In 2009, the lowest income groups (quintiles 1-3) come out a little ahead, but the 4th quintile faces a net loss, while the top income group is overcompensated by the corporate tax cut:
Via Economist’s View, Kotlikoff and Leamer suggest in the FT Economists’ Forum that we need a national holiday sale to fix the economy:
The same defensive mentality that allowed the sale of equities at fire sale prices threatens to cause a sharp drop in consumer spending, which accounts for 72 per cent of US GDP. If this happens, the economy will slide into deep recession.
We need to put a halt to self-fulfilling prophecies of doom. The key is realising that recessions are usually consumer cycles, not business cycles. They’re driven by weakening demand first for homes, then for consumer durables, and finally for non-durables and services. As consumers stop spending, businesses stop investing, and the economy ‘recedes’.A better way to spur consumer spending is for Uncle Sam to run a six-month national sale by having a) state governments suspend their sales taxes and b) the federal government make up the lost state sales revenues. The national sale could be implemented immediately.
…
Here’s how it would work. Uncle Sam would pay each state a fixed percentage ’“ say 5 per cent – of the 2007 consumption of its residents. States would be required to reduce their retail sales tax rates by enough to generate a six-month revenue loss (calculated using 2007 data) equal to the amount they’ll receive from Uncle Sam.For states with low or zero sales tax rates, implementing this policy requires making their sales tax rates negative, ie subsidising purchases. Shoppers would see a negative tax on their sales receipts, lowering their outlays. State governments would reimburse businesses for paying the subsidy and, in turn, be reimbursed by the Feds.
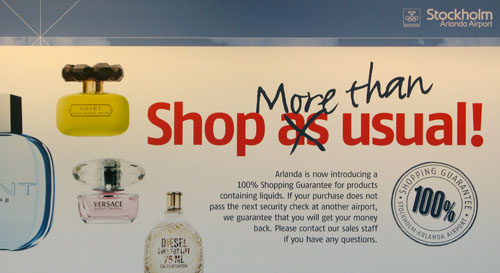
But wait, wouldn’t that accelerate the Shopocalypse?
Update: More seriously, isn’t this a terrible policy from an income distribution standpoint? It gives vastly different rewards to citizens with different consumption patterns. And how will states that don’t have a sales tax implement a negative one, without the reporting infrastructure to do so?
A great example of policy undone by feedback, from Paul Krugman’s column, The Widening Gyre:
The really shocking thing, however, is the way the crisis is spreading to emerging markets ’” countries like Russia, Korea and Brazil.
These countries were at the core of the last global financial crisis, in the late 1990s (which seemed like a big deal at the time, but was a day at the beach compared with what we’re going through now). They responded to that experience by building up huge war chests of dollars and euros, which were supposed to protect them in the event of any future emergency. And not long ago everyone was talking about ‘decoupling,’ the supposed ability of emerging market economies to keep growing even if the United States fell into recession. ‘Decoupling is no myth,’ The Economist assured its readers back in March. ‘Indeed, it may yet save the world economy.’
That was then. Now the emerging markets are in big trouble. In fact, says Stephen Jen, the chief currency economist at Morgan Stanley, the ‘hard landing’ in emerging markets may become the ‘second epicenter’ of the global crisis. (U.S. financial markets were the first.)
What happened? In the 1990s, emerging market governments were vulnerable because they had made a habit of borrowing abroad; when the inflow of dollars dried up, they were pushed to the brink. Since then they have been careful to borrow mainly in domestic markets, while building up lots of dollar reserves. But all their caution was undone by the private sector’s obliviousness to risk.
In Russia, for example, banks and corporations rushed to borrow abroad, because dollar interest rates were lower than ruble rates. So while the Russian government was accumulating an impressive hoard of foreign exchange, Russian corporations and banks were running up equally impressive foreign debts. Now their credit lines have been cut off, and they’re in desperate straits.
The unstated closure to the loop is that emerging market governments’ borrowing in domestic markets and hoarding of foreign exchange were likely a cause of higher domestic rate spreads over dollar rates, and thus contributed to the undoing of the policy by driving other borrowing abroad.
John Sterman’s new Policy Forum in Science should be required reading. An excerpt:
The strong scientific consensus on the causes and risks of climate change stands in stark contrast to widespread confusion and complacency among the public. Why does this gulf exist, and why does it matter? Policies to manage complex natural and technical systems should be based on the best available scientific knowledge, and the Intergovernmental Panel on Climate Change (IPCC) provides rigorously vetted information to policy-makers. In democracies, however, the beliefs of the public, not only those of experts, affect government policy.
Effective risk communication is grounded in deep understanding of the mental models of policy-makers and citizens. What, then, are the principal mental models shaping people’s beliefs about climate change? Studies show an apparent contradiction: Majorities in the United States and other nations have heard of climate change and say they support action to address it, yet climate change ranks far behind the economy, war, and terrorism among people’s greatest concerns, and large majorities oppose policies that would cut greenhouse gas (GHG) emissions by raising fossil fuel prices.
More telling, a 2007 survey found a majority of U.S. respondents (54%) advocated a “wait-and-see” or “go slow” approach to emissions reductions. Larger majorities favored wait-and-see or go slow in Russia, China, and India. For most people, uncertainty about the risks of climate change means costly actions to reduce emissions should be deferred; if climate change begins to harm the economy, mitigation policies can then be implemented. However, long delays in the climate’s response to anthropogenic forcing mean such reasoning is erroneous.
Wait-and-see works well in simple systems with short lags. We can wait until the teakettle whistles before removing it from the flame because there is little lag between the boil, the whistle, and our response. Similarly, wait-and-see would be a prudent response to climate change if there were short delays in the response of the climate system to intervention. However, there are substantial delays in every link of a long causal chain stretching from the implementation of emissions abatement policies to emissions reductions to changes in atmospheric GHG concentrations to surface warming to changes in ice sheets, sea level, agricultural productivity, extinction rates, and other impacts. Mitigating the risks therefore requires emissions reductions long before additional harm is evident. Wait-and-see policies implicitly presume the climate is roughly a first-order linear system with a short time constant, rather than a complex dynamical system with long delays, multiple positive feedbacks, and nonlinearities that may cause abrupt, costly, and irreversible regime changes.
More good stuff from my blog reader:
Real Time Economics – Secondary Sources: Rebutting Myths, King on Stability, Green Econ & Secondary Sources: Rates, Innovation, Recession, Suprime Lending
Greg Mankiw – More Commentary on the Financial Mess
Economist’s View – links for 2008-10-23 &Â links for 2008-10-22
Marginal Revolution – Four myths of the credit crisis, again
Econbrowser – More Unhappy Numbers
Jay Forrester writes on the SD email list:
First, the current crisis did not start with the burst housing bubble. It started with the excessive credit that led to the housing bubble. That excess credit resulted from the Federal Reserve holding down interest rates to less than the inflation rate in housing. This negative real interest rate (bank interest minus inflation in the housing assets) produced a powerful incentive for investment and speculation in housing. And the action of the Federal Reserve, with the increase in risk taking by banks, were a result of pressure from Congress and the public who were all enjoying the short-term rise in housing prices.
We see here one of the characteristics of a complex social system in which a policy that is good in the short run is almost always bad in the long run. Feeding the bubble with easy credit was popular in the short run but now we have the consequent day of reckoning with the collapse of the financial system.
With oil back at $70, I got curious how Hotelling is holding up. The observation that resource prices ought to rise at the interest rate is looking almost plausible now, if you squint, whereas it looked rather foolish for most of the 80s and 90s. Of course, the actual production trajectory has nothing to do with Hotelling’s simple model, which produces a monotonic decline. The basic problem with Hotelling, as I see it, is that there’s a difference between equilibrium and expectations subject to uncertainty. Moreover the extraction trajectory is largely controlled by the rate at which governments lease or otherwise exploit resources, and governments have more than the usual dose of bounded rationality. (I got interested in this because I’ve been investigating Montana’s management of mineral rights on its school trust lands. So far, the state’s exercise of its fiduciary responsibility looks suspiciously like a corporate welfare program. More on that another time.)
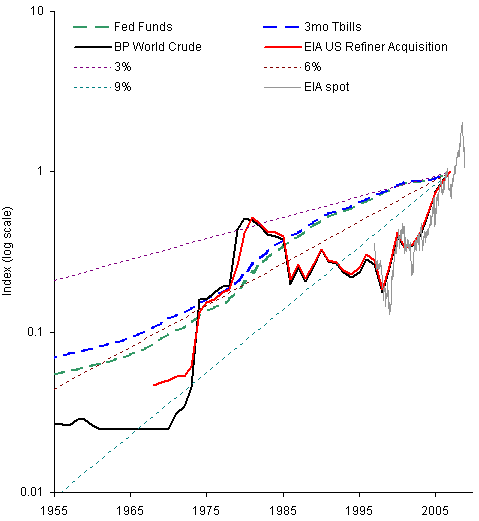
The figure compares the nominal oil price trajectory to actual risk-free rates (3month T-bills and the federal funds rate), as well as three constant rates for good measure. At those rates, one would have to conclude that a large risk premium must apply to oil production, or that there’s been an awful lot of uneconomic production over the years (for example, everything from about 1986 to 2006), or that current prices are just a blip and will continue to revert to some more moderate long-term level.