Will the real emissions target please stand up?

cop15_8_1_650

The post-Copenhagen climate negotiations seem to be diverging, at least on the question of targets. Brackets, denoting disagreement, have if anything proliferated in the draft texts. The latest from Bonn:

AD HOC WORKING GROUP ON LONG-TERM COOPERATIVE ACTION UNDER THE CONVENTION

Eleventh session Bonn, 2–6 August 2010

Item 3 of the provisional agenda Preparation of an outcome to be presented to the Conference of the Parties for adoption at its sixteenth session to enable full, effective and sustained implementation of the Convention through long-term cooperative action now, up to and beyond 2012

Text to facilitate negotiations among Parties

4. Parties should collectively reduce global emissions by [50][85][95] per cent from 1990 levels by 2050 and should ensure that global emissions continue to decline thereafter. Developed country Parties as a group should reduce their greenhouse gas emissions by [[75-85][at least 80-95][more than 95] per cent from 1990 levels by 2050] [more than 100 per cent from 1990 levels by 2040].

18. These commitments are made with a view to reducing the aggregate greenhouse gas emissions of developed country Parties by [at least] [25–40] [in the order of 30] [40] [45] [50] [X* per cent from [1990] [or 2005] levels by [2017][2020] [and by [at least] [YY] per cent by 2050 from the [1990] [ZZ] level].

Hat tip: Travis Franck.

The RGGI budget raid and cap & trade credibility

I haven’t been watching the Regional Greenhouse Gas Initiative very closely, but some questions from a colleague prompted me to do a little sniffing around. I happened to run across this item:

Warnings realized in RGGI budget raid

The Business and Industry Association of New Hampshire was not surprised that the Legislature on Wednesday took $3.1 million in Regional Greenhouse Gas Initiative funds to help balance the state budget.

“We warned everybody two years ago that this is a big pot of money that is ripe for the plucking, and that’s exactly what happened,” said David Juvet, the organization’s vice president.

Indeed, the raid happened without any real debate at all. In fact, the only other RGGI-related proposal – backed by Republicans – was to take even more money from the fund.

… New York state lawmakers grabbed $90 million in RGGI funds last December. Shortly afterwards, New Jersey followed suit taking $65 million in the last budget year. And “the governor left the door wide open for next year. They are taking it all,” said Matt Elliott of Environment New Jersey. …

This is a problem because it confirms the talking point of “cap & tax” opponents, that emissions revenue streams will be commandeered for government largesse. There is a simple solution, I think, which is to redistribute the proceeds transparently, so that it’s obvious that a raid on revenues is a raid on pocketbooks. The BC carbon tax did that initially, though it’s apparently falling off the wagon.

R&D – crack for techno-optimists

I like R&D. Heck, I basically do R&D. But the common argument, that people won’t do anything hard to mitigate emissions or reduce energy use, so we need lots of R&D to find solutions, strikes me as delusional.

The latest example to cross my desk (via the NYT) is the new American Energy Innovation Council’s recommendations,

Create an independent national energy strategy board.
Invest $16 billion per year in clean energy innovation.
Create Centers of Excellence with strong domain expertise.
Fund ARPA-E at $1 billion per year.
Establish and fund a New Energy Challenge Program to build large-scale pilot projects.

Let’s look at the meat of this – $16 billion per year in energy innovation funding. Historic funding looks like this:
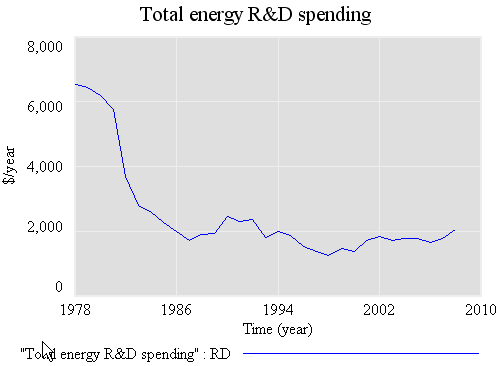
R&D funding

Total public energy R&D, compiled from Gallagher, K.S., Sagar, A, Segal, D, de Sa, P, and John P. Holdren, “DOE Budget Authority for Energy Research, Development, and Demonstration Database,” Energy Technology Innovation Project, John F. Kennedy School of Government, Harvard University, 2007. I have a longer series somewhere, but no time to dig it up. Basically, spending was negligible (or not separately accounted for) before WWII, and ramped up rapidly after 1973.

The data above reflects public R&D; when you consider private spending, the jump to $16 billion represents maybe a factor of 3 or 4 increase. What does that do for you?

Consider a typical model of technical progress, the two-factor learning curve:

cost = (cumulative R&D)^A*(cumulative experience)^B

The A factor represents improvement from deliberate R&D, while the B factor reflects improvement from production experience like construction and installation of wind turbines. A and B are often expressed as learning rates, the multiple on cost that occurs per doubling of the relevant cumulative input. In other words, A,B = ln(learning rate)/ln(2). Typical learning rates reported are .6 to .95, or cost reductions of 40% to 5% per doubling, corresponding with A/B values of -.7 to -.15, respectively. Most learning rate estimates are on the high end (smaller reductions per doubling), particularly when the two-factor function is used (as opposed to just one component).

Let’s simplify so that

cost = (cumulative R&D)^A

and use an aggressive R&D learning rate (.7), for A=-0.5. In steady state, with R&D growing at the growth rate of the economy (call it g), cost falls at the rate A*g (because the integral of exponentially growing spending grows at the same rate, and exp(g*t)^A = exp(A*g*t)).

That’s insight number one: a change in R&D allocation has no effect on the steady-state rate of progress in cost. Obviously one could formulate alternative models of technology where that is not true, but compelling argument for this sort of relationship is that the per capita growth rate of GDP has been steady for over 250 years. A technology model with a stronger steady-state spending->cost relationship would grow super-exponentially.

Insight number two is what the multiple in spending (call it M) does get you: a shift in the steady-state growth trajectory to a new, lower-cost path, by M^A. So, for our aggressive parameter, a multiple of 4 as proposed reduces steady-state costs by a factor of about 2. That’s good, but not good enough to make solar compatible with baseload coal electric power soon.

Given historic cumulative public R&D, 3%/year baseline growth in spending, a 0.8 learning rate (a little less aggressive), a quadrupling of R&D spending today produces cost improvements like this:
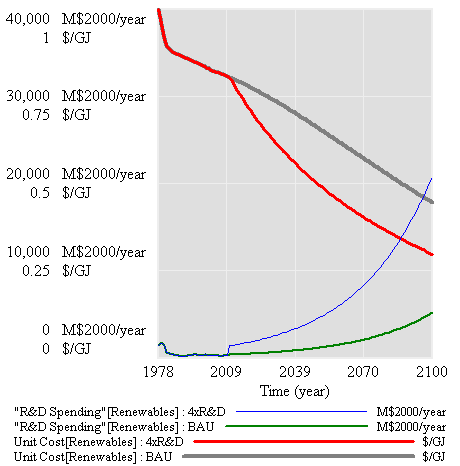
R&D future 4x

Those are helpful, but not radical. In addition, even if R&D produces something more miraculous than it has historically, there are still big nontechnical lock-in humps to overcome (infrastructure, habits, …). Overcoming those humps is a matter of deployment more than research. The Energy Innovation Council is definitely enthusiastic about deployment, but without internalizing the externalities associated with energy production and use, how is that going to work? You’d either need someone to pick winners and implement them with a mishmash of credits and subsidies, or you’d have to hope for/wait for cleantech solutions to exceed the performance of conventional alternatives.

The latter approach is the “stone age didn’t end because we ran out of stones” argument. It says that cleantech (iron) will only beat conventional (stone) when it’s unequivocally better, not just for the environment, but also convenience, cost, etc. What does that say about the prospects for CCS, which is inherently (thermodynamically) inferior to combustion without capture? The reality is that cleantech is already better, if you account for the social costs associated with energy. If people aren’t willing to internalize those social costs, so be it, but let’s not pretend we’re sure that there’s a magic technical bullet that will yield a good outcome in spite of the resulting perverse incentives.

Gallagher, K.S., Sagar, A, Segal, D, de Sa, P, and John P. Holdren, “DOE Budget Authority for Energy Research, Development, and Demonstration Database,” Energy Technology Innovation Project, John F. Kennedy School of Government, Harvard University, 2007.

A modest proposal for the IPCC

Make it shorter. The Fifth Assessment, that is.

There’s a fairly endless list of suggestions for ways to amend IPCC processes, plus an endless debate over mostly-miniscule improprieties and errors buried in the depths of the report, fueled by the climategate emails.

I find the depth of the report useful personally, but I’m an outlier – how much is really needed? Do any policy makers really read 3000 pages of stuff, every 5 years?

Maybe the better part of valor would be to agree on a page limit – perhaps 350 per working group (the size of the 1990 report), and relegate all the more granular material to a wiki-like lit review and live summary, that could evolve more fluidly.

A shorter report would be easier to edit and read, and less likely to devote ink to details that are fundamentally very uncertain.

DICE

This is a replication of William Nordhaus’ original DICE model, as described in Managing the Global Commons and a 1992 Science article and Cowles Foundation working paper that preceded it.

There are many good things about this model, but also some bad. If you are thinking of using it as a platform for expansion, read my dissertation first.

Units balance.

I provide several versions:

  1. Model with simple heuristics replacing the time-vector decisions in the original; runs in Vensim PLE
  2. Full model, with decisions implemented as vectors of points over time; requires Vensim Pro or DSS
  3. Same as #2, but with VECTOR LOOKUP replaced with VECTOR ELM MAP; supports earlier versions of Pro or DSS
    • DICE-vec-6-elm.mdl (you’ll also want a copy of DICE-vec-6.vpm above, so that you can extract the supporting optimization control files)

Note that there may be minor variances from the published versions, e.g. that transversality coefficients for the state variables (i.e. terminal values of the states for optimization) are not included. The optimizations use fewer time decision points than the original GAMS equivalents. These do not have any significant effect on the outcome.

Workshop on Modularity and Integration of Climate Models

The MIT Center for Collective Intelligence is organizing a workshop at this year’s Conference on Computational Sustainability entitled “Modularity and Integration of Climate Models.” Check out the  Agenda.

Traditionally, computational models designed to simulate climate change and its associated impacts (climate science models, integrated assessment models, and climate economics models) have been developed as standalone entities. This limits possibilities for collaboration between independent researchers focused on sub-­?problems, and is a barrier to more rapid advances in climate modeling science because work is not distributed effectively across the community. The architecture of these models also precludes running a model with modular sub -­? components located on different physical hardware across a network.

In this workshop, we hope to examine the possibility for widespread development of climate model components that may be developed independently and coupled together at runtime in a “plug and play” fashion. Work on climate models and modeling frameworks that are more modular has begun, (e.g. Kim, et al., 2006) and substantial progress has been made in creating open data standards for climate science models, but many challenges remain.

A goal of this workshop is to characterize issues like these more precisely, and to brainstorm about approaches to addressing them. Another desirable outcome of this workshop is the creation of an informal working group that is interested in promoting more modular climate model development.

C-ROADS & climate leadership workshop

In Boston, Oct. 18-20, Climate Interactive and Seed Systems will be running a workshop on C-ROADS and climate leadership.

Attend to develop your capacities in:

  • Systems thinking: Causal loop and stock-flow diagramming.
  • Leadership and learning: Vision, reflective conversation, consensus building.
  • Computer simulation: Using and leading policy-testing with the C-ROADS/C-Learn simulation.
  • Policy savvy:  Attendees will play the “World Climate” exercise.
  • Climate, energy, and sustainability strategy: Reflections and insights from international experts.
  • Business success stories: What’s working in the new low Carbon Economy and implications for you.
  • Build your network of people sharing your aspirations for Climate progress.

Save the date.

Independence of models and errors


Roger Pielke’s blog has an interesting guest post by Ryan Meyer, reporting on a paper that questions the meaning of claims about the robustness of conclusions from multiple models. From the abstract:

Climate modelers often use agreement among multiple general circulation models (GCMs) as a source of confidence in the accuracy of model projections. However, the significance of model agreement depends on how independent the models are from one another. The climate science literature does not address this. GCMs are independent of, and interdependent on one another, in different ways and degrees. Addressing the issue of model independence is crucial in explaining why agreement between models should boost confidence that their results have basis in reality.

Later in the paper, they outline the philosophy as follows,

In a rough survey of the contents of six leading climate journals since 1990, we found 118 articles in which the authors relied on the concept of agreement between models to inspire confidence in their results. The implied logic seems intuitive: if multiple models agree on a projection, the result is more likely to be correct than if the result comes from only one model, or if many models disagree. … this logic only holds if the models under consideration are independent from one another. … using multiple models to analyze the same system is a ‘‘robustness’’ strategy. Every model has its own assumptions and simplifications that make it literally false in the sense that the modeler knows that his or her mathematics do not describe the world with strict accuracy. When multiple independent models agree, however, their shared conclusion is more likely to be true.

I think they’re barking up the right tree, but one important clarification is in order. We don’t actually care about the independence of models per se. In fact, if we had an ensemble of perfect models, they’d necessarily be identical. What we really want is for the models to be right. To the extent that we can’t be right, we’d at least like to have independent systematic errors, so that (a) there’s some chance that mistakes average out and (b) there’s an opportunity to diagnose the differences.

For example, consider three models of gravity, of the form F=G*m1*m2/r^b. We’d prefer an ensemble of models with b = {1.9,2.0,2.1} to one with b = {1,2,3}, even though some metrics of independence (such as the state space divergence cited in the paper) would indicate that the first ensemble is less independent than the second. This means that there’s a tradeoff: if b is a hidden parameter, it’s harder to discover problems with the narrow ensemble, but harder to get good answers out of the dispersed ensemble, because its members are more wrong.

For climate models, ensembles provide some opportunity to discover systematic errors from numerical schemes, parameterization of poorly-understood sub-grid scale phenomena and program bugs, to the extent that models rely on different codes and approaches. As in my gravity example, differences would be revealed more readily by large perturbations, but I’ve never seen extreme conditions tests on GCMs (although I understand that they at least share a lot with models used to simulate other planets). I’d like to see more of that, plus an inventory of major subsystems of GCMs, and the extent to which they use different codes.

While GCMs are essentially the only source of regional predictions, which are a focus of the paper, it’s important to realize that GCMs are not the only evidence for the notion that climate sensitivity is nontrivial. For that, there are also simple energy balance models and paleoclimate data. That means that there are at least three lines of evidence, much more independent than GCM ensembles, backing up the idea that greenhouse gases matter.

It’s interesting that this critique comes up with reference to GCMs, because it’s actually not GCMs we should worry most about. For climate models, there are vague worries about systematic errors in cloud parameterization and other phenomena, but there’s no strong a priori reason, other than Murphy’s Law, to think that they are a problem. Economic models in the climate policy space, on the other hand, nearly all embody notions of economic equilibrium and foresight which we can be pretty certain are wrong, perhaps spectacularly so. That’s what we should be worrying about.

Other bathtubs – capital

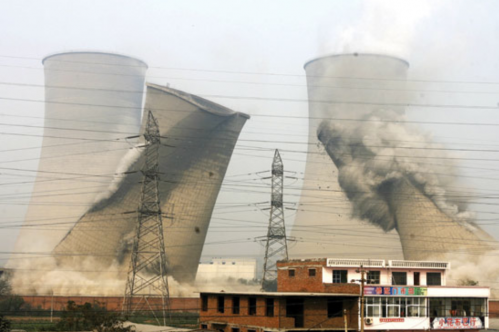
China is rapidly eliminating old coal generating capacity, according to Technology Review.

Draining Bathtub

Coal still meets 70 percent of China’s energy needs, but the country claims to have shut down 60 gigawatts’ worth of inefficient coal-fired plants since 2005. Among them is the one shown above, which was demolished in Henan province last year. China is also poised to take the lead in deploying carbon capture and storage (CCS) technology on a large scale. The gasifiers that China uses to turn coal into chemicals and fuel emit a pure stream of carbon dioxide that is cheap to capture, providing “an excellent opportunity to move CCS forward globally,” says Sarah Forbes of the World Resources Institute in Washington, DC.

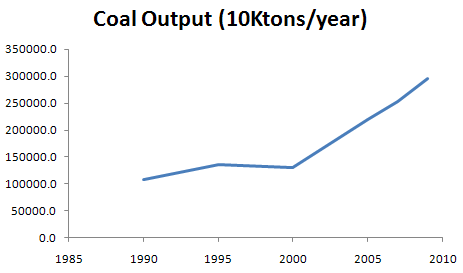
That’s laudable. However, the inflow of new coal capacity must be even greater. Here’s the latest on China’s coal output:

ChinaCoalOutput

China Statistical Yearbook 2009 & 2009 main statistical data update

That’s just a hair short of 3 billion tons in 2009, with 8%/yr growth from ’07-’09, in spite of the recession. On a per capita basis, US output and consumption is still higher, but at those staggering growth rates, it won’t take China long to catch up.

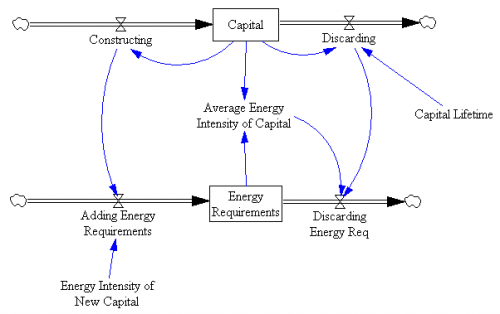
A simple model of capital turnover involves two parallel bathtubs, a “coflow” in SD lingo:

CapitalTurnover

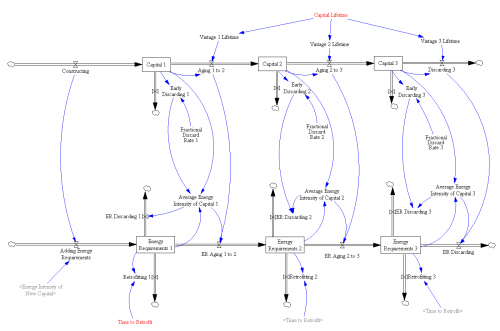
Every time you build some capital, you also commit to the energy needed to run it (unless you don’t run it, in which case why build it?). If you get fancy, you can consider 3rd order vintaging and retrofits, as here:

Capital Turnover 3o

To get fancier still, see the structure in John Sterman’s thesis, which provides for limited retrofit potential (that Gremlin just isn’t going to be a Prius, no matter what you do to the carburetor).

The basic challenge is that, while it helps to retire old dirty capital quickly (increasing the outflow from the energy requirements bathtub), energy requirements will go up as long as the inflow of new requirements is larger, which is likely when capital itself is growing and the energy intensity of new capital is well above zero. In addition, when capital is growing rapidly, there just isn’t much old stuff around (proportionally) to throw away, because the age structure of capital will be biased toward new vintages.

Hat tip: Travis Franck

EPA gets the bathtub

Eli Rabett has been posting the comment/response section of the EPA endangerment finding. For the most part the comments are a quagmire of tinfoil-hat pseudoscience; I’m astonished that the EPA could find some real scientists who could stomach wading through and debunking it all – an important but thankless job.

Today’s installment tackles the atmospheric half life of CO2:

A common analogy used for CO2 concentrations is water in a bathtub. If the drain and the spigot are both large and perfectly balanced, then the time than any individual water molecule spends in the bathtub is short. But if a cup of water is added to the bathtub, the change in volume in the bathtub will persist even when all the water molecules originally from that cup have flowed out the drain. This is not a perfect analogy: in the case of CO2, there are several linked bathtubs, and the increased pressure of water in one bathtub from an extra cup will actually lead to a small increase in flow through the drain, so eventually the cup of water will be spread throughout the bathtubs leading to a small increase in each, but the point remains that the “residence time” of a molecule of water will be very different from the “adjustment time” of the bathtub as a whole.

Having tested a lot of low-order carbon cycle models, including I think all possible linear variants up to 3rd order, I agree with EPA – anyone who claims that the effective half life or time constant of CO2 uptake is 10 or 20 or even 50 years is bonkers.