Montana's climate future

A selection of data and projections on past and future climate in Montana:

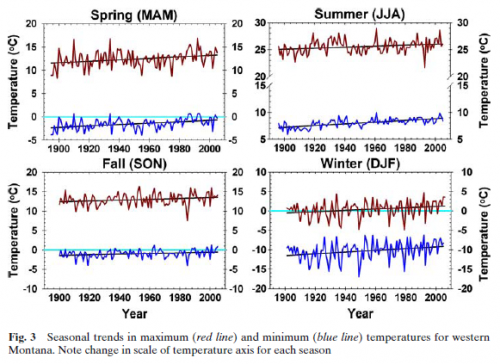
Temperature Trends Western MT

Pederson et al. (2010) A century of climate and ecosystem change in Western Montana: what do temperature trends portend? Climatic Change 98:133-154. It’s hard to read precisely off the graph, but there have been significant increases in maximum and minimum temperatures, with the greatest increases in the minimums and in winter – exactly what you’d expect from a change in radiative properties. As a result the daily temperature range has shrunk slightly and there are fewer below freezing and below zero days. That last metric is critical, because it’s the severe cold that controls many forest pests. There’s much more on this in a poster.

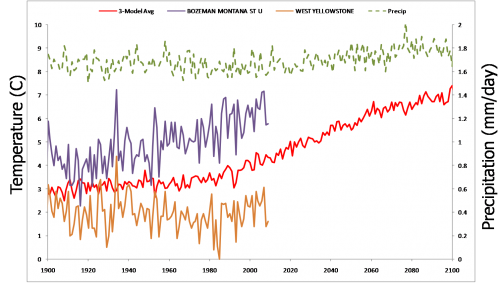
Model Futures

Not every station shows a trend – the figure above contrasts Bozeman (purple, strong trend) with West Yellowstone (orange, flat). The Bozeman trend is probably not an urban heat island effect – surfacestations.org thinks it’s a good site, and White Sulphur (a nice sleepy town up the road a piece) is about the same. The red line is an ensemble of  simulations (GISS, CCSM & ECHAM5) from climexp.knmi.nl, projected into the future with A1B forcings (i.e., a fairly high emissions trajectory). I interpolated the data to latitude 47.6, longitude -110.9 (roughly my house, near Bozeman). Simulated temperature rises about 4C, while precipitation (green) is almost unmoved. If that came true, Montana’s future climate might be a lot like current central Utah.

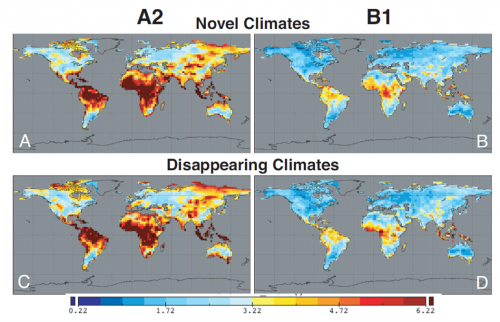
NovelDisappearingClimates

The figure above – from John W. Williams, Stephen T. Jackson, and John E. Kutzbach. Projected distributions of novel and disappearing climates by 2100 AD. PNAS, vol. 104 no. 14 – shows global grid points that have no neighbors within 500km that now have a climate like what the future might bring. In panel C (disappearing climates with the high emissions A2 scenario), there’s a hotspot right over Montana. Presumably that’s loss of today’s high altitude ecosystems. As it warms up, climate zones move uphill, but at the top of mountains there’s nowhere to go. That’s why pikas may be in trouble.

pika

MT Field Guide

Sea Level Roundup

Realclimate has Martin Vermeer’s reflections on the making of his recent sea level paper with Stefan Rahmstorf. At some point I hope to post a replication of that study, in a model with the Grinsted and Rahmstorf 2007 structures, but I haven’t managed to replicate it yet. The problem may be that I haven’t yet tackled the reservoir storage issue.

At Nature Reports, Olive Heffernan introduces several sea level articles. Rahmstorf contrasts the recent set of semi-empirical models, predicting sea level of a meter or more this century, with the AR4 finding. Lowe and Gregory wonder if the semi-empirical models are really seeing enough of the dynamic ice signal to have predictive power, and worry about overadaptation to high scenarios. Mark Schrope reports on underadaptation – vulnerable developments in Florida. Mason Inman reports on ecological engineering, a softer approach to coastal defense.

Who eats the risk?

From the Asilomar geoengineering conference, via WorldChanging:

Lesson two: Nobody has any clear idea how to resolve the inequalities inherent in geoengineering. One of the most quoted remarks at the conference came from Pablo Suarez, the associate director of programs with the Red Cross/Red Crescent Climate Centre, who asked during one plenary session, “Who eats the risk?” In Suarez’s view, geoengineering is all about shifting the risk of global warming from rich nations — i.e., those who can afford the technologies to manipulate the climate — to poor nations. Suarez admitted that one way to resolve this might be for rich nations to pay poor nations for the damage caused by, say, shifting precipitation patterns. But that conjured up visions of Bangladeshi farmers suing Chinese geoengineers for ruining their rice crop — a legalistic can of worms that nobody was willing to openly explore.

If geoengineering is a for-profit operation, it presumably also involves the public bearing the risk of private acts, because investors aren’t likely to have an appetite for the essentially unlimited liability.

The lure of border carbon adjustments

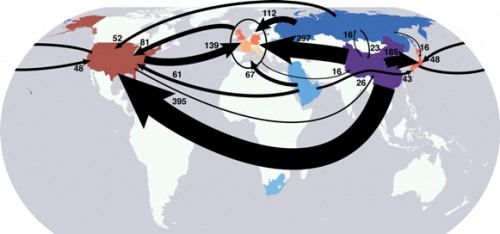
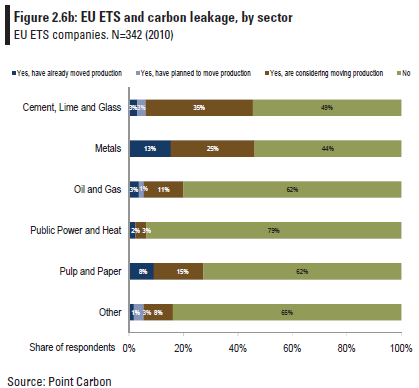
Are border carbon adjustments (BCAs) the wave of the future? Consider these two figures:

Carbon flows embodied in trade goods

Leakage

The first shows the scale of carbon embodied in trade. The second, even if it overstates true intentions, demonstrates the threat of carbon outsourcing. Both are compelling arguments for border adjustments (i.e. tariffs) on GHG emissions.

I think things could easily go this route: it’s essentially a noncooperative route to a harmonized global carbon price. Unlike global emissions trading, it’s not driven by any principle of fair allocation of property rights in the atmosphere; instead it serves the more vulgar notion that everyone (or at least every nation) keeps their own money.

Consider the pros and cons:

Advocates of BCAs claim that the measures are intended to address three factors. First, competitiveness concerns where some industries in developed countries consider that a BCA will protect their global competitiveness vis-a-vis industries in countries that do not apply the same requirements. The second argument for BCAs is ‘carbon leakage’ – the notion that emissions might move to countries where rules are less stringent. A third argument, of the highest political relevance, has to do with ‘leveraging’ the participation of developing countries in binding mitigation schemes or to adopt comparable measures to offset emissions by their own industries.

from a developing country perspective, at least three arguments run counter to that idea: 1) that the use of BCAs is a prima facie violation of the spirit and letter of multilateral trade principles and norms that require equal treatment among equal goods; 2) that BCAs are a disguised form of protectionism; and 3) that BCAs undermine in practice the principle of common but differentiated responsibilities.

In other words: the advocates are a strong domestic constituency with material arguments in places where BCAs might arise. The opponents are somewhere else and don’t get to vote, and armed with legalistic principles more than fear and greed.

Fuzzy VISION

Like spreadsheets, open-loop models are popular but flawed tools. An open loop model is essentially a scenario-specification tool. It translates user input into outcomes, without any intervening dynamics. These are common in public discourse. An example turned up in the very first link when I googled “regional growth forecast”:

The growth forecast is completed in two stages. During the first stage SANDAG staff produces a forecast for the entire San Diego region, called the regionwide forecast. This regionwide forecast does not include any land use constraints, but simply projects growth based on existing demographic and economic trends such as fertility rates, mortality rates, domestic migration, international migration, and economic prosperity.

In other words, there’s unidirectional causality from inputs  to outputs, ignoring the possible effects of the outputs (like prosperity) on the inputs (like migration). Sometimes such scenarios are useful as a starting point for thinking about a problem. However, with no estimate of the likelihood of realization of such a scenario, no understanding of the feedback that would determine the outcome, and no guidance about policy levers that could be used to shape the future, such forecasts won’t get you very far (but they might get you pretty deep – in trouble).

The key question for any policy, is “how do you get there from here?” Models can help answer such questions. In California, one key part of the low-carbon fuel standard (LCFS) analysis was VISION-CA. I wondered what was in it, so I took it apart to see. The short answer is that it’s an open-loop model that demonstrates a physically-feasible path to compliance, but leaves the user wondering what combination of vehicle and fuel prices and other incentives would actually get consumers and producers to take that path.

First, it’s laudable that the model is publicly available for critique, and includes macros that permit replication of key results. That puts it ahead of most analyses right away. Unfortunately, it’s a spreadsheet, which makes it tough to know what’s going on inside.

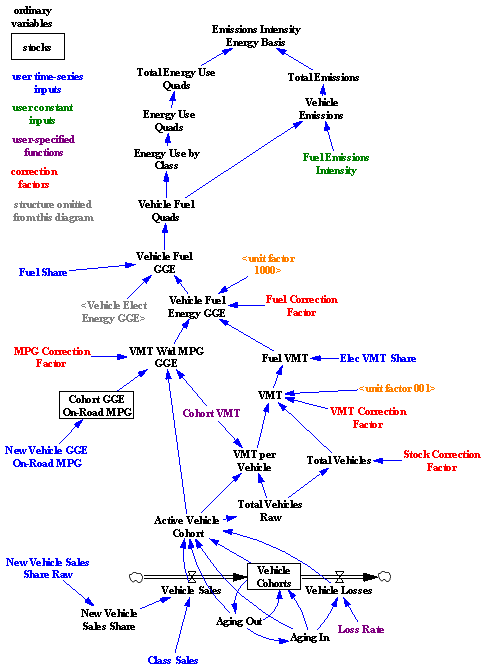
I translated some of the model core to Vensim for clarity. Here’s the structure:
VISION-CA

Bringing the structure into the light reveals that it’s basically a causal tree – from vehicle sales, fuel efficiency, fuel shares, and fuel intensity to emissions. There is one pair of minor feedback loops, concerning the aging of the fleet and vehicle losses. So, this is a vehicle accounting tool that can tell you the consequences of a particular pattern of new vehicle and fuel sales. That’s already a lot of useful information. In particular, it enforces some reality on scenarios, because it imposes the fleet turnover constraint, which imposes a delay in implementation from the time it takes for the vehicle capital stock to adjust. No overnight miracles allowed.

What it doesn’t tell you is whether a particular measure, like an LCFS, can achieve the desired fleet and fuel trajectory with plausible prices and other conditions. It also can’t help you to decide whether an LCFS, emissions tax, or performance mandate is the better policy. That’s because there’s no consumer choice linking vehicle and fuel cost and performance, consumer knowledge, supplier portfolios, and technology to fuel and vehicle sales. Since equilibrium analysis suggests that there could be problems for the LCFS, and disequilibrium generally makes things harder rather than easier, those omissions are problematic.

Continue reading “Fuzzy VISION”

The Trouble with Spreadsheets

As a prelude to my next look at alternative fuels models, some thoughts on spreadsheets.

Everyone loves to hate spreadsheets, and it’s especially easy to hate Excel 2007 for rearranging the interface: a productivity-killer with no discernible benefit. At the same time, everyone uses them. Magne Myrtveit wonders, Why is the spreadsheet so popular when it is so bad?

Spreadsheets are convenient modeling tools, particularly where substantial data is involved, because numerical inputs and outputs are immediately visible and relationships can be created flexibly. However, flexibility and visibility quickly become problematic when more complex models are involved, because:

  • Structure is invisible and equations, using row-column addresses rather than variable names, are sometimes incomprehensible.
  • Dynamics are difficult to represent; only Euler integration is practical, and propagating dynamic equations over rows and columns is tedious and error-prone.
  • Without matrix subscripting, array operations are hard to identify, because they are implemented through the geography of a worksheet.
  • Arrays with more than two or three dimensions are difficult to work with (row, column, sheet, then what?).
  • Data and model are mixed, so that it is easy to inadvertently modify a parameter and save changes, and then later be unable to easily recover the differences between versions. It’s also easy to break the chain of causality by accidentally replacing an equation with a number.
  • Implementation of scenario and sensitivity analysis requires proliferation of spreadsheets or cumbersome macros and add-in tools.
  • Execution is slow for large models.
  • Adherence to good modeling practices like dimensional consistency is impossible to formally verify

For some of the reasons above, auditing the equations of even a modestly complex spreadsheet is an arduous task. That means spreadsheets hardly ever get audited, which contributes to many of them being lousy. (An add-in tool called Exposé can get you out of that pickle to some extent.)

There are, of course, some benefits: spreadsheets are ubiquitous and many people know how to use them. They have pretty formatting and support a wide variety of data input and output. They support many analysis tools, especially with add-ins.

For my own purposes, I generally restrict spreadsheets to data pre- and post-processing. I do almost everything else in Vensim or a programming language. Even seemingly trivial models are better in Vensim, mainly because it’s easier to avoid unit errors, and more fun to do sensitivity analysis with Synthesim.

Lorenz Attractor

This is an implementation of Lorenz’ groundbreaking model that exhibits continuous-time chaos.

A google search turns up lots of good information on this model. For more advanced material, try google scholar.

I didn’t replicate this from Lorenz’ original 1963 article, Deterministic Nonperiodic Flow, but you can find a copy here.

Updated!

lorenz2.vmf

lorenz2.vpm