Via Economist’s View, Kotlikoff and Leamer suggest in the FT Economists’ Forum that we need a national holiday sale to fix the economy:
The same defensive mentality that allowed the sale of equities at fire sale prices threatens to cause a sharp drop in consumer spending, which accounts for 72 per cent of US GDP. If this happens, the economy will slide into deep recession.
We need to put a halt to self-fulfilling prophecies of doom. The key is realising that recessions are usually consumer cycles, not business cycles. They’re driven by weakening demand first for homes, then for consumer durables, and finally for non-durables and services. As consumers stop spending, businesses stop investing, and the economy ‘recedes’.A better way to spur consumer spending is for Uncle Sam to run a six-month national sale by having a) state governments suspend their sales taxes and b) the federal government make up the lost state sales revenues. The national sale could be implemented immediately.
…
Here’s how it would work. Uncle Sam would pay each state a fixed percentage ’“ say 5 per cent – of the 2007 consumption of its residents. States would be required to reduce their retail sales tax rates by enough to generate a six-month revenue loss (calculated using 2007 data) equal to the amount they’ll receive from Uncle Sam.For states with low or zero sales tax rates, implementing this policy requires making their sales tax rates negative, ie subsidising purchases. Shoppers would see a negative tax on their sales receipts, lowering their outlays. State governments would reimburse businesses for paying the subsidy and, in turn, be reimbursed by the Feds.
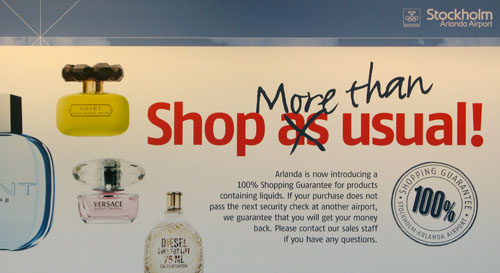
But wait, wouldn’t that accelerate the Shopocalypse?
Update: More seriously, isn’t this a terrible policy from an income distribution standpoint? It gives vastly different rewards to citizens with different consumption patterns. And how will states that don’t have a sales tax implement a negative one, without the reporting infrastructure to do so?